FY20 Results Dr. Ian Kadish (MD & CEO) Anne Lockwood (CFCO) 25 August 2020 - "Good Medicine is Good Business" - Bell Direct
←
→
Page content transcription
If your browser does not render page correctly, please read the page content below
FY20 Results
Dr. Ian Kadish (MD & CEO)
Anne Lockwood (CFCO)

25 August 2020

“Good Medicine is Good Business”
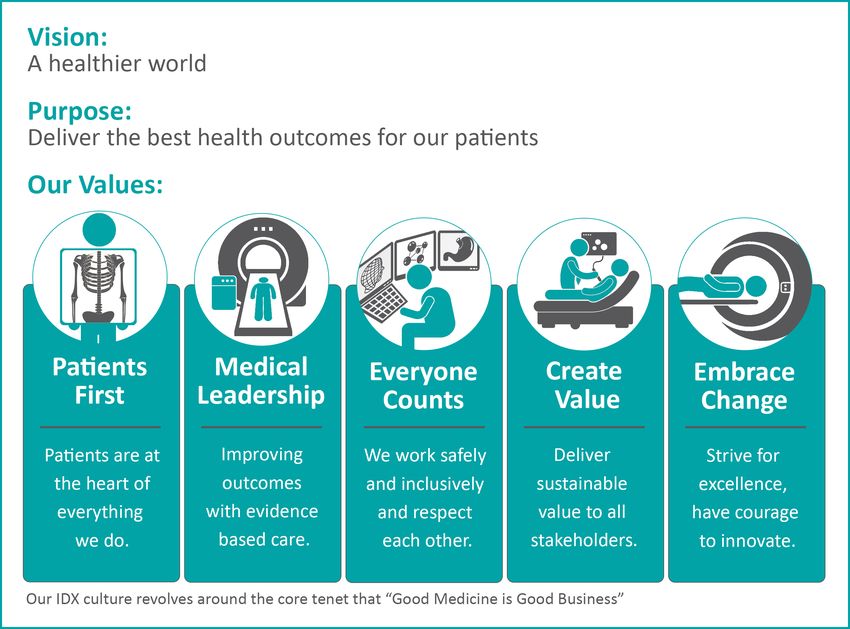
IDX VISION STATEMENT

Integral Diagnostics

                        2
DELIVERING ON OUR VALUES

        Patients          Medical                 Everyone                   Create              Embrace
          First          Leadership                Counts                    Value                Change
  • Served 660,000      • 196 reporting        • 1,341 employees        • Increased           • Implemented an e-
    patients              radiologists                                    Operating NPAT        referral pilot
                                               • Achieved an
                                                                          by 21.9% to           including patient
  • Serviced 30,300       • 110 employees        Employee NPS of
                                                                          $31.2m                and doctor portals
    referrers                                    25.5 vs DI industry
                          • 86 contractors                                                      to augment the
                                                 average of 15.7        • Increased
  • Performed 1.7m                                                                              delivery of results
                          • 63 radiologist                                operating diluted
    exams                                      • Reduced lost time
                            shareholders                                  EPS by 4.9% to      • Enhanced the IDX
                                                 injuries per million
  • Reduced adverse                                                       17.0cps               reporting platform
                        • First to market in     work hours by
    patient events to                                                                           to facilitate
                          Australia with         54%                    • Paid or Declared
FINANCIAL HIGHLIGHTS

     9.5%                21.9%                20.9%               4.9%                18.7%                 37.9%              18.2%
   increase             increase            increase            increase             increase             increase           improved
       in                  in                   in                  in                  in                     in
   Statutory           operating           operating           operating            operating             free cash          Net debt
     NPAT                 NPAT               EBITDA                EPS               revenue                 flow             /LTM
                                                                                                                             EBITDA
     $23.0m             $31.2m              $64.1m               17.0cps             $274.1m               $55.7m              1.8x

                                                        • Significant reductions in patient activity from March to June
                                                          • Impacted most in April
                                                          • Limited improvement in May
                                                          • June largely in line with pre COVID-19 expectations

      COVID-19                                          • Cost saving initiatives across contractors, employee costs, occupancy, equipment
                                                          and other discretionary spend implemented as revenue declined

                                                        • Australian and New Zealand Government assistance allowed IDX to retain and
                                                          support our highly skilled workforce and to position the business to meet demand
                                                          as it returned

  Declared a fully franked final dividend of 4.0cps; totalling 9.5cps for FY20 (FY19 10.0cps)
  • Decline of 5% reflects a conservative approach to cash management and is reflective of the on-going uncertainty due to COVID-19

Integral Diagnostics

                                                                                                                                        4
DI INDUSTRY COVID-19 IMPACT: AUSTRALIA
  Industry growth rates in Australia impacted by COVID-19 in March and June 2020
  quarters

                                                                       Industry growth
                                            12 month rolling growth rate by services                  12 month rolling growth rate by benefits
                                        -- Long Term Average 4.7% (2020 (1.4%))                     --Long Term Average 6.7% (2020 2.9%)
                         14.0%

                         12.0%

                         10.0%

                          8.0%

                          6.0%

                          4.0%

                          2.0%

                          0.0%

                         (2.0%)

                       Source: Medicare Australia Statistics Medicare by Broad Type of Service (BTOS) for the States IDX operates in

  Published industry data is not available for the New Zealand market

Integral Diagnostics

                                                                                                                                                 5
WE DID WHAT WE SAID WE WOULD DO
                                                    FY20 achievements

   Targeted capital investment     • Completed DI development at John Flynn Private Hospital, including new PET facility
  opportunities to drive organic   • Installed 2nd CT at Pindara Private Hospital to capitalise on the MRI full licence
             growth
                                   • Completed installation of a best in class Cardiac CT at St John Of God Hospital Geelong
                                   • Installed a CT in Bacchus Marsh Hospital to enhance service in a fast growing regional
                                     corridor
                                   • Relocated MRI from Ballarat Base Hospital to St John Of God Ballarat Hospital creating a
                                     centralised MRI super site improving patient experience, outcomes and efficiencies
                                   • Completed Peel Health Specialist Centre in Mandurah to service new oncology practice
                                   • Installed Phillips “compressed sense” technology in NZ to improve quality and efficiency
                                   • Opened a new site on the Gold Coast at Hope Island providing US, Xray and CT services

    Used digital technology to     • Continued to invest in proven AI software to improve clinical workflows and patient
     improve the patient and         outcomes, including the introduction of 2 new algorithms to our current suite
       referrer experience
                                   • Implemented an eReferral pilot along with patient and doctor portals to enhance the delivery
                                     of results and reliability of service
                                   • Augmented the IDX reporting platform to develop specialty-specific workflows
                                   • Continued to enhance cyber-security protections

    North Melbourne Specialist     • Offered advanced Cardiac CT and wide-bore 3T MRI services to Melbourne’s leading
      and Research Centre            specialists
                                   • Engaged with specialist referrers in Victoria’s premier medical precinct around the Royal
                                     Melbourne Hospital
                                   • This greenfield operation is behind business plan. Ramp up activities have been hampered
                                     by COVID-19

Integral Diagnostics

                                                                                                                                6
WE DID WHAT WE SAID WE WOULD DO CONTINUED
                                                    FY20 achievements

    Invested in recruitment and    • Continued to offer the radiologist equity plan which was over-subscribed
     retention of highly skilled
      radiologists, clinical and   • Conducted entity wide cultural survey to identify strengths and prioritise areas of
        administrative staff         improvement delivering an NPS of 25.5 (exceeding industry average of 15.7)
                                   • Focused on clinical risk analyses and oversight to provide the highest quality service to our
                                     patients and referrers
                                   • Promoted the IDX Values – Patients First; Medical Leadership; Everyone Counts; Create
                                     Value and Embrace Change

    Integrated acquisitions and    • Integrated Imaging Queensland into the IDX group
     evaluated further strategic
                                   • Continued integration of New Zealand and GMI to ensure all synergies are captured
            acquisitions
                                   • Focussed on new acquisitions in core strategic markets, delivering the acquisition of Ascot
                                     Radiology in Auckland on track for completion 1 September 2020

         Developed our key         • Continued to work closely with ADIA to focus on industry solutions for digital health,
      relationships and helped       Radiologist workforce shortages, effective implementation of MBS review recommendations
        shape the regulatory         and indexation for Nuclear Medicine and MRI items
              landscape            • Continued to develop strong relationships with our referrers, hospital owners, local and
                                     federal members and key funders
                                   • Promoted the benefits of MRI and PET technologies so that they’re widely understood and
                                     recognised by patients, payors and referrers

Integral Diagnostics

                                                                                                                               7
FY20 financial performance
RESULTS PRIOR TO IMPACT OF AASB 16(1)
Operating FY20 results delivered strong growth and a defensive performance
across the group despite COVID-19
 $ millions                                               FY20                       FY19                    Change ($)                 Change (%)
Operating revenue(2)                                     274.1                       231.0                       43.1                       18.7%
Operating EBITDA (3)                                      64.1                        53.0                       11.1                       20.9%
EBITDA operating margin                                  23.3%                      22.9%                        0.4%                       1.7%
Operating EBITA                                           49.3                        42.0                        7.3                       17.4%
Operating NPAT                                            31.2                        25.6                        5.6                       21.9%
Operating Diluted EPS (cents) (4)                         17.0                        16.2                        0.8                       4.9%
Statutory NPAT (includes AASB 16)                         23.0                        21.0                        2.0                       9.5%

Free cash flow                                            55.7                        40.4                       15.3                       37.9%
Free cash flow conversion, net of
                                                        101.6%                      97.0%
replacement capex
Dividends declared cents per share                         9.5                        10.0                       (0.5)                       (5%)
As at:                                              30 June 2020                30 June 2019
Net debt                                                 124.4                       119.0
Net debt / LTM EBITDA(5)                                  1.8x                        2.2x
Equity                                                   228.3                       127.2                      101.1                       79.5%
1.   AASB 16 is the Australian Accounting Standard 16 “Leases” a newly adopted accounting standard effective from 1 July 2019
2.   Represents operating revenue and excludes other revenue in FY20 of $1.5m (FY19 $1.4m)
3.   One off costs not included in operating metrics include transaction and other costs, net of tax of $8.2m (FY19 $4.6m) – see slide 11
4.   Operating Diluted EPS calculation for FY20 has been adjusted in order for the weighted average calculation of shares on the capital raise to align with
     the settlement date of Imaging Queensland acquisition being 1 November 2019 from 4 September 2019 for the Institutional placement and 30
     September 2019 for the Retail entitlement offer. Aligning the dates provides a more accurate reflection of the underlying EPS and increases the Diluted
     EPS by 0.3cps to 17.0cps
5.   Based on net debt at 30 June 2020 of $124.4m and LTM organic EBITDA (plus trailing acquisitions EBITDA) of $69.0. FY19 based on net debt at 30
     June 2019 of $119.0m and LTM EBITDA organic EBITDA (plus trailing acquisitions EBITDA) of $54.1m

Integral Diagnostics

                                                                                                                                                           9
RESULTS WITH IMPACT OF AASB 16 FOR FY20(1)
Upward impact to FY20 EBITDA $11.6m, EBIT $1.8m and decline impact on NPAT
($0.8m)
$ millions FY20 FY19(6) Change ($) Change (%)
Operating revenue(2) ( no change from AASB 16) 274.1 231.0 43.1 18.7%
Operating EBITDA(3) ($11.6m uplift is impact of AASB 16) 75.7 53.0 22.7 42.8%
EBITDA operating margin (4.7% uplift is impact of AASB 16) 27.6% 22.9% 4.7% 20.5%
Operating EBITA ($1.8m uplift is impact of AASB 16) 51.1 42.0 9.1 21.6%
Operating NPAT ($0.8m decrement is impact of AASB 16) 30.4 25.6 4.8 18.8%
Operating Diluted EPS(4) (cents) (0.4cps decrement is impact 16.6 16.2 0.4 2.5%
of AASB 16)
Statutory NPAT ($0.8m decrement is impact of AASB 16) 23.0 21.0 2.0 9.5%
Free cash flow 55.7 40.4 15.3 37.9%
Free cash flow conversion, net of replacement capex 101.6% 97.0%
As at: 30 June 2020 30 June 2019
Net debt 124.4 119.0
Net debt / LTM EBITDA(5) 1.5x 2.2x
Equity 228.3 127.2 101.1 79.5%
1. AASB 16 is the Australian Accounting Standard 16 “Leases” a newly adopted accounting standard effective from 1 July 2019
2. Represents operating revenue and excludes other revenue in FY20 of $1.5m (FY19 $1.4m)
3. One off costs not included in operating metrics include transaction and other costs, net of tax of $8.2m (FY19 $4.6m) – see slide 11
4. Operating Diluted EPS calculation for FY20 has been adjusted in order for the weighted average calculation of shares on the capital raise to align with
the settlement date of the Imaging Queensland acquisition being 1 November 2019 from 4 September 2019 for the Institutional placement and 30
September 2019 for the Retail entitlement offer, aligning the dates provides a more accurate reflection of the underlying EPS and increases the Diluted
EPS by 0.3cps to 16.6cps
5. Based on net debt at 30 June 2020 of $124.4m and LTM organic EBITDA (plus trailing acquisitions EBITDA) of $81.6m. FY19 based on net debt at 30
June 2019 of $119.0m and LTM EBITDA organic EBITDA (plus trailing acquisitions EBITDA) of $54.1m
6. FY19 results are not restated as per transitional accounting provisions adopted under AASB 16
Based on the lease portfolio as at 30 June 2020 including the leases included in the Ascot acquisition the expected impacts of the application of
AASB 16 on the FY21 results are an increment to EBITDA of $12.3m, an increment to EBIT of $2.1m and a decrement to NPAT of ($0.8m).
Integral Diagnostics
10RECONCILIATION OF OPERATING TO STATUTORY
$ million FY20 FY19 Change ($) Change (%)
Operating NPAT 31.2 25.6 5.6 21.9%
Non operating transactions net of tax
Transaction and integration costs (4.8) (1.9)
Share based payments (1.3) (0.6)
Amortisation customer contracts (1.2) (2.5)
(1)
Write off of brand name (Western District Radiology) (0.1) -
Business development costs - (0.4)
First time application of AASB 16 (0.8) -
Forex gain on NZ debt - 0.8
Statutory NPAT 23.0 21.0
$ million FY20 FY19 Change ($) Change (%)
Operating EBITDA 64.1 53.0 11.1 20.9%
Non operating transactions
Transaction and integration costs (5.1) (2.5)
Share based payments (1.3) (0.6)
Business development costs - (0.6)
Forex gain on NZ debt - 1.2
(1)
Write off of brand name (Western District Radiology) (0.1) -
First time application of AASB 16 11.6 -
Statutory EBITDA 69.2 50.5
• FY20 transaction costs, $2.8m and integration costs, $0.6m are from external advisors on the Imaging Queensland and Ascot Radiology
acquisitions plus Warranty and Indemnity Insurance, $0.7m and Stamp Duty, $1.0m on Imaging Queensland
• FY20 Share based payment costs relate to the performance rights and the radiologists loan funded share/option plan
• FY20 Amortisation of customer contracts relates to NZ contracts, which are now fully amortised and Imaging Queensland contracts which will
be amortised over the remaining life at $0.62m pa
• FY 20 impact of the implementation of AASB 16 are an uplift to EBITDA of $11.6m and a decline in NPAT of $0.8m
(1) Included in other expense categories in the Statutory Consolidated Statement of Profit and Loss
Integral Diagnostics
11GROWTH IN SHAREHOLDER RETURNS
Operating EBITDA - millions
70
60
50
40 64.1
53.0
30 34.9 38.1
33.5
20
FY 16 FY 17 FY 18 FY 19 FY 20
IDX Dividends
Dividend cents per share
10.0 9.5
8.0
7.0 5.0 4.0
4.0(1) 4.0
4.0
5.0 5.5
4.0 3.0 4.0
FY 16 FY 17 FY 18 FY 19 FY 20
Interim Dividend Final Dividend
• Strong consistent growth in operating EBITDA and dividends
• Fully franked dividend of 4.0 cps declared totalling 9.5cps for the FY20 year
• The FY20 dividend record date is 31 August 2020 with a payment date on 1 October 2020
• The IDX dividend reinvestment plan is available for participation for the FY20 final dividend
(1) IDX listed on the Australian Stock Exchange in October 2015, in line with the Prospectus a 1H16 dividend was not paid
Integral Diagnostics
12REVENUE
Solid underlying growth driven by new sites, investment in new equipment and eight months
contribution from Imaging Queensland despite COVID-19 causing declines in revenue from
March onward
Operating revenue up 18.7% to $274.1m
• Revenue Growth of $43.1 driven by
• Imaging Queensland $38.7m
• Organic Growth - Australia $4.8m
• Offset by declining revenue contribution in NZ of $0.4m due to stage 4 COVID-19 restrictions
• Organic revenue growth in Australia of 2.4% and volume declines of (1.7%) – slightly lower than industry average for the
states in which we operate (2.9% and (1.4%) respectively) reflecting that IDX significantly outperformed the industry in
FY19 by 1.3% and 1.7% respectively and the Medicare rates are reflective of 52 new MRI licences issued in FY19
• New Zealand contributed revenue of FY20 $A24.8 (FY19 $A25.2m) – $0.4m decline due to stage 4 COVID-19
restrictions
• Pre COVID-19 and excluding Imaging Queensland organic revenue was growing at 7.0% in Australia and 5.5% in New
Zealand
• Average fee per exam (excluding reporting contracts and Imaging Queensland) increased by 1.7% in FY20, driven by
increased volume off CT, PET scans and MRI’s. This was particularly evident during COVID-19 where volumes of
higher end modalities did not decline in the same proportion as lower end modalities
(1) Revenue is higher than volume growth as growth has been stronger in the higher end modalities of MRI, CT, Nuc Med and interventionalist work in line with IDX
business model. Excluding reporting contracts, average fee per exam continues to increase in FY20.
Integral Diagnostics
13OPERATING EXPENDITURE
IDX continued to focus on cost control and was able to deliver responsible cost reductions
to mitigate revenue declines in response to COVID-19
Operating margin of 23.3% slightly increased due to the financial impacts of
COVID-19. IDX continues to deliver industry leading operating margins across
Australia and New Zealand
• Employee costs declined by 0.5% as a % of revenue despite increased wage costs as % of revenue during COVID-19
as we supported our workforce with the assistance of JobKeeper, NZ wages subsidy and payroll tax subsidies of
$6.1m after tax
• Consumables remained at 4.5% of revenues despite increased expenditure on PPE due to COVID-19
• Equipment declined as a % of revenue by 0.6% due to savings being derived from national supply arrangements on
service contracts and rebates received due to COVID-19 of $0.2m
• Occupancy costs pre application of AASB 16 declined slightly as a % of revenue reflecting $0.7m of rent rebates
received due to COVID-19
• Other costs remained at 6.9% of revenue. This was driven by reductions in discretionary spend as a result of COVID-19
offset by pre COVID-19 on-going investments in technology and the expansion of our operating platforms around
human resources, finance, governance and risk management to ensure growth can be appropriately managed and
supported
• Depreciation of $14.8m (FY19 $10.5m) increased $4.3m, reflecting the growth capital investments made over the last
24 months plus eight months of Imaging Queensland
• Refinanced debt facilities and declining interest rates delivered lower finance costs of $5.6m (FY19:$6.2m ), pre AASB
16 on higher net debt
Integral Diagnostics
14CAPITAL MANAGEMENT – POST AASB 16 APPLICATION
Strong balance sheet with reduced leverage to support on-going growth strategy
$ millions 30 Jun 20 30 Jun 19 30 Jun 18
• FY20 net debt of $124.4m (FY20: $119m) Cash and cash equivalents 58.0 21.0 20.8
Trade and other receivables 10.4 9.0 5.6
• Reducing 1.8x EBITDA prior to one off
transactions as at 30 June 2020 (FY19 2.2x) Other current assets 8.0 3.8 3.9
Total current assets 76.4 33.8 30.3
• Average cost of cash advance facility approx 2.4%
Property, plant and equipment 101.0 70.8 54.1
• Trade and other receivables increased $1.4m from Right of use assets – AASB16 88.5 - -
June 2019 due to IQ Intangible assets 300.9 202.3 103.6
• Other assets increased from June 2019 $4.2m, due to Deferred tax asset 13.6 7.8 7.5
increased inventory of $0.6m, JobKeeper receivable Total non-current assets 504.0 280.9 165.2
$2.9m and IQ Total assets 580.4 314.7 195.5
• AASB 16 adds a “right of use asset” $88.5m and a Trade and other payables 18.5 16.0 12.1
liability for “lease payment obligations” $96.1m Current tax liabilities 4.7 1.7 0.3
Borrowings 13.2 9.0 12.8
• Intangible assets of $300.9m includes Goodwill,
$86.8m, brands $10.0m, and customer contracts of Lease obligations – AASB 16 9.6 - -
$3.8m recognised on the IQ acquisition Deferred Consideration 6.9 - -
Provisions 16.7 12.2 10.7
• Provisions and payables increased $5.9m from June Total current liabilities 69.6 38.9 35.9
2019 due to IQ Deferred Consideration 8.0 1.5 -
• Borrowings increased $42.8m -$20m draw down to fund Provisions 7.9 9.0 52.6
working capital in response to COVID-19 $15m from Borrowings 168.6 130.1 8.9
draw down to fund IQ, $10.3m existing IQ debt and Lease obligations – AASB 16 86.5 - -
additional asset financing less repayments
Deferred tax liability 11.5 8.0 4.7
• Deferred consideration of $14.9m relates to New Total non-current liabilities 282.5 148.6 66.2
Zealand $1.7m, GMI $1.2m and IQ $12m Total liabilities 352.1 187.5 102.1
• Net assets increased $101.1m (79.5%) Net assets 228.3 127.2 93.4
Integral Diagnostics
15CASHFLOW AND CASH CONVERSION
Strong business performance and cash conversion reflected in free cash flow growth
FY20 FY20 • The application of AASB 16 will result in the
$ millions Pre AASB Post FY19 same free cash flows (after adjusting for
16 AASB 16 cashflows on leases) however, conversion %
will decline given the higher EBITDA
Operating EBITDA 64.1 75.7 53.0
Non-cash items in EBITDA 0.6 0.5 (0.3) • Normalised free cash flow conversion of
Changes in working capital 0.4 0.4 (1.3) 86.9% (FY19 76.2%) – 101.6% net of
replacement capex
Replacement capital (9.4) (9.4) (11.0)
expenditure
Cash payments on leases - (11.5) - • Growth capex $9.0m higher in FY20 v FY19
Free cash flow 55.7 55.7 40.4
• Changes in working capital is net of accruals
Growth capital expenditure (16.7) (16.7) (7.7)
for non operating transaction costs and Capex
Net cash flow before
financing, acquisitions and 39.0 39.0 32.7
taxation
Free cash flow / EBITDA 86.9% 73.6% 76.2%
Integral Diagnostics
16CAPITAL EXPENDITURE
Increase in capex commensurate with size of the business and investment for future growth
in line with our strategy
$ millions(1) FY20 FY19 FY18
Replacement 9.4 10.7 8.8
Growth 16.7 9.7 5.2
Total 26.1 20.4 14 .0
Depreciation 14.8 10.5 9.2
Replacement capex of $9.4m lower than depreciation
• Refurbishment and re-location of MRI in Ballarat - $3.4m
• Pindara CT screening room and 2 US units - $1.2m
• Other medical equipment – $3.0m
• IT equipment and upgrades - $1.8m
Growth capex of $16.7m
• John Flynn Hospital on the Gold Coast redevelopment and PET centre - $7.8m
• Peel Health Centre in Mandurah oncology development - $1.2m
• Pindara Hospital on the Gold Coast Cardiac CT - $1.4m
• New site at Hope Island on the Gold Coast - $1.6m
• New CT at Bacchus Marsh Hospital - $1.4m
• Software and infrastructure -$1.5m
(1) Represents cash + accruals
Integral Diagnostics
17COVID-19
IMPACTS OF COVID-19 ON FINANCIAL PERFORMANCE – FY20

Patient Activity
• Overall the Government imposed restrictions, including the cancellation of elective surgery and sporting activities, as well
  as a slowdown in regular hospital activity and patients’ reluctance to visit their doctors, resulted in significant declines in
  diagnostic imaging volumes
• The declines started towards the end of March, were at their highest in April with declines ranging between 24% and 50%
  across the business units from pre COVID-19 expectations, activity started to improve in May with June revenues largely
  in line with pre COVID-19 projections
• Pre COVID-19 and excluding Imaging Queensland organic revenue was growing at 7% in Australia and 5.5% in New
  Zealand

        • For the year ended 30 June 2020 excluding Imaging Queensland Australian organic revenue grew at 2.4%

        • For the year ended 30 June 2020 New Zealand revenue declined by (1.6%)
Labour Costs
• Rostering was implemented to reflect the activity in each of our sites. This resulted in significant reductions in the use of
  contractors as well as a number our people utilising annual leave and/or leave without pay, whilst maintaining our focus on
  staff and patient safety. The Non-executive and Executive Directors agreed to a 20% reduction in their Board fees in April,
  May and June. The CEO and CFCO agreed to a 20% reduction in their fixed remuneration in April and May
• IDX qualified for and received $5.4m after tax in JobKeeper subsidy across parts of the Australian business and $0.3m
  after tax in New Zealand. In addition payroll tax subsidies of $0.4m after tax were received in Australia. These subsidies
  assisted IDX to avoid enacting stand downs across the business and implementing further reductions for employees

Integral Diagnostics

                                                                                                                                    19
IMPACTS OF COVID-19 ON FINANCIAL PERFORMANCE – FY20
Consumables
• With our number one priority being the safety of our people and patients, we secured adequate supply of personal
protective equipment for all our hospital and community sites and instituted strict screening, hygiene and infection control
protocols
• This resulted in increased costs through the profit and loss of consumables over and above normal levels as well as
increased holdings of consumable stocks on hand to ensure ongoing adequate supply. Inventory on hand as at 30 June
2020 $1.0m (2019:$0.4m)
Occupancy and Equipment Costs
• Reductions in rentals across April to June were negotiated and agreed with the majority of our landlords across our 72
leased properties. Cost reductions of approximately $0.7m were recognised over April to June 2020. All costs have now
resumed to normal operating levels
• Reductions in service costs on equipment across April to June was negotiated and agreed with our equipment providers.
Cost reductions of approximately $0.2m were recognised over April to June 2020. All repairs and maintenance of
equipment continued on as normal and all costs have now resumed to normal operating levels
Other Expenditure
• During the pandemic all non-essential operating expenditure was ceased or reduced as much as practicable. A
percentage of these costs reflect deferral of planned projects that will be incurred in FY21. As restrictions remain in place
there continues to be deferral of some discretionary spend
Integral Diagnostics
20RESPONSE TO ONGOING IMPACTS OF COVID-19 DURING
FY21
Current patient activity
• July and to date August 2020 revenue has delivered a return of positive growth across all business units except where
Government imposed restrictions due to COVID-19 have been re-instated:
• Lake Imaging in Victoria (representing approximately 25% of Group revenue) where revenues were similar to prior
year in July and as at 23rd August 7% down on prior year for the month
• New Zealand (representing approximately 9% of Group Revenue (pre-Ascot acquisition) where revenues were 18%
above prior year in July and as at 23rd August 4.6% down on prior year for the month
Current restrictions in our operating geographies
On the 2nd August 2020 the Victorian Government announced Stage 4 restrictions for metropolitan Melbourne and a return
to Stage 3 restrictions for regional Victoria. The restrictions include a cancellation of non-urgent elective surgery and sporting
activities, as well as a slow down in regular hospital activity and patients’ reluctance to visit their doctors, resulting in declines
in diagnostic imaging volumes in our Victorian sites.
On the 11th August 2020 the New Zealand Government announced Stage 3 restrictions for Auckland which allowed
healthcare service providers to continue to operate as normal however there is a patients’ reluctance to visit their doctors,
resulting in declines in diagnostic imaging volumes in our New Zealand sites.
As at the 23rd August the restrictions in Victoria and New Zealand remain in place.
Integral Diagnostics
21RESPONSE TO ONGOING IMPACTS OF COVID-19 DURING
FY21
• The pandemic and associated Government response can be expected to continue to have an impact on the Group,
which cannot be accurately projected at this time
• Our focus, as always, will be to keep our patients and employees safe and this will always be put before commercial
outcomes. We will continue to ensure we have adequate supplies of personal protective equipment for all our hospitals
and community sites and keep strict screening, hygiene and infections control protocols in place
• IDX has a strong growth agenda with our cost base supporting our growth objectives. IDX will continue to focus on
responsibly managing costs to mitigate revenue declines whilst ensuring we remain well placed to continue our growth
objectives when activity returns across our operating geographies
• The continuing support from Government in the form of JobKeeper of approximately $5.5m after tax from July to
September will assist in withstanding ongoing impacts throughout recovery, to retain our skilled workforce and to
mitigate declining revenues as a result of on-going impacts from COVID-19
• To date there are no indications that COVID-19 will have material on-going impacts for the diagnostic imaging industry
nor will the underlying fundamentals driving ongoing growth and funding models for diagnostic imaging be materially
altered
• IDX continues to explore and develop plans for growth both organically and through acquisition opportunities. We will
continue to approve growth business cases with consideration of the business case merits and with continued discipline
Integral Diagnostics
22Regulatory update
REGULATORY ENVIRONMENT ACTIVITY
  Australia:
  MRI Licences
  •     52 full MRI Licenses issued in FY19 of which IDX received an upgrade from a partial to full at Pindara Hospital on the
        Gold Coast. Competitors licences issued in Geelong and Mandurah have not to date materially impacted IDX’s MRI
        performance in these areas
  •     No further licences or plans for MRI licences have been announced
  November 2019
  •     Introduction on the Medicare Benefits Schedule (MBS) of Breast MRI and PET – the addition of these MBS items
        provides patients and clinicians access to valuable best practice tools for early detection and staging of breast cancer
        which has the ability to change patient management for the better
  April 2020
  • As a result of COVID-19 the Government relaxed the attendance rules for radiologists on some examinations as well as
    allowed electronic referrals and upfront billing, these were welcomed changes that have merit in a non COVID environment
  May 2020
  •     New MBS items commenced around MR-guided prostate biopsy as well as the removal of the dedicated equipment
        restriction for cone beam CT – these are not significant changes
  July 2020
  •     Commencement of indexation across 90% of MBS items, equating to 80% of benefits at a rate of 1.5%
  August 2020
  • Restructure of echocardiography and myocardial study items to better align with clinical guidelines and reduce low value
    care to reflect modern clinical practice introducing 19 new items and deleting 9 existing items – these are not significant
    items

Integral Diagnostics

                                                                                                                                   24
REGULATORY ENVIRONMENT ACTIVITY
IDX continues to work through membership of the executive of the Australian Diagnostic Imaging Association (ADIA)
to address key regulatory issues within the industry including:
• Extension of indexation across the remaining Medicare items
• Funding settings to promote efficient provision for outpatient services
• Appropriate funding for Radiology services provided to veterans
• Patient bill relief
New Zealand:
• No material changes. Annual indexation provided across all contracts. The Auckland DI market is expected to
continue to grow, driven by ageing demographics and adoption of new technologies that improve patient outcomes
• The 2020 NZ general election has been set for 17/10/2020. No material changes have been flagged to date that
may impact diagnostic services
Integral Diagnostics
25Strategy
IDX OPERATES IN KEY GEOGRAPHIC MARKETS
(INCLUDING ASCOT RADIOLOGY)

                                                                                                                                           Total IDX

      Geographic                                                          Western
                                 Victoria           Queensland                              New Zealand            Queensland
        Market                                                            Australia
                                Ballarat,
                               Geelong,                                                                             Sunshine
                                                    Gold Coast,          South West
                             Warrnambool                                                                              Coast,
    Core markets                                    Toowoomba             Western              Auckland
                               and outer                                                                          Rockhampton
                                                    and Mackay            Australia
                             western areas                                                                        and Gladstone
                             of Melbourne
         Sites
      (includes                     22                    14                   5                   13                    19                    73
    hospital sites)

    Hospital sites                   6                     2                   4                    1                     8                    21

    MRI machines                     7                     7                   2                    6                     6                    28

                                  4 full                 4 full              2 full                                     3 full              13 full
    MRI Licences                                                                                  N/A
                                0 partial              2 partial           0 partial                                  2 partial            4 partial
     Employed
                                    39                    31                  13                  322                    16                   131
    Radiologists1

  # of Employees3                  369                   387                  163                 191                   289                  1,3994

  Note: Reflects current data as at June 2020 with Ascot on track to join the group from 1 September 2020
        1 Relates to employed radiologists only. In addition IDX has had 86 contractor radiologists provide services over FY20
        2 Consistent with the NZ private radiology model, all doctors work across the public and private sector and meet the criteria to be classified as
           contractors but are on terms and conditions similar to IDX employed Radiologists – 21 doctors join IDX on completion of Ascot
        3 This number represents the number of employees on employment contracts on either part time or full time arrangements, it does not represent
           the number of full time equivalent employees or individual casual/contract arrangements
        4 In addition, there are 49 employees in the Corporate office, totalling 1,448 employees across IDX
Integral Diagnostics

                                                                                                                                                            27
MANAGEMENT’S FY21 STRATEGY – GOOD MEDICINE IS STILL
GOOD BUSINESS
Strategy 1 Grow existing business and margin 2 Strategic acquisitions
Accelerate use
Drive organic of digital and Nurture and
AI technology Drive our
Drivers of growth, develop
to improve the environmental,
strategy business culture and Evaluate further strategic
patient and social and
integration and leadership acquisitions
referrer governance
further across our
experience agenda
efficiency gains people
Integral Diagnostics
28FY21 KEY PRIORITIES AND FOCUS
FY21 Priorities and Focus
• Manage ongoing impacts of COVID-19
Drive organic growth,
business integration • Continue to integrate Imaging Queensland and integrate Ascot Radiology into the IDX Group
and further efficiency • Ensure capex investment continues to generate strong returns
gains • Promote benefits of MRI and PET technologies so that they’re widely understood and recognised by
patients, payors and referrers
• Continue to develop and execute on the AI and broader technology strategy
Continue to accelerate • Complete implementation of the Patient App across the whole group to improve access, knowledge
use of digital and AI and flexibility of service for the patient and referrer
technology to improve • Leverage the consolidated reporting platform to develop sub speciality workflows for complex clinical
the patient and referrer cases to deliver best in class comprehensive reports to referrers and patients
experience
Environmental, social • Focus on IDX’s environmental, social and governance agenda to acknowledge areas in which we
and governance already apply best practice and to identify areas where we can do better with specific focus on:
agenda • Ethical supply chains, responsible consumption and our carbon footprint, diversity and
inclusion, community relationships, corporate governance and reporting of our ESG scorecard
• Support Company growth with investment in a Chief Medical Officer, Chief Operating Officer and
Nurture and develop Group Integration and Strategy Manager
culture and leadership
across our people • Develop the leadership capabilities of people across our group, including management, radiologists,
clinical and administrative staff
• Undertake analyses and due diligence on selected acquisitions that are a clinical fit, strategically
Evaluate further aligned and earnings accretive
strategic acquisitions
• Considering several growth opportunities in a very active healthcare sector
Integral Diagnostics
29QUESTIONS?
Integral Diagnostics
30DISCLAIMER
Some of the information contained in this presentation contains “forward-looking statements” which may not directly or
exclusively relate to historical facts. These forward-looking statements reflect Integral Diagnostics Limited (IDX) current
intentions, plans, expectations, assumptions and beliefs about future events and are subject to risks, uncertainties and
other factors, many of which are outside the control of IDX.
Important factors that could cause actual results to differ materially from the expectations expressed or implied in the
forward-looking statements include known and unknown risks. Because actual results could differ materially from IDX
current intentions, plans, expectations, assumptions and beliefs about the future, you are urged to view all forward-
looking statements contained herein with caution.
To the maximum extent permitted by law, none of IDX, or its respective affiliates or related bodies corporate or any of
their respective officers, directors, employees and agents (Related Parties), nor any other person, accepts any
responsibility or liability for, and makes no recommendation, representation or warranty concerning, the content of this
presentation, IDX, the Group or IDX securities including, without limitation, any liability arising from fault or negligence,
for any loss arising from the use of or reliance on any of the information contained in this presentation or otherwise
arising in connection with it.
Reliance should not be placed on the information or opinions contained in this presentation. This presentation is for
informational purposes only and is not a financial product or investment advice or recommendation to acquire IDX
securities and does not take into consideration the investment objectives, financial situation or particular needs of any
particular investor. You should make your own assessment of an investment in IDX and should not rely on this
presentation. In all cases, you should conduct your own research of IDX and the Group and analysis of the financial
condition, assets and liabilities, financial position and performance, profits and losses, prospects and business affairs of
IDX, the Group and its business, and the contents of this presentation. You should seek legal, financial, tax and other
advice appropriate to your jurisdiction.
Integral Diagnostics
31CONTACT US
Investors & Media
Dr Ian Kadish, MD & CEO
P: +61 3 5339 0704
E: ikadish@idxgroup.com.auYou can also read