STRATEGIC MERGER TRANSACTION - PIONEER BANCSHARES, INC. July 6, 2021 - Pioneer Bank

Page created by Frank Potter
 
CONTINUE READING
STRATEGIC MERGER TRANSACTION - PIONEER BANCSHARES, INC. July 6, 2021 - Pioneer Bank
PIONEER
                                   BANCSHARES, INC.

STRATEGIC MERGER TRANSACTION
July 6, 2021

   PIONEER
                      STRATEGIC MERGER COMBINATION
   BANCSHARES, INC.
STRATEGIC MERGER TRANSACTION - PIONEER BANCSHARES, INC. July 6, 2021 - Pioneer Bank
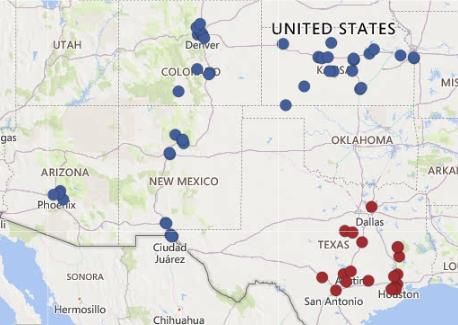
Cautionary Statement Regarding Forward-Looking Statements
Statements included in this communication, which are not historical in nature are intended to be, and hereby are identified as, forward-looking statements within the
meaning of the Private Securities Litigation Reform Act of 1995. Examples of forward-looking statements include, but are not limited to, statements regarding the outlook
and expectations of FirstSun Capital Bancorp (“FirstSun”) and Pioneer Bancshares, Inc. (“Pioneer”) with respect to their planned merger, the strategic benefits and financial
benefits of the merger, including the expected impact of the transaction on the combined company’s future financial performance (including anticipated accretion to
earnings per share and other operating and return metrics), and the timing of the closing of the transaction. Words such as “may,” “anticipate,” “plan,” “estimate,”
“expect,” “project,” “assume,” “approximately,” “continue,” “should,” “could,” “will,” “poised,” “focused,” “opportunity,” “plans” and variations of such words and similar
expressions are intended to identify such forward-looking statements.

Forward-looking statements are subject to risks, uncertainties and assumptions that are difficult to predict with regard to timing, extent, likelihood and degree of
occurrence, which could cause actual results to differ materially from anticipated results. Such risks, uncertainties and assumptions, include, among others, the following:

•        the failure to obtain necessary regulatory approvals when expected or at all (and the risk that such approvals may result in the imposition of conditions that could
adversely affect the combined company or the expected benefits of the transaction);

•          the failure of Pioneer to obtain shareholder approval, or the failure of either party to satisfy any of the other closing conditions to the transaction on a timely basis
or at all;

•         the occurrence of any event, change or other circumstances that could give rise to the right of one or both of the parties to terminate the merger agreement;

•         the possibility that the anticipated benefits of the transaction, including anticipated cost savings and strategic gains, are not realized when expected or at all,
including as a result of the impact of, or problems arising from, the integration of the two companies or as a result of the strength of the economy, competitive factors in the
areas where FirstSun and Pioneer do business, or as a result of other unexpected factors or events;

•       the impact of purchase accounting with respect to the transaction, or any change in the assumptions used regarding the assets purchased and liabilities
assumed to determine their fair value;

•         diversion of management’s attention from ongoing business operations and opportunities;

•         potential adverse reactions or changes to business or employee relationships, including those resulting from the announcement or completion of the transaction;

•         the outcome of any legal proceedings that may be instituted against FirstSun or Pioneer;

•        the integration of the businesses and operations of FirstSun and Pioneer, which may take longer than anticipated or be more costly than anticipated or have
unanticipated adverse results relating to FirstSun’s or Pioneer’s existing businesses;

•         business disruptions following the merger; and

•        other factors that may affect future results of FirstSun and Pioneer including changes in asset quality and credit risk; the inability to sustain revenue and earnings
growth; changes in interest rates and capital markets; inflation; customer borrowing, repayment, investment and deposit practices; the impact, extent and timing of
technological changes; capital management activities; and other actions of the Federal Reserve Board and legislative and regulatory actions and reforms.

Annualized, pro forma, projected and estimated numbers are used for illustrative purpose only, are not forecasts and may not reflect actual results. FirstSun and Pioneer
disclaim any obligation to update or revise any forward-looking statements contained in this communication, which speak only as of the date hereof, whether as a result of
new information, future events or otherwise, except as required by law.

             PIONEER
                                   STRATEGIC MERGER COMBINATION                                                                                                                        2
             BANCSHARES, INC.
Additional Information About the Merger and Where to Find It
This communication is being made in respect of the proposed merger transaction between FirstSun and Pioneer. In connection with the proposed merger, FirstSun will file a
registration statement on Form S-4 with the SEC to register FirstSun’s shares that will be issued to Pioneer’s shareholders in connection with the merger. The registration
statement will include a proxy statement of Pioneer and a prospectus of FirstSun, as well as other relevant documents concerning the proposed transaction. INVESTORS ARE
URGED TO READ THE REGISTRATION STATEMENT AND THE PROXY STATEMENT/PROSPECTUS REGARDING THE MERGER WHEN IT BECOMES AVAILABLE AND ANY OTHER RELEVANT
DOCUMENTS FILED WITH THE SEC, AS WELL AS ANY AMENDMENTS OR SUPPLEMENTS TO THOSE DOCUMENTS, BECAUSE THEY WILL CONTAIN IMPORTANT INFORMATION.

This communication does not constitute an offer to sell or the solicitation of an offer to buy any securities or a solicitation of any vote or approval, nor shall there be any sale
of securities in any jurisdiction in which such offer, solicitation or sale would be unlawful prior to registration or qualification under the securities laws of such jurisdiction.

A free copy of the proxy statement/prospectus, when it becomes available, as well as other documents filed with the SEC by FirstSun may be obtained at the SEC’s Internet
site at http://www.sec.gov. You will also be able to obtain these documents, free of charge, once available, from FirstSun, by directing a request by mail to FirstSun Capital
Bancorp, 1400 16th Street, Suite 250, Denver, Colorado 802020, Attention: Stockholder Relations, or by calling (303) 831-6704, or from Pioneer, by directing a request by mail
to Pioneer Bancshares, Inc., 623 W. 38th Street, Austin, Texas 78705, Attention: Larry Lehman, or by calling (512) 829-1903. The definitive proxy statement/prospectus will also
be mailed to shareholders of Pioneer.

Participants in the Solicitation

FirstSun, Pioneer and certain of their respective directors and executive officers may be deemed to be participants in the solicitation of proxies from the shareholders of
Pioneer in connection with the proposed transaction under the rules of the SEC. Certain information regarding the interests of these participants and a description of their
direct and indirect interests, by security holdings or otherwise, will be included in the proxy statement/prospectus regarding the proposed merger transaction when it
becomes available, which can be obtained free of charge from the sources described above.

              PIONEER
                                   STRATEGIC MERGER COMBINATION                                                                                                                        3
              BANCSHARES, INC.
Deal Summary for Pioneer Bancshares, Inc. Shareholders

     PIONEER
                        STRATEGIC MERGER COMBINATION     4
     BANCSHARES, INC.
Strategic Merger Overview

                                                                         Together
▪   $5.3 billion in assets at March 31, 2021            •   $7.2 billion in assets                                           ▪   $1.8 billion in assets at March 31, 2021

▪   Branch footprint presence in key growth markets     •   Premier commercial bank serving all of the                       ▪   Serving high growth key metro markets (Austin,
    (CO, TX, and AZ) and key non-metro markets              key Southwest and Texas markets                                      Houston, San Antonio, and Dallas) and
    focused on core deposit generation (KS and                                                                                   the surrounding suburban & rural markets
    NM)                                                 •   Attractive combined operating returns
                                                                                                                             ▪   Largest bank headquartered in Austin, TX
▪   Successful integration of merger with Strategic     •   Significant opportunity to scale the pro
    Growth Bank Incorporated and its affiliated             forma Texas franchise:                                           ▪   Foothold in key non-metro markets with attractive
    entities (“SGB”) in 2017 which doubled its asset                                                                             core deposits
                                                            ― Reduce wholesale funding and replace with
    size                                                      commercial core deposits
                                                                                                                             ▪   Branch and human resource infrastructure fully
▪   Organic growth strategy with significant business       ― Scale up metro Texas branches closer to                            built out
    development hires from recent mergers by                  overall market averages
    other banks, particularly in AZ and TX                  ― Continue to recruit and attract talent from                    ▪   Successful effort in CARES Act PPP program with
                                                              Texas banks playing "defense"                                      $186 million in loan originations as of March 31,
▪   Multiple profitable fee income businesses                                                                                    2021
    (mortgage, wealth/private banking and                   ― Leverage FirstSun fee income capabilities into
    treasury management) creates revenue                      the Pioneer customer base and markets
    diversification                                         ― Larger combined capital base allows larger
                                                              loan hold sizes
                                                            ― Continue expanding commercial lending
    Pro Forma Loans by State(1)                               specialized verticals                                                      Pro Forma Deposits by State(2)
                                                        FirstSun (54)
                                                        Pioneer (19)

                   AZ
            NM     8%
                                                                                                                                                        NM
            7%                                                                                                                                                            TX
                                                                                                                                                        21%
                                                                                                                                                                         30%
                              TX
          CO                 40%
          21%
                                                                                                                                                     CO
                                                                                                                                                     23%
                                                                                                                                                                         KS
                     KS                                                                                                                                                 25%
                    24%

                                                                              Source: S&P Global Market Intelligence. Note: Branch data modified for recent closures.
                PIONEER
                                    STRATEGIC MERGER COMBINATION              (1) FirstSun data as of 3/31/2021; Pioneer data as of 3/29/2021                                        5
                BANCSHARES, INC.
                                                                              (2) FDIC deposit data as of 6/30/2020.
Business Model & Operating Philosophy
How does this transaction fit with the FirstSun business plan & strategy?

                                      Business                         Merger
                                      Plan Focus                    Combination Fit

 1
          Southwestern and Mountain markets focus                              ✓      Further expands the franchise into key Texas markets
                 across five state footprint                                   ✓      Strong balance of metro (Austin, Houston) and non-metro markets
     ▪ Heavy in-migration from coastal and northern states                     ✓      Pioneer markets seeing strong population in-flows and overall
       adding to population growth                                                    economic growth
     ▪ Strong absolute and relative regional GDP growth                        ✓      The Houston-Austin-San Antonio markets are well-known to FirstSun
                                                                                      and the merger is expected to be highly additive and
                                                                                      complementary to existing efforts

 2
         Key focus on small to mid-sized businesses
         and business owners in high growth markets                            ✓      FirstSun plans to retain significant business development personnel
     ▪ Experienced banker teams in each region with focused                           from Pioneer
       growth strategy with a focus on relationships (not                      ✓      Focus on expanding wallet share with Pioneer’s existing customer
       transactions)                                                                  base including additional lending products, wealth/private banking
     ▪ Strong local credit oversight                                                  and Treasury Management

 3
               Risk/Reward focus of business lines
                                                                               ✓      FirstSun C&I capabilities will allow growth of specialty lines in the
     ▪ Limited Investor CRE, with plans to reduce “transactional
                                                                                      Pioneer markets and directly to the Pioneer existing customer base
       CRE”
     ▪ Focus on top down credit concentration & risk monitoring                ✓      Pioneer has expertise in SBA that will be additive to FirstSun’s existing
     ▪ Specialty lines in Public Finance, SBA, Healthcare and ABL                     capabilities

 4
          Expect to build sustainable revenue growth                           ✓      FirstSun anticipates growth of the Pioneer legacy markets in line with
                        for the long term                                             FirstSun’s existing Texas and metro markets
     ▪ Focused on core double digit loan, deposit, fee income                  ✓      Further diversifies revenue toward spread lending sources and non-
       growth                                                                         mortgage banking revenue
                                                                               ✓      Substantial opportunity to deploy Treasury Management platform to
                                                                                      Pioneer commercial customers and drive additional fee income

              PIONEER
                                 STRATEGIC MERGER COMBINATION                                                                                                 6
              BANCSHARES, INC.
Transaction Summary
Structure                      ▪ Pioneer Bancshares, Inc. will merge with and into FirstSun Capital Bancorp

                               ▪ 100% stock consideration

                               ▪ Each share of Pioneer Bancshares, Inc. common stock will be converted into 1.0443 shares of FirstSun
                                 Capital Bancorp stock

                               ▪ Pioneer Bank will merge with and into Sunflower Bank, a wholly-owned subsidiary of FirstSun Capital
                                 Bancorp

                               ▪ Pioneer Bancshares, Inc. shareholders will own approximately 26% of the combined entity post-closing

                               ▪ No financing contingency or capital needed to complete the transaction

Executive                      ▪ Neal Arnold, current Sunflower Bank President & CEO, will remain in his role and lead the combined bank
Management &
Employees                      ▪ Ronald Coben, current President & CEO of Pioneer Bank, will be retained for a 3 to 6 month time period
                                 post closing to assist with the integration efforts

                               ▪ FirstSun Capital Bancorp expects to retain a significant number of sales and business development
                                 positions and select employees from the credit and operations functions

                               ▪ FirstSun Capital Bancorp will establish a retention pool to retain employees critical to the integration and
                                 will provide severance to employees not continuing with the combined entity

Board of Directors             ▪ 2 directors will be invited to join the Board of Directors of FirstSun Capital Bancorp, including one
                                 nominated by JLL / FHC Holdings I, LLC (“JLL”) (a private equity firm and Pioneer’s largest shareholder)

                               ▪ 3 directors of Pioneer Bank will be invited to join the Board of Directors of Sunflower Bank

Timing and Approvals           ▪ Anticipated closing early fourth quarter 2021

                               ▪ Merger subject to customary regulatory approvals and approval by Pioneer Bancshares, Inc.
                                 shareholders

            PIONEER
                               STRATEGIC MERGER COMBINATION                                                                                     7
            BANCSHARES, INC.
Overview of Merger Economics
 Purchase Price                              ▪ All stock transaction
 &Valuation                                  ▪ Approximate $226 million aggregate implied deal value
                                             ▪ Purchase price multiple of(1):
                                                         – 1.33x tangible book value (at 3/31/21)
                                                         – 1.38x tangible book value adjusted for NOLs(2)
                                                         – 6.9% core deposit premium(3)
                                             ▪ Accretive to Pioneer’s earnings per share and book value per share
                                                         – 13% accretive to Pioneer’s book value(4)
                                                         – 39% accretive to Pioneer’s diluted earnings per share(5)

 Combined Company                            ▪   $7.2 billion in pro forma assets
 Financials                                  ▪   $4.7 billion in pro forma net loans
 (as of 3/31/21 on a                         ▪   $5.8 billion in pro forma deposits
 combined basis)
                                             ▪   $18.3 million in GAAP Net Income (excluding potential synergies)
                                             ▪   Resulting capital ratios well above regulatory minimums

 Key Financial                               ▪ Stand alone financials based on Management forecasts for each entity
 Model Assumptions                           ▪ Purchase accounting to be performed on the Pioneer balance sheet in accordance with GAAP
                                             ▪ Expected synergies equal to ~$17 million, or 7% of the combined expenses base
                                                         – Cost synergies will be derived from both entities

(1) All metrics and data per Pioneer’s fairness opinion, which will be disclosed in the publically filed S-4 registration statement and Pioneer shareholder proxy materials.
(2) Reflects the adjustment to Pioneer’s tangible book value per share for the $6.7 million net operating loss/deferred tax asset related write-down, based on estimates provided by senior management of Pioneer
and FirstSun.
(3) Core deposits defined as total deposits less time deposits with balances greater than $100,000.
(4) Based on equivalent pro forma book value per share for Pioneer of $30.28 relative to historical book value of $26.75; data as of March 31, 2021.
(5) Based on equivalent pro forma diluted earnings per share for Pioneer of $0.75 relative to historical diluted earnings per share of $0.54; data for the three months ended March 31, 2021.

                 PIONEER
                                         STRATEGIC MERGER COMBINATION                                                                                                                                               8
                 BANCSHARES, INC.
Introduction to FirstSun and the Combined Organization

     PIONEER
                        STRATEGIC MERGER COMBINATION     9
     BANCSHARES, INC.
Introduction to FirstSun Capital Bancorp

              1
                         Specialized commercial bank
                                 - Focus on attractive lending verticals including public finance, healthcare banking, SBA, small
                                 business banking, ABL and structured finance

                        2       Focused in key Southwest region growth markets
                                         - Denver, Dallas, Houston, Phoenix-Scottsdale, Kansas City

                            3       Effective organic growth strategy driven by talent acquisition strategy
                                             - Opportunities expected to continue due to recent bank sector consolidations

                                    High quality, low-beta, low-cost core deposit franchise
                            4              - Balanced distribution across stable, non-metro markets (Kansas, New Mexico, Colorado)
                                             - Provides an advantage in funding for our lending opportunities

                                Multiple profitable fee income businesses
                        5                - Mortgage banking, treasury management and wealth/private banking
                                         - Creates significant revenue diversification and revenue mix

              6          Experienced acquirer – multiple successful integrations
                                 - Executive management has completed over 30 M&A transactions and integrations

     PIONEER
                        STRATEGIC MERGER COMBINATION                                                                                 10
     BANCSHARES, INC.
Overview of FirstSun Capital Bancorp
                                FirstSun Branch Footprint                                                                               Financial Highlights
                                                                                                                                                                 For the Quarter
   Branches (73)                                                4                7
                                                                                                                                       For the Year Ending            Ending       2019-2020
   Bankers (123)                                           Western KS        Central KS                   $ in millions            12/31/2019      12/31/2020       3/31/2021      Change
                                   16
                                                                                                          Balance Sheet:
                               Colorado
                                                                                                          Total Assets                $4,185          $4,995           $5,321           19 %
                                                                                        12
                                                                                                          Total Net Loans              3,060           3,799            3,630           24
                                                                                  Eastern KS              Total Deposits               3,490           4,154            4,478           19

                   19                                                                                     Tang. Common Equity            387            443              455            14

                                                                                 47                       PPP Loans                        0            251              252
                Arizona
                                                 11
                                                                               Dallas                     Loans / Deposits              91.2 %          97.3 %           85.5 %
                                          New Mexico
                                                                                                          TCE / TA                       9.3             8.9              8.6
                                                                                                          TCE / TA (ex. PPP)             9.3             9.4              9.1

                                   7
                                                                                                          NPAs / Assets                 0.50 %          0.79 %           0.78 %
                          El Paso / Las Cruces                                                            NCOs / Loans                  0.13            0.11             0.02
                                                                                                          ALLL / Loans (ex. PPP)        0.92            1.26             1.32
                                                               Pioneer Branch Additions
                                                                                                          Profitability:
                                                                                                          Total Revenue               $198.2          $284.4            $72.3           43 %
                                   Operating Philosophy
                                                                                                          Operating Expenses           170.2           204.1             55.2           20
                                                                                                          Pre-Provision Net Rev.        26.4            80.1             17.1          203
 ▪     Grow share in Southwestern and Mountain markets across a
                                                                                                          Provision Expense              6.1            23.1             (0.4)
       five state footprint
                                                                                                          Net Income                    20.5            47.6             14.3

 ▪     Key focus on small to mid-size businesses and entrepreneurs
                                                                                                          Net Interest Margin           3.45 %          3.10 %           3.21 %
       in high growth markets; plus select lending expertise
                                                                                                          Fees / Revenue                35.3            52.2             46.9
 ▪     Attention to risk / reward profile of business lines, specifically                                 Op. Exp. / Avg. Assets        4.28            4.39             4.36
       related to portfolio composition & underwriting principals                                         Efficiency Ratio              85.9            71.8             76.3
                                                                                                          Provision / Loans             0.20            0.63            (0.04)
 ▪     Build sustainable revenue growth for the long-term with                                            ROAA                          0.52            1.02             1.13
       loan, deposit, and fee income growth

Source: S&P Global Market Intelligence. Note: Data represents holding company-level regulatory data unless stated otherwise.

                 PIONEER
                                            STRATEGIC MERGER COMBINATION                                                                                                                       11
                 BANCSHARES, INC.
Strong FirstSun Organic Growth Underpinning Recent Operating Trends
 Total Loans ex. PPP ($mm)                                                               Total Deposits ($mm)

 Closed SGB
 merger in 2017                                                                                                         ’17-Q1’21                          $4,478
                                      ’17-Q1’21
                                      CAGR: 9%                                                                         CAGR: 13%       $4,154
                                                          $3,789
                                                                           $3,578
                                          $3,182                                                                           $3,490
                                                               $3,014
                     $2,859                                                     $2,889
  $2,696                                                                                   $2,991         $3,022
                                              $2,496
                            $2,086
        $1,896

      2017                2018               2019             2020           2021Q1
             Total Loans (ex. PPP)            Loans ex. PPP, HFS & NOO CRE
                                                                                           2017            2018            2019            2020         2021Q1

 Net Interest Income Growth ($mm)                                                        Revenue and Expense Growth ($mm)

                                          ’18-Q1’21
                                          CAGR: 9%                                                     70%
                                                                         $154                        increase                                  54%
                                                       $136                                                     $289                         increase
             $128                 $127
                                                                                                                                                    $221

                                                                                              $170
                                                                                                                                    $143

             2018                 2019                 2020        Q1 '21 Annualized          2018           Q1 '21                 2018            Q1 '21
                                                                                                           Annualized                             Annualized
                                     Net Interest Income
                                                                                                      Revenue                       Non-Interest Expense

Source: S&P Global Market Intelligence.

                 PIONEER
                                          STRATEGIC MERGER COMBINATION                                                                                              12
                 BANCSHARES, INC.
FirstSun Organic Growth Strategy in New Markets
  Investments Made into the Franchise Post-SGB Merger                                         Resulting in Strong Organic Growth in Key Metro Markets

 Full Time Employees
                                                 Annualized Salary and Benefits                         Dec 2017                        Mar 2021
                                                 Expense ($mm)

1,100                          1,048            $180.0                                                  $385mm                          $1.9bn
                                                                                 $154.5                   loans                           loans
1,000                                                                                                    in Key              63% CAGR    in Key
                                                                                                         Metro                           Metro
   900                                          $120.0
                 846                                                                                    Markets                         Markets
   800
                                                                 $68.3
   700                                            $60.0
                                                                                              Eastern Kansas
   600                                                                                         $600                                       $524
                                                                                                                   $371
                                                                                               $400
   500                                             $0.0
              2017Q4           2021Q1                            2017Q4         2021Q1         $200
                                                                                                 $0
                                                                                                               Dec 2017                 Mar 2021
                                                                                              Metro Texas(2)
      Intentional Strategy to De-Emphasize Investor CRE
                                                                                               $600                                       $420
 Investor CRE / TRBC (%)                         C&I    Loans(1)    ($B)                       $400
                                                                                               $200
                                                                                                                    $0
                                                                                                 $0
 300%                                                                                                          Dec 2017                 Mar 2021
          256%                                   $1.2                           $1.1   $1.1   Arizona
 250%
                 213%                            $1.0                                                                                    $254
                                                                                              $300
 200%                   179%                                             $0.8
                                                 $0.8                                         $200
                               146% 136%                          $0.6
 150%                                            $0.6     $0.5                                $100
                                                                                                                    $0
 100%                                                                                           $0
                                                 $0.4
                                                                                                               Dec 2017                 Mar 2021
  50%                                            $0.2
                                                                                              Specialty Banking
    0%                                           $0.0                                         $1,000                                      $692

                                                                                               $500
Source: S&P Global Market Intelligence.                                                                             $15
(1) “Commercial and Industrial loans” as defined by form Y-9C. Excludes PPP loans.               $0
(2) Consists of business development in Houston, Dallas, Austin and San Antonio.                                  Dec 2017              Mar 2021

                 PIONEER
                                         STRATEGIC MERGER COMBINATION                                                                                   13
                 BANCSHARES, INC.
Experienced and Successful Acquiror

▪    Office of the Chairman is led by Mollie Hale Carter                          Success in Growing Acquired Businesses

▪    Executive team is led by Neal Arnold and Rob Cafera                  Gain on Sale of Mortgage Loans Revenue ($mm)
     who, prior to joining FirstSun, were top executives at
                                                                         $150.0
     Fifth Third Bank and executed on over 30 M&A
     transactions and integrations                                       $125.0                                          $115.2

                                                                         $100.0
▪    High quality and professional Board of Directors
                                                                          $75.0

▪    Team has successfully executed and integrated the                    $50.0
                                                                                                        $44.7
     Strategic Growth merger-of-equal sized transaction:
                                                                          $25.0
                                                                                         $8.1
        –     Added $2 billion in on-balance sheet assets
                                                                           $0.0
                                                                                     2018Y              2019Y            2020Y
        –     Involved several technology conversions and was
              complex given SGB’s structure as a multi-bank
              holding company with two bank subsidiaries and
                                                                          Fiduciary Fee Income ($mm)
              multiple non-bank subsidiaries.

        –     New geographies acquired (New Mexico, El Paso-TX)            $8.0                                               $7.4

▪    In 2020, FirstSun completed the acquisition of the trust
     and wealth assets from CIT Group which it had                         $6.0
                                                                                                                 $5.1
     recently acquired from Mutual of Omaha
                                                                                                $3.9    $3.8
        –     $800 million in acquired assets under management             $4.0
              and assets under administration                                     $3.2

        –     Fully integrated within 4 months of the closing
                                                                           $2.0
                                                                                                                                     (1)
                                                                                  2017Y         2018Y   2019Y   2020Y       2021Q1

Source: S&P Global Market Intelligence.
(1) Annualized data.

                 PIONEER
                                          STRATEGIC MERGER COMBINATION                                                                     14
                 BANCSHARES, INC.
Combined Company Highlights

     PIONEER
                        STRATEGIC MERGER COMBINATION   15
     BANCSHARES, INC.
Well-Positioned Combined Entity
 Southwest and Texas Banks Below $10 Billion in
 Assets(1)
                                                                                             ▪ FirstSun has historically clean, strong assets funded by a stable deposit
                                                                           Total               market footprint with attractive low-cost, core funding
                                                                           Assets
  Rank Company                                                 Ticker       ($B)                      − Long history of strong credit quality and disciplined credit
                                                                                                        concentrations
    1     Capitol Federal Financial, Inc.                      CFFN              $9.7
                                                                                                      − Minimal exposure to Energy lending or troublesome asset classes
    2     Veritex Holdings, Inc.                                VBTX             $9.2
                                                                                                      − The combined company will have:
    3     Origin Bancorp, Inc.                                 OBNK              $7.6
                                                                                                             ▪ Over 20% of the loan portfolio in C&I loans and CRE
    4     FirstSun + Pioneer                                      -              $7.2   *                      concentration under 200% (of regulatory capital)

    5     First Foundation Inc.                                FFWM              $7.1                        ▪ 25%+ noninterest bearing deposit levels

    6     Southside Bancshares, Inc.                            SBSI             $7.0

    7     National Bank Holdings Corporation                   NBHC              $6.9
                                                                                             ▪ Together we envision a financially stronger and more diverse bank
    8     Allegiance Bancshares, Inc.                           ABTX             $6.4          operating in some of the country's best growth markets

    9     Triumph Bancorp, Inc.                                  TBK             $6.1                 − Over $7 billion in total assets combined

    10    CrossFirst Bankshares, Inc.                           CFB              $6.0                 − $600+ million in tangible equity capital (>10% CET1 ratio) *

    11    Alpine Banks of Colorado                             ALPI.B            $5.6                 − Stable NIM (combined NIM of 3.10%) *

    12    Great Southern Bancorp, Inc.                         GSBC              $5.6                 − ~35% fee income as a percentage of total combined revenue *

    13    Business First Bancshares, Inc.                       BFST             $4.4

    14    Equity Bancshares, Inc.                              EQBK              $4.2

    15    CBTX, Inc.                                            CBTX             $4.0

Source: S&P Global Market Intelligence. Note: Data as of or for the quarter ending March 31, 2021.
(1) Includes publicly-traded banks and thrifts headquartered in Colorado, Kansas, Louisiana, Missouri, New Mexico, Oklahoma, Texas and Utah, excluding merger targets and mutual entities.
* Data represents combined financials as of or for the quarter ending March 31, 2021; not adjusted for purchase accounting impacts.

                 PIONEER
                                         STRATEGIC MERGER COMBINATION                                                                                                                        16
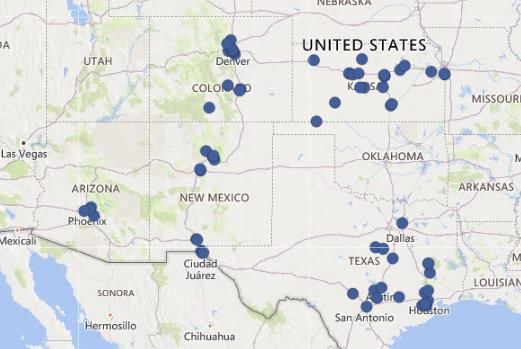
                 BANCSHARES, INC.
Situated in Top-Tier Growth Markets (5 of the Top 10 in the U.S.)

  2010 – 2021 Population Growth %                                                                   Enhancing Our Presence in High Growth Markets

                                          Denver, CO                         19%                        Denver, CO                  Boulder, CO
                                          Boulder, CO                 12%

                                           Phoenix, AZ                         21%

                                             Austin, TX                                       34%
  PIONEER
  BANCSHARES, INC.                         Houston, TX                          22%                     Phoenix, AZ                  Austin, TX
                                      San Antonio, TX                          22%

   Overlapping Market                        Dallas, TX                       20%

                                          U.S. Average           7%
                                                                                                        Houston, TX                San Antonio, TX

 2021 Median Household Income ($000s)

 $100
                       $91
  $90       $87                               $86
                                                                                                                      Dallas, TX
  $80                                                                        $76
                                   $71
                                                          $69                           $68
  $70
                                                                  $62
  $60

  $50
         Denver,     Boulder, Phoenix,       Austin,   Houston,   San       Dallas,     U.S.
          CO           CO       AZ             TX        TX     Antonio,     TX       Average
                                                                   TX

Source: S&P Global Market Intelligence.

                  PIONEER
                                          STRATEGIC MERGER COMBINATION                                                                               17
                  BANCSHARES, INC.
Loan & Funding Composition
 Q1 2021 Loan Composition (Excl. PPP)                                                                                             C&I Loans / Total Loans (%)

          Standalone                                                      +                                                                25%
                                                                                                                                                                                    ▪ Well-diversified
                                                                                                                                                                                      portfolio with
             Construction & Land                                               Construction & Land                                                                                    strong C&I
                                  Nonowner-
                     4%          Occupied CRE                    Consumer &
                                                                                       7%             Nonowner-                                                21%                    lending
  Consumer &                         15%                                                             Occupied CRE
                                                                   Other
    Other                                                                                                18%
                                                                    18%
     22%                                 Multifamily                                                                                                                                ▪ Well-managed
                                               1%
                                                                                                            Multifamily                                                               CRE portfolio
                                                                                                               1%
                                            Residential
                                            Mortgage
                                               15%                                                        Residential                                                               ▪ Healthy loan
                                                                                                          Mortgage                                                                    yield in low rate
                                                                                                             16%
                                             Home                                                                                                                                     environment
                                             Equity
                                              0%                                                         Home
                                                                    C&I                                  Equity
                                     Owner-                         25%
           C&I                                                                                            1%
                                    Occupied                                           Owner-Occupied
           30%                        CRE                                                                                                                                (1)
                                                                                            CRE                                         Pro Forma         Peer Median
                                      13%                                                   14%
                                                                                                                                        Company
       2021Q1 Yield on Loans: 4.11%                                       2021Q1 Yield on Loans: 4.20%
                                                                                                                                          Non-interest
 Q1 2021 Deposit Composition                                                                                                           Bearing Deposits (%)
                                                                                                                                                                                    ▪ Strong non-
          Standalone                                                      +                                                                                                           interest bearing
           Time Deposits
                                 Noninterest-bearing                   Time Deposits            Noninterest-bearing                                            28%                    deposit base, in
                8%                                                                                                                         27%
                                      Deposits                             15%                       Deposits                                                                         line with
                                        28%                                                            27%
                                                                                                                                                                                      regional peers

                                                                                                                                                                                    ▪ Opportunities to
                                                                                                                                                                                      grow
                                                                                                                                                                                      commercial
                                                                                                                                                                                      core deposits
                                                                                                                                                                                      following
  IB Demand,                                                    IB Demand,                                                                                                            integration of
Savings & MMDA                                                Savings & MMDA
      64%                                                           58%                                                                                                               Pioneer Bank
                                                                                                                                                                         (1)
                                                                                                                                        Pro Forma         Peer Median
       2021Q1 Cost of Deposits: 0.22%                                     2021Q1 Cost of Deposits: 0.30%                                Company

Source: S&P Global Market Intelligence.
Note: Data represents bank level regulatory data as of March 31, 2021 unless otherwise stated. C&I loans exclude PPP Loans.
(1) Includes U.S. Banks headquartered in the Midwest and Southwest with total assets between $5 billion and $15 billion with Core ROA < 1.50% for the quarter ending March 31, 2021; excludes merger targets. Data
represents holding company regulatory data where available; if unavailable, data represents bank level regulatory data.

                 PIONEER
                                         STRATEGIC MERGER COMBINATION                                                                                                                                          18
                 BANCSHARES, INC.
Revenue & Profitability Diversification
    2020 Full Year Data at the Bank Level

                     Sunflower Bank                                                        Pioneer Bank                                                      Pro Forma

                    10%                                                                9%                                                              10%

              2%                                                                 3%                                                              1%

                                                                                                                                                                                      54%
                                                    48%

                                                                                                                                              35%
                                                                                                                     88%
             40%

                     Net Interest Income                                               Net Interest Income                                             Net Interest Income
                     Mortgage GOS Fee Income                                           Mortgage GOS Fee Income                                         Mortgage GOS Fee Income
                     Wealth Mngmt & Trust Income                                       Wealth Mngmt & Trust Income                                     Wealth Mngmt & Trust Income
                     Other fee income sources                                          Other fee income sources                                        Other fee income sources

                                                           % of                                                            % of                                                              % of
  Revenue ($000)                          Balance          Total     Revenue ($000)                        Balance         Total      Revenue ($000)                       Balance           Total
  Net Interest Income                 $       139,530        48.5%   Net Interest Income               $        43,116        88.5%   Net Interest Income              $        182,646        54.3%
  Mortgage GOS Fee Income                     115,242        40.0%   Mortgage GOS Fee Income                     1,251         2.6%   Mortgage GOS Fee Income                   116,493        34.6%
  Wealth Mngmt & Trust Income                      5,130      1.8%   Wealth Mngmt & Trust Income                       -       0.0%   Wealth Mngmt & Trust Income                    5,130      1.5%
  Other fee income sources                     27,880         9.7%   Other fee income sources                    4,351         8.9%   Other fee income sources                   32,231         9.6%
  Total                               $       287,782       100.0%   Total                             $        48,718       100.0%   Total                            $        336,500       100.0%

               Fee Income/Revenue: 51.5%                                              Fee Income/Revenue: 11.5%                                      Fee Income/Revenue: 45.7%

             Mortgage GOS/Revenue: 40.0%                                          Mortgage GOS/Revenue: 2.6%                                        Mortgage GOS/Revenue: 34.6%

Source: S&P Global Market Intelligence.
Note: Data for the year ending 12/31/2020.

                 PIONEER
                                          STRATEGIC MERGER COMBINATION                                                                                                                               19
                 BANCSHARES, INC.
Creating a High Growth, High Performing Franchise

            Outpacing regional peers
                                                                                                                                                                                         +
            In line with regional peers
                                                                                             Select High Performing                      Broader Midwest &
                                                                                                Regional Peers(1)                       Southwest Median(2)                        Pro Forma Co.

                                   # of Branches                                                             52                                     56                                      73

                                   Total Assets ($B)                                                       $8.1                                    $6.8                                    ~$7

     Size & Balance                TCE                                                                     9.3%                                   8.8%                                  8% - 9%
          Sheet
      Composition                  Loans ex. PPP / Deposits                                                77%                                     77%                                    79%

                                   Noninterest Bearing Deposits / Deposits                                  33%                                    28%                                    27%
                                                                                                                                                                                                   (3)
                                   Regulatory CRE / TRBC                                                   329%                                   276%                                   ~190%

                                   NIM                                                                    3.22%                                  3.20%                                   3.10%

                                   LTM Fee Income / Rev enue                                                16%                                    23%                                    47%
     Revenue Mix &
     Growth Profile                Rev enue Growth (LTM Q1'18 - LTM Q1'21)                                  16%                                    15%                                    21%

                                   Loan Growth ex. PPP (Q1'18 - Q1'21)                                      10%                                     9%                                     9%

                                   Price / TBV (Current)                                                   1.86x                                  1.49x
         Valuation
                                   Price / 2021 EPS                                                        13.5x                                  11.4x

Source: S&P Global Market Intelligence and FactSet.
Note: Estimated revenue figures per FactSet consensus as of 6/28/21.
(1) Includes IBTX, SBSI, VBTX, CBTX, NBHC and EFSC.
(2) Includes U.S. Banks headquartered in the Midwest and Southwest with total assets between $5 billion and $15 billion with Core ROA < 1.50% for the quarter ending March 31, 2021; Excludes merger targets.
(3) Total risk based capital does not include purchase accounting adjustments

                 PIONEER
                                         STRATEGIC MERGER COMBINATION                                                                                                                                           20
                 BANCSHARES, INC.
Appendix

    PIONEER
                       STRATEGIC MERGER COMBINATION   21
    BANCSHARES, INC.
About FirstSun Management

                             •    Current Chairman of the FirstSun board of directors and Sunflower Bank, positions she has held since 1996
Mollie H. Carter             •    Serves as President and Chief Executive Officer of FirstSun, a position she has held since 2005, and she served as President and Chief
Chairman & Chief                  Executive Officer of Sunflower Bank from 2005 to 2018
                             •    Served as a director of Evergy, Inc. and its predecessor, Westar Energy, a publicly-traded company, since 2003
Executive Officer            •    Previously served as a director of Archer-Daniels-Midland Company, a publicly-traded company, from 1996 to 2017
                             •    Director of Lockton Companies and serves on its audit committee

                             •    Current Chief Operating Officer of FirstSun, a position he has held since 2018. He has also served as the President and Chief Executive
Neal E. Arnold                    Officer of Sunflower Bank since 2018
Chief Operating              •    Served as Executive Vice President of Fifth Third Bancorp and Fifth Third Bank from 1998 to 2005, and as Chief Financial Officer of Fifth Third
                                  Bancorp and Fifth Third Bank from 1997 to 2005. Before that, he served as Treasurer of Fifth Third Bancorp and Fifth Third Bank, and as Senior
Officer                           Vice President of Fifth Third Bank
                             •    Served as Chief Financial Officer and Chief Operating Officer of Midwestern Community Bank from 1980 to 1989

Robert A. Cafera             •    Current Executive Vice President and Chief Financial Officer of FirstSun and Sunflower Bank, positions he has held since 2012
Chief Financial              •    20+ years of experience in the financial services industry
                             •    Held positions at Fifth Third Bank including Senior Vice President and CFO of the Commercial Bank, along with Assistant Corporate Controller
Officer                      •    Prior to Fifth Third, Mr. Cafera was a Senior manager at Arthur Andersen, where he served for nearly 10 years

Jennifer L. Norris           •    Joined Sunflower Bank, NA in January 2020
                             •    25+ years of banking experience, most recently with Wells Fargo, including management and credit approval of diverse portfolios including
Chief Credit                      commercial, corporate, energy, and workout loans
Officer                      •    Ms. Norris holds the Chartered Financial Analyst (CFA) designation and is active within the CFA Institute
                             •    Undergraduate degree from Lipscomb University and MBA from Florida State University

Laura J. Frazier             •    Joined Sunflower Bank, NA in 2013 and is responsible for all aspects of Human Resources management
                             •    20+ years of Human Resources experience from the manufacturing and government industries
Chief Administrative         •    From 2002 to 2013, Ms. Frazier held various positions at the Department of Developmental Disabilities for the State of Ohio, including Deputy
Officer                           Director of Human Resources
                             •    B.A and M.B.A from Mount Vernon Nazarene University

Chris Bourne                 •    Will join the FirstSun team in 2021 through the merger with Pioneer Bancshares, Inc.
                             •    Leads team of commercial lenders in Central Texas
Regional President,          •    During his 20-year plus banking career in Austin, Chris has held numerous key leadership positions including Chief Lending Officer at Anthem
Central Texas                     Bank, Market President at Colonial Bank, First Vice President at IBC Bank and Senior Vice President at Citibank.
                             •    He joined Pioneer Bank from American Bank where he served as Senior Commercial Lending Manager in 2011

Seth Allen                   •    Joined in 2019 and currently serves as the Regional President of Metro Texas for our Commercial Banking line of business
                             •    Mr. Allen has spent his career working at various banks such as Veritex Community Bank, Capital One, and National City Bank
Regional President           •    Over that time, he has demonstrated a track record of successfully developing ‘de-novo’ commercial banking operations in new markets
of Metro Texas               •    Mr. Allen has stayed active in the community by his involvement in Church activities, serving on various boards such as Junior Achievement
                                  of Dallas and is a graduate of Leadership Dallas

          PIONEER
                                 STRATEGIC MERGER COMBINATION                                                                                                                       22
          BANCSHARES, INC.
About FirstSun Board
Mollie H. Carter              •    Current Chairman of the FirstSun board of directors and Sunflower Bank, positions she has held since 1996
                              •    Serves as President and Chief Executive Officer of FirstSun, a position she has held since 2005, and she served as President and Chief
Chairman & Chief                   Executive Officer of Sunflower Bank from 2005 to 2018
Executive Officer             •    Served as a director of Evergy, Inc. and its predecessor, Westar Energy, a publicly-traded company, since 2003
                              •    Previously served as a director of Archer-Daniels-Midland Company, a publicly-traded company, from 1996 to 2017
                              •    Director of Lockton Companies and serves on its audit committee

Neal E. Arnold                •    Current Chief Operating Officer of FirstSun, a position he has held since 2018. He has also served as the President and Chief Executive
                                   Officer of Sunflower Bank since 2018
Director & Chief              •    Served as Executive Vice President of Fifth Third Bancorp and Fifth Third Bank from 1998 to 2005, and as Chief Financial Officer of Fifth Third
Operating Officer                  Bancorp and Fifth Third Bank from 1997 to 2005. Before that, he served as Treasurer of Fifth Third Bancorp and Fifth Third Bank, and as Senior
                                   Vice President of Fifth Third Bank
                              •    Served as Chief Financial Officer and Chief Operating Officer of Midwestern Community Bank from 1980 to 1989

Christopher C.                •    Managing Director of Lightyear Capital LLC, a position he has held since 2008
                              •    Spent over 20 years at Goldman, Sachs & Co., where he was elected partner in 2000. His career at Goldman, Sachs & Co. included a
Casciato                           number of senior management positions in the firm’s investment banking division, including partner in the Financial Institutions Group, as
Director                           well as partner and Chief Operating Officer of Goldman Sachs’ worldwide investment banking business

Paul A. Larkins               •    Senior Advisor with Aquiline Capital Partners, a position he has held since 2018
                              •    Board chair of LERETA, LLC, a Tarsadia Investments company, and board member of Amur Equipment Finance, Inc.
Director                      •    Former President and director of SquareTwo Financial Corporation, positions he from 2009 to 2016, and former Chief Executive Officer of
                                   SquareTwo Financial Corporation, a position he held from 2010 to 2016
                              •    Served as the Chief Executive Officer and President of Key National Finance in Superior, Colorado from 1998 to 2009. Before that, he served
                                   as a Senior Executive Vice with Key Bank USA and KeyCorp Leasing Ltd.

David W. Levy                 •    Managing Director at Pickwick Capital Partners, a position he has held since 2012
                              •    Served as Vice Chairman of Investment Banking and Co-Head of the Financial Institutions Group at Cowen & Company from 2009 to 2010,
Director
                                   and served as Senior Managing Director at Bear Stearns from 2005 to 2008
                              •    Spent over 23 years at Citigroup Global Markets as a Managing Director and Head of the Bank and Financial Services Group, and Salomon
                                   Brothers Inc. as a Managing Director and Co-Head of the Financial Institutions Department
                              •    Presently serves on the Board of Directors of Old Dominion National Bank

Diane L. Merdian              •    Former Chief Financial Officer of Redwood Trust, Inc., a mortgage REIT, a position she held from 2010 to 2012
                              •    Served on the board of directors of Redwood Trust, Inc. from 2008 through 2009
Director                      •    Served as a Senior Vice President and Analyst in charge of Bank Strategy at Keefe, Bruyette & Woods, Inc starting in 2003 and additionally
                                   served as its Head of Large-cap Banks and Managing Director beginning in 2005 to 2008
                              •    Between 1984 and 2002, Ms. Merdian held equity analyst positions at Salomon Brothers, Wellington Management, Montgomery Securities
                                   and Morgan Stanley

           PIONEER
                                  STRATEGIC MERGER COMBINATION                                                                                                                       23
           BANCSHARES, INC.
You can also read