2021 Kitchen & Bath Market Outlook-January 2021- Virtual Conference ...

Page created by Philip Reyes
 
CONTINUE READING
2021 Kitchen & Bath Market Outlook-January 2021- Virtual Conference ...
2021 Kitchen & Bath
  Market Outlook
    —January 2021—
2021 Kitchen & Bath Market Outlook-January 2021- Virtual Conference ...
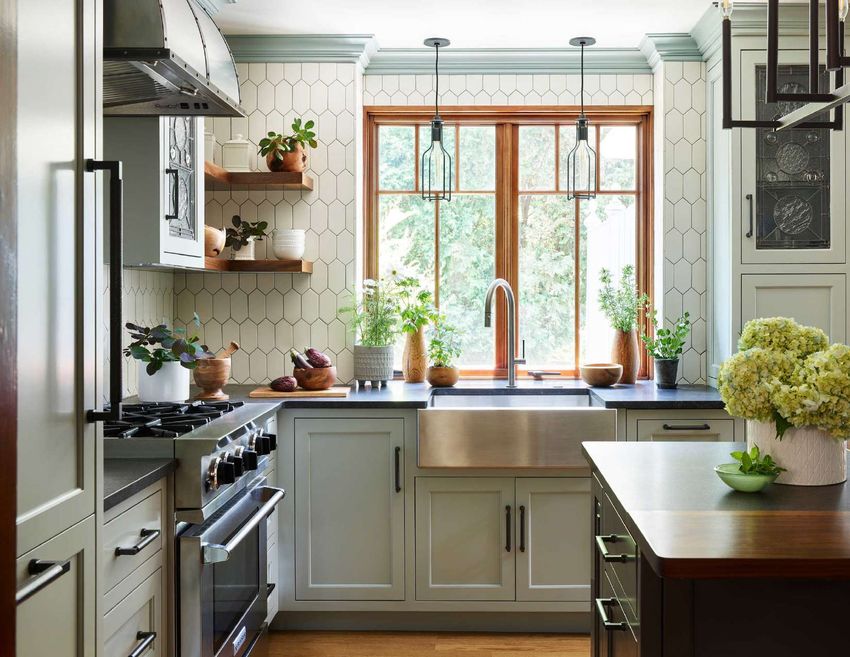
About This Report
The National Kitchen & Bath Association commissioned the highly regarded
John Burns Real Estate Consulting firm (JBREC) to work with them to produce
this report. In addition to quantifying the overall size of the kitchen and bath
market, this analysis reviews the housing industry factors and consumer
preferences and behaviors impacting 2021 industry growth.

JBREC’s analysis employed research from a wide variety of sources: (1)
secondary research (e.g., U.S. Census American Housing Microdata, National
Apartment Association (NAA) Spending, National Association of Realtors,
Moody’s Analytics, Home Innovation Research Labs (HIRL) data), (2) home
improvement estimates and forecasts from John Burns’ proprietary studies and
consultants; and (3) a custom study conducted among 4,732 consumers who
had initiated a home improvement project since the start of the COVID-19
pandemic.

N K B A’ s 2 0 2 0 K i t c h e n & B a t h M a r k e t O u t l o o k p r o v i d e s a c o m p r e h e n s i v e v i e w o f
t h e U . S . r e s i d e n t i a l k i t c h e n a n d b a t h i n d u s t r y. N e w c o n s t r u c t i o n s p e n d i n g
estimates include both single family and multi-family units. Remodeling
spending estimates include improvements to both owner-occupied and rental
properties. All dollar figures cited in this report include both products and
labor (installed costs).
2021 Kitchen & Bath Market Outlook-January 2021- Virtual Conference ...
Report Contents
                                                   Impact of COVID-19 on
  4           Study Overview                  31   K&B Projects

  5           Executive Summary               43   Project Motivations/ Inspirations

                                                   Appendix
  7           Industry Size and 2021 Growth   48   • Detailed Methodology
                                                   • Consumer Demographics

              Housing Industry Factors
14            Impacting 2021 K&B Growth

Cover project designed by Jenny Madden,
with photography by Tory Williams.
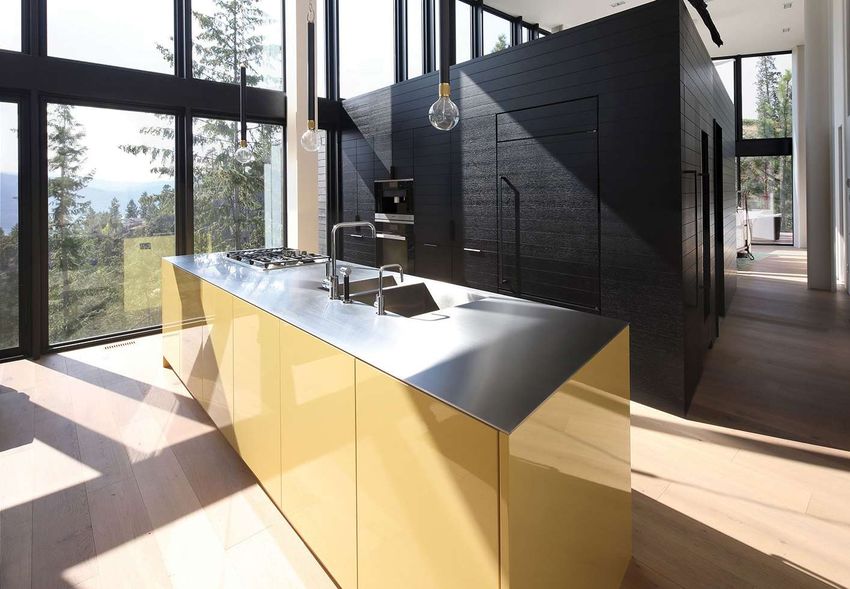
2021 Kitchen & Bath Market Outlook-January 2021- Virtual Conference ...
Study Overview

Research Purpose and Objectives
Provide an objective, thorough assessment of how COVID-19 and related economic and housing market trends
are influencing the U.S. kitchen and bath industry. This includes changes in consumer spending patterns and an
estimate of current market size and a forecast for 2021.
The primary objects of this research include:
     • Determining the size of the kitchen and bath industry, including spending by project type (kitchen
       versus bathroom) and end-market application (new construction versus remodeling).
     • Providing market growth estimates for 2021 based on the macroeconomic factors underlying the
       kitchen and bath spending forecasts for new construction and remodeling.
     • Analyzing changes in consumer spending patterns, including changes in the dollar budget of kitchen
       and bath residential remodeling projects, and motivations for DIY versus PRO remodels.
     • Analyzing the perceptions of the importance of areas of the home to determine how COVID-19 has
       changed or reinforced prior views.
     • Identifying how kitchen and bathroom features are remodeled together or in isolation, this
       interaction allows for a better understanding of what features trigger additional remodels.

                                                                                                            4
2021 Kitchen & Bath Market Outlook-January 2021- Virtual Conference ...
Executive Summary
The NKBA’s 2021 Kitchen & Bath Market Outlook provides a comprehensive review of current kitchen and
bath industry conditions and the macroeconomic factors that are expected to impact the industry in 2021.

Key Findings:
Residential kitchen and bath remodeling spend is poised for growth in 2021 based on a mix-shift to
bigger, more expensive and PRO-heavy interior remodels. Pent-up demand for more PRO-intensive
projects is a tailwind for spending growth in 2021.
New construction spending to benefit from the timing of starts in 2020 anticipated to dollarize in 2021;
strong housing starts in the latter half of 2020 and longer build times to favorably impact new construction
spending in 2021.
Total residential kitchen and bath spending to increase 16.6% in 2021, from $136.0 billion to $158.6
billion. This is driven by a 9.9% increase in kitchen and bath remodeling spending and a 22.3% increase
in kitchen and bath new construction spending.
Of the total $158.6 billion in total residential kitchen and bath spending, $68.6 billion represents residential
remodeling spending (43%) and $90 billion residential new construction (57%). This represents a two
percentage point mix-shift away from residential remodeling towards new construction spending, driven by
faster growth in new construction.
The overall dollar spend allocation between residential kitchen spending (48%) and residential
bathroom spending (52%) in 2021 is unchanged compared to the 2020 period.

                                                                                                               5
2021 Kitchen & Bath Market Outlook-January 2021- Virtual Conference ...
Executive Summary

Homeowners indicate the kitchen and bathroom rank two times more important compared to other parts of
the home. The pandemic has reinforced this perception, as the kitchen slightly gained status since the
pandemic.
Due to COVID-19, budgets for kitchen remodels fell faster than all other areas of home improvement, which is
a unique backdrop for faster growth in 2021, when the health-risks associated with a PRO inside the home
are diminished.
One key learning from the study: Kitchens remodels lead to future bathroom remodels, supporting an
acceleration in bathroom remodeling activity.
In addition, growth in cabinets, drives more widespread spending to other parts of the kitchen: product
attachment cascades from cabinets to the remodeling of other parts of the kitchen.
As COVID-19 behavior diminishes, reverting wallet share to services consumption is not likely to hurt
kitchen and bath; desire to save (given economic uncertainty) and health risks are the most influential
motivations: higher household precautionary savings is a potential source of financing for an anticipated
rebound in 2021 kitchen and bath spending.
These factors support a pronounced rebound in overall industry growth, from -5.9% in 2020 to 16.6% in
2021. Consistent with mix-shift away from less expensive remodels (pent-up COVID-19 related demand), the
high price-point for residential kitchen and bath spending is anticipated to lead growth (+19.8%),
followed by the mid price-point (+18.5%), with the low-price point posting strong, but lower rates of
growth (+9.7%).

                                                                                                          6
2021 Kitchen & Bath Market Outlook-January 2021- Virtual Conference ...
Kitchen & Bath Industry Size & Growth

                          Kitchen design by Nyla Free, photography by Ema Peter
2021 Kitchen & Bath Market Outlook-January 2021- Virtual Conference ...
2021 Forecast
 Projected Growth by Construction Type

  Residential Kitchen and Bath Spending                                                            2021 Spending Growth
  (in billions of $U.S. Dollars)                                                                         % change versus prior year

  $158.6                                          Total
                                                   K&B
                                                                                                              16.6%

  New Construction

  $90.0                                                                                                                     22.3%

 Remodel

 $68.6                                                                                            9.9%

Sources: Census AHS Microdata, NAA, HIRL, John Burns Real Estate Consulting LLC (Pub: Dec 2020)
All dollars include both products and labor (installed costs).

                                                                                                                                      8
2021 Kitchen & Bath Market Outlook-January 2021- Virtual Conference ...
2021 Forecast
  Projected Value by Segment

   Residential Kitchen and Bath Spending
   (in billions of $U.S. Dollars)

   $158.6                                          Total
                                                    K&B
                                                                                           Kitchens
                                                                                             $76.2
                                                                                                                 Bathrooms
                                                                                                                      $82.4

   Kitchens

   $76.2
                                                                                   New       Residential
                                                                                Construction Remodel
                                                                                   $39.5       $36.7

  Bathrooms

  $82.4
                                                                                                              New         Residential
                                                                                                           Construction    Remodel
                                                                                                              $50.5         $31.9

Sources: Census AHS Microdata, NAA, HIRL, John Burns Real Estate Consulting LLC (Pub: Dec 2020)
Notes: All dollars include both products and labor (installed costs).

                                                                                                                                 9
2021 Kitchen & Bath Market Outlook-January 2021- Virtual Conference ...
2021 Forecast
 Projected Value by Segment

  Residential Kitchen and Bath Spending                                                           2021 Spending Growth
  (in billions of $U.S. Dollars)                                                                      % change versus prior year

  Kitchens
                                                                                                        16.3%
  $76.2
 Bathrooms

 $82.4                                                                                                       16.8%

Sources: Census AHS Microdata, NAA, HIRL, John Burns Real Estate Consulting LLC (Pub: Dec 2020)
All dollars include both products and labor (installed costs).

                                                                                                                               10
Kitchen & Bath Activities by Spend Level

                        $                                                     $$              $$$

                  LOW                                              MEDIUM                  HIGH
    • Minor "update"                                        • Medium-scale           • Major full-service
      remodels, often DIY.                                    kitchen and bath         remodels, usually
                                                              remodels.                using a designer
    • Low-cost products
                                                                                       and showroom.
      often found in new                                    • Products in first or
      “starter” homes.                                        second "move-up"       • High-end products
                                                              homes.                   in new luxury
    • Usually funded out-
                                                                                       homes.
      of-pocket.                                            • Partially funded
                                                              from cash proceeds     • Upgrades financed
                                                              from home sale,          via bank loan or
                                                              investments, etc.        HELOC, in addition
                                                                                       to funding from
                                                                                       other sources.

Sources: John Burns Real Estate Consulting, LLC (Data: Nov-20, Pub: Dec-20)

                                                                                                            11
Spending in Mid-Price and High-Price Point
 Tiers to Post Highest Rates of Growth
                                                                           $                              $$                            $$$
               Residential Kitchen &                              Low-spend                        Mid-spend                      High-spend
                  Bath Spending                                   Price Point                      Price Point                    Price Point
                (in billions of $U.S. Dollars)

                 $158.6                                          $40.4                           $62.3                           $55.9
                                                                                                     18.5%                           19.8%
 2021 Growth

                       16.6%
                                                                      9.7%

Sources: Census AHS Microdata, NAA, HIRL, John Burns Real Estate Consulting LLC (Pub: Dec 2020)
Note: Low-Spend, Mid-Spend and High-Spend price point estimates were computed using averages based on these project scale definitions: Small scale: $17,700 for kitchens.

                                                                                                                                                            12
                                                                                                                                                            12
The Pandemic Caused a Decline in
 Mid- and High-Price Point Spending
  Before COVID-19 caused consumer spending to drop in 2020, total residential kitchen and bath
  spending grew +9% in 2018 and +1% in 2019.

 Residential Kitchen and Bath Spending by Price-Point Spend Level
 (in billions of $U.S. Dollars)

     2017       2018        2019        2020       2021

   $70
                                                                                                 $62
   $60                                                                     $57 $57                                                                $56
                                                                    $53                   $53
                                                                                                                         $50 $50 $47
   $50                                                                                                               $45
                                                $40
   $40                    $36 $37 $37
                  $33
   $30

   $20

   $10

    $0
                                  Low                                             Mid                                              High
Sources: Census AHS Microdata, NAA, John Burns Real Estate Consulting LLC (Pub: Dec 2020)
Note: Low-Spend, Mid-Spend and High-Spend price point estimates were computed using averages based on these project scale definitions: Small scale: $17,700
for kitchens.

                                                                                                                                                            13
                                                                                                                                                            13
Key Housing Industry Factors Impacting
2021 Kitchen & Bath Industry Growth
Real GDP Declined by 31% YOY in 2Q 2020 and
Rebounded 33% in Q3 2020 (annualized rate)
Real GDP – % Change Quarter-Over-Quarter        Seasonally adjusted (annualized)
                                                real GDP declined 31% in Q2 and
                                                increased 33% in Q3, a sharper
                                                rebound than was anticipated due
                                                to COVID-19.

Sources: BEA (Data: Q32020; Pub: Nov-20)

                                           See Terms and Conditions of Use and Disclaimers.       15
                                                                                                  15
                                              Distribution to non-clients is prohibited. © 2020
Downside Risk to the Economy Greatly Diminished;
Consensus of Continued Economic Growth

              WSJ Survey of Economists: Real GDP Forecast Range

   +6%

   +4%

   +2%

     0%
                        Even outlier forecasts indicate
                        positive economic growth

   -2%

                           Q4 2020                    Q1 2021                    Q2 2021                     Q3 2021                     Q4 2021

Sources: Wall Street Journal (Data: Oct-2020; Pub: Nov-2020). Monthly Survey of > 60 Economists
Notes: Dark horizontal line represents survey median; box represents interquartile range (1st to 3rd quartile) of real GDP forecasts

                                                                                                                   See Terms and Conditions of Use and Disclaimers.       16
                                                                                                                                                                          16
                                                                                                                      Distribution to non-clients is prohibited. © 2020
Housing & Home Improvement is Leading Economy Out
of the Recession, Like the 2002 Recovery
                                                                                                      Housing & home improvement leading
                                                                                                      the economy out of recession

Source: BEA (Data: 2Q20, Pub, Aug-20)                                                          *Historical Average: 1Q59 through Present
Notes: Grey shaded areas indicate early 2000s recession and COVID-19 recession

                                                                                 See Terms and Conditions of Use and Disclaimers.          17
                                                                                                                                           17
                                                                                    Distribution to non-clients is prohibited. © 2020
Total Payroll Employment Growth has Slowed Since August; U.S.
Employment Down 9.8 Million From Cycle Peak

Total US Payroll Employment
153M
151M                                                                                                                          Job at Cycle High

149M
147M
145M
143M
141M                                                                                                                                      Slowing
                                                                                                                                          Employment
139M                                                                                                                                      Growth
137M
135M
133M
131M
129M
        2000
        2000
        2001
        2001
        2002
        2002
        2003
        2004
        2004
        2005
        2005
        2006
        2007
        2007
        2008
        2008
        2009
        2009
        2010
        2011
        2011
        2012
        2012
        2013
        2014
        2014
        2015
        2015
        2016
        2016
        2017
        2018
        2018
        2019
        2019
        2020
Sources: Bureau of Labor Statistic, John Burns Real Estate Consulting, LLC (Data: Nov-20, Pub: Dec-20)

                                                                                                         See Terms and Conditions of Use and Disclaimers.       18
                                                                                                                                                                18
                                                                                                            Distribution to non-clients is prohibited. © 2020
Employment Losses Greatest in Service Sectors with Higher In-
Person Contact; Leisure and Hospitality Down 3.4 Million

Cumulative Job Losses by Employment Sector Since Pandemic Began (in Thousands)

              Leisure and Hospitality            -3,449
     Education and Health Services                                                                                 -1,256
Professional and Business Services                                                                                         -1,061
                        Manufacturing                                                                                                           -599
                           Retail Trade                                                                                                           -550
                       Other Services                                                                                                                 -432
                     Wholesale Trade                                                                                                                        -281
                            Information                                                                                                                     -280
                          Construction                                                                                                                      -279
  Transportation and Warehousing                                                                                                                                 -123
                   Financial Activities                                                                                                                          -115
                  Mining and Logging                                                                                                                               -90
                                Utilities                                                                                                                               -7
                                       -4,000          -3,500         -3,000          -2,500         -2,000         -1,500            -1,000              -500               0

Sources: Bureau of Labor Statistic, John Burns Real Estate Consulting, LLC (Data: Nov-20, Pub: Dec-20)

                                                                                                          See Terms and Conditions of Use and Disclaimers.          19
                                                                                                                                                                    19
                                                                                                             Distribution to non-clients is prohibited. © 2020
6 Million People Have Dropped Out of The Labor Force Since
February – Loss of Women a Concern for Growth and Productivity

  6 million less people in the labor force                                                                             …the recovery in the participation rate
  since the pandemic began…                                                                                            of women has lagged that of men

            Population Aged 16+ Not in the                                                                                           Labor Force Participation Rate:
                     Labor Force                                                                                                            Men and Women
 104 M                                                                    103 M                                        75

 102 M
                                                                                                             101 M     70
 100 M
                                                                                                                                         Labor Force Participation
                                                                                                                       65                Rate: Men
  98 M
                                                                                                                                         Labor Force Participation
  96 M                                                                                                                                   Rate: Women
                                                                95 M                                                   60

  94 M
                                                                                                                       55
  92 M

                                                                                                                       50
  90 M
                                                                                                                            Jan-19

                                                                                                                                                                                   Jan-20
                                                                                                                                                                 Sep-19

                                                                                                                                                                                                                       Sep-20
                                                                                                                                                        Jul-19

                                                                                                                                                                          Nov-19

                                                                                                                                                                                                              Jul-20

                                                                                                                                                                                                                                Nov-20
                                                                                                                                              May-19

                                                                                                                                                                                                     May-20
                                                                                                                                     Mar-19

                                                                                                                                                                                            Mar-20
                                              Sep-19

                                                                                                    Sep-20
                                     Jul-19

                                                       Nov-19

                                                                                           Jul-20

                                                                                                              Nov-20
          Jan-19

                                                                Jan-20
                   Mar-19

                                                                         Mar-20
                            May-19

                                                                                  May-20

Sources: Bureau of Labor Statistics, John Burns Real Estate Consulting, LLC (Data: Nov-20, Pub: Dec-20)

                                                                                                                                                       See Terms and Conditions of Use and Disclaimers.                                  20
                                                                                                                                                                                                                                         20
                                                                                                                                                          Distribution to non-clients is prohibited. © 2020
Employment Will Likely Take Longer to Return to Pre-Pandemic
Levels than Real GDP

                                 43% of Economists
                                 Expect Employment Will
                                 Take 3 Years to Recover

                                                  See Terms and Conditions of Use and Disclaimers.       21
                                                                                                         21
                                                     Distribution to non-clients is prohibited. © 2020
CARES Act Kept Household Income Growing; More Stimulus
Needed until Economy is on Firmer Footing

Wages and Salary & Disposable Personal Income Growth
Year-Over-Year, 3-Month Moving Average

14%

12%                                                                                                                                               Wages & Salary Disbursements
                                                                                                                                                  Disposable Personal Income
10%

8%

6%

4%

2%
                                                                                                                                                     Government Stimulus
0%                                                                                                                                                   Prevented Declines in
                                                                                                                                                     Household Income Growth
-2%

-4%

-6%
      2011
             2011
                    2011
                           2012
                                  2012
                                         2012
                                                2013
                                                       2013
                                                              2013
                                                                     2014
                                                                            2014
                                                                                   2014
                                                                                          2015
                                                                                                 2015
                                                                                                        2015
                                                                                                               2016
                                                                                                                      2016
                                                                                                                             2016
                                                                                                                                    2017
                                                                                                                                           2017
                                                                                                                                                   2017
                                                                                                                                                          2018
                                                                                                                                                                 2018
                                                                                                                                                                        2018
                                                                                                                                                                               2019
                                                                                                                                                                                      2019
                                                                                                                                                                                             2019
                                                                                                                                                                                                    2020
                                                                                                                                                                                                           2020
 Sources: BEA, John Burns Real Estate Consulting, LLC (Data: Oct-20, Pub: Nov-20)

                                                                                                                                       See Terms and Conditions of Use and Disclaimers.                    22
                                                                                                                                                                                                           22
                                                                                                                                          Distribution to non-clients is prohibited. © 2020
~1% Lower Mortgage Rates Than 1 Year Ago Driving
Increased Demand for Homes Across Buyer Segments

                                                                              Lower mortgage rates will drive home prices
                                                                              higher in 2021 as more consumers qualify to buy
                                                                              homes. At current rates, 71% of households
                                                                              (83.6M) can afford a $200K mortgage, and 26%
                                                                              (30M) can afford a $600 mortgage.

Source: John Burns Real Estate Consulting LLC (Data: Nov-20, Pub: Dec 2020)

                                                                                                                          23
                                                                                                                          23
Applications to Purchase a Home Rebounded to Pre-COVID
Levels in June and July After Severe Initial Decline in April

Purchase Mortgage Application Index
Seasonally adjusted weekly values

340

320

300

280

260

240

220

200

180
                                                            Jul-18

                                                                                                Nov-18
                                                                                                         Dec-18

                                                                                                                                                                        Jul-19

                                                                                                                                                                                                            Nov-19
                                                                                                                                                                                                                     Dec-19

                                                                                                                                                                                                                                                                                    Jul-20
      Jan-18

                                                   Jun-18

                                                                                                                  Jan-19

                                                                                                                                                               Jun-19

                                                                                                                                                                                                                              Jan-20

                                                                                                                                                                                                                                                                           Jun-20
                                                                     Aug-18
                                                                              Sep-18

                                                                                                                                                                                 Aug-19
                                                                                                                                                                                          Sep-19
                                 Apr-18

                                                                                                                                             Apr-19

                                                                                                                                                                                                                                                         Apr-20
                                                                                       Oct-18

                                                                                                                                                                                                   Oct-19
                                          May-18

                                                                                                                                                      May-19

                                                                                                                                                                                                                                                                  May-20
               Feb-18
                        Mar-18

                                                                                                                           Feb-19
                                                                                                                                    Mar-19

                                                                                                                                                                                                                                       Feb-20
                                                                                                                                                                                                                                                Mar-20
Note: The index does not capture cash transactions and thus understates actual total home buying activity.
Source: MBA (Data: Jul-20, Pub: Sep-20)

                                                                                                                                                                                                                                                                                    24
                                                                                                                                                                                                                                                                                    24
Record Low For-Sale Inventory Indicates Housing Stock is Set
for Price Appreciation – a Tailwind for Large-Scale Remodels

Existing Home Inventory for Sale                                                   Existing inventory = 1.53 mil (-20% YOY)
                                                                                   Historical average* = 2.37 mil
3-month average (non seasonally adjusted)

4.0M

3.6M

3.2M

2.7M

2.3M

1.8M

1.4M
       1983
       1984
       1985
       1986
       1987
       1988
       1989
       1990
       1991
       1992
       1993
       1994
       1995
       1996
       1997
       1998
       1999
       2000
       2001
       2002
       2003
       2004
       2005
       2006
       2007
       2008
       2009
       2010
       2011
       2012
       2013
       2014
       2015
       2016
       2017
       2018
       2019
       2020
Sources: NAR; John Burns Real Estate Consulting, LLC (Data: Jul-20, Pub: Aug-20)              *Historical Average: Jun-82 through current

                                                                                                                                       25
                                                                                                                                       25
~31% Total House Price Appreciation is Forecast between 2020-
2023; Driven by Supply Shortages and Underlying Demand

 Projected Home Price Appreciation

  10%

    9%                    8.7%
                                                               8.1%
    8%

    7%
                                                                                                    6.0%
    6%
                                                                                                                                        4.9%
    5%

    4%

    3%

    2%

    1%

    0%
                          2020P                                2021P                                2022P                               2023P
Source: John Burns Real Estate Consulting LLC (Data: Nov-20, Pub: Dec 2020). December year-over-year house price appreciation growth.

                                                                                                                                                26
                                                                                                                                                26
At ~29%, Housing Payment to Income Levels are Around the
Historical Median

                                                           27
                                                           27
Strong Single Family Residential Starts Growth Anticipated
 in 2020 and 2021

   Single Family Starts are anticipated to                                               …this contrasts with ongoing weakness
   post strong rates of growth…                                                          for Multifamily Starts

    U.S. Single Family Residential Starts                                                U.S. Multifamily Residential Starts
   2,000K                                                                                1,000K
   1,800K                                                    2020: +10%                     900K                                                           2020: -3%
   1,600K                                                    2021: +9%                      800K                                                           2021: -36%
   1,400K                                                                                   700K
   1,200K                                                                                   600K
   1,000K                                                                                   500K
                                     1108K

                                                                     1070K
                                                     980K

     800K                                                                                   400K

                                                                                                                                                   390K
     600K                                                                                   300K

                                                                                                                               307K
     400K                                                                                   200K

                                                                                                                                                                     250K
     200K                                                                                   100K
        0K                                                                                     0K
                                                     2020P

                                                                     2021P

                                                                                                                                                   2020P

                                                                                                                                                                     2021P
                                     Cur.mo.SA*

                                                                                                                               Cur.mo.SA*
                    2019

                                                                                                           2019

Cur. Mo. SA = Current month (seasonally adjusted annual rate)
Source: U.S. Census Bureau, John Burns Real Estate Consulting, LLC forecasts (Data: Oct-20, Pub. Nov.20)

                                                                                                              See Terms and Conditions of Use and Disclaimers.               28
                                                                                                                                                                             28
                                                                                                                 Distribution to non-clients is prohibited. © 2020
Longer Cycle Times and Product, Labor, Entitlement Causing
Starts to Dollarize in 2021

                                                             29
                                                             29
Strong Single Family Starts Growth and Timing of Starts Dollarizing
to Drive +17% Growth in New Residential Building Materials

 Total Spending on New Construction Residential Building Materials
 Billions
 $160                New construction building material spending will grow
                     +17% in 2021, boosted by strong starts growth and                            $149.0B
                     favorable timing of building product orders.
 $140
                                                                                        $126.1B
                                                                                   7%
 $120                $113.6B
                                                           $107.9B            +1
 $100

  $80

  $60

  $40

  $20

    $0
                         2019                                2020P                       2021P     2022P
Source: John Burns Real Estate Consulting LLC (Data: Nov-20, Pub: Dec 2020)

                                                                                                            30
                                                                                                            30
Impact of COVID-19 on Kitchen & Bath Projects
The Kitchen and Bathroom Rank More Important Than Other
Areas of the Home; the Pandemic has Reinforced this Perception

A higher share of homeowners indicate the kitchen and primary bathroom are “extremely important” compared to
other areas of the home – nearly two times greater than the average for all rooms.

Share of Homeowners Indicating Area of Home “Extremely Important”

            70%
                                                                                                                                                                                                                                                                Prior to Pandemic
  64%                 65% 65%              64% 65%
                                                                                                                                                                                                                                                                Since Start of Pandemic
                                                                            52%
                                                               49%

                                                                                                 37%
                                                                                                                                                                                                                                                                                         Average 33%
                                                                                     30%                             30%      30% 30%
                                                                                                              27%                                27% 27%           26% 27%                              27%
                                                                                                                                                                                          23%
                                                                                                                                                                                                                       21% 22%
                                                                                                                                                                                                                                                      19%         18% 18%                             18%
                                                                                                                                                                                                                                              15%                                        16%
                                                                                                                                                                                                                                                                                                                            13%
                                                                                                                                                                                                                                                                                                                   10%
                        Primary Bathroom

                                                                                                                                                                                                                         Formal Dining Area
     Indoor Kitchen

                                                                                                                                                                                                                                               Exercise Space
                                                                                      Home Office Workplace

                                                                                                                                                                                                                                                                    Guest Room / suite

                                                                                                                                                                                                                                                                                           Play areas / playroom

                                                                                                                                                                                                                                                                                                                    Outdoor Kitchen
                                                                                                                                                   Guest Bedroom

                                                                                                                                                                                           Indoor Entertainment Area
                                             Primary Bedroom

                                                                                                                                                                     Formal Living Room
                                                                                                                                Guest Bathroom
                                                                Family Living Area

                                                                                                               Outdoor Area

                                                                                                                                                                                                                                                                  Q1

Source: John Burns Real Estate Consulting LLC (Data: Nov-20, Pub: Dec 2020)

                                                                                                                                                                                                                                                                                                                        32
                                                                                                                                                                                                                                                                                                                        32
Indoor Kitchens Faced the Specter of Deferral in 2020;
Tailwind for Future PRO-Intensive Projects in 2021

Big interior projects (such as Indoor Kitchen remodels) are more PRO-intensive. Due to the invasive nature of
having a professional in the home since the start of the pandemic, these projects are likely deferred until there is
less health-risk associated with having a professional inside the home.

PRO Share of Remodels by Area of Home
                       Indoor Kitchen                                                                 43%
                 Guest Room / suite                                                                42%
                Formal Living Room                                                              40%
                   Primary Bathroom                                                          38%
                     Guest Bathroom                                                       37%           Indoor kitchen
                                                                                                        remodels have
                 Formal Dining Area                                                       37%          the highest PRO
              Play areas / playroom                                                    35%               share among
                     Exercise Space                                                   35%             areas of the home

                   Primary Bedroom                                                  33%
Family Living Area or Great Room                                                    33%
         Indoor Entertainment Area                                               32%
                     Guest Bedroom                                              32%
            Home Office Workplace                                               32%
                        Outdoor Area                                          29%

Source: John Burns Real Estate Consulting LLC (Data: Nov-20, Pub: Dec 2020)

                                                                                                                  33
                                                                                                                  33
Mix-Shift Down Positions for a Mix-Shift Up When the Health-
Risks Associated with a PRO Inside the Home are Diminished

The shift away from large invasive PRO remodeling projects since the start of the pandemic has had a
pronounced impact on the average spend of indoor kitchen remodels compared to other areas of the home. This
positions for a rebound in bigger, higher spend PRO-intensive remodels in 2021.

Percent Change in Average Remodeling Project Dollar Budget Since COVID-19 Pandemic

                            Indoor Kitchen Projects                           Projects other than Indoor Kitchen
  10%
                                                                                             1%
    0%

 -10%

 -20%

 -30%

 -40%

 -50%

 -60%                                      -54%

Source: John Burns Real Estate Consulting LLC (Data: Nov-20, Pub: Dec 2020)

                                                                                                                   34
                                                                                                                   34
Cabinets Frequently Act as an Anchor for the Remodeling
of Other Kitchen Features

Cabinets are frequently remodeled within a basket of other kitchen features. This suggested that cabinets are an anchor for
additional kitchen remodels.

Cabinet Product Attachment

                                                                         Cabinet remodels anchor
                                                                        additional kitchen remodels

Note: Includes both indoor and outdoor kitchens.
Source: John Burns Real Estate Consulting LLC (Data: Nov-20, Pub: Dec 2020)

                                                                                                                      35
                                                                                                                      35
Cabinets Had the Highest Share of “Budget-Friendly” Remodels

 Smart home products and water filtration systems were the focus of premium feature upgrades since the start of
 the pandemic; cabinets received the lowest share of premium upgrades.

 Shift in Price Point of Kitchen Features
  100%

    90%
                                                                                                                                             33%
    80%                                                                                                                44%       43%
                                                                                49%          46%           45%
                                54%                 51%          51%
    70%         57%

    60%

    50%

    40%                                                                                                                                      52%
                                                                                32%          38%           37%         39%       42%
                                                    31%          37%
    30%                         30%
                32%
    20%

    10%                         16%                 18%                         19%          16%           18%         16%
                11%                                              12%                                                             15%         15%
     0%
             Smart home    Wa ter filtra tion     Appliances   Countertops     Faucets /   Backsplash   Range hoods   Flooring   Lighting   Cabinets
              products       systems                                           plumbing

                                                No upgrade in quality        Budget friendly option     Premium upgrade

Note: Includes both indoor and outdoor kitchens
Source: John Burns Real Estate Consulting LLC (Data: Nov-20, Pub: Dec 2020)

                                                                                                                                                   36
                                                                                                                                                   36
The Share of Premium Upgrades Rises Across All Kitchen
Features with Higher Household Incomes

Luxury and premium upgrades to kitchen features are more likely to be undertaken by higher income
households (earning more than $120,000).

Share of Households Indicating “Premium Upgrade” to Kitchen Feature
                                                                                                                 Households Earning Less than $120,000
100%
                                                                                                                 Households Earning More than $120,000
 90%

 80%

 70%          65%
                                                            60%               60%
 60%                        58%
                                               54%                                                    54%                         55%
         50%             51%                50%                                          50%                          50%
 50%                                                     48%
                                                                       45%            44%                                                      43%
                                                                                                   40%            41%
 40%                                                                                                                            37%
                                                                                                                                            29%
 30%

 20%

 10%

   0%
          Smart home     Water filtration   Appliances   Countertops      Faucets /   Backsplash   Range hoods       Flooring    Lighting    Cabinets
           products        systems                                        plumbing

Note: Includes both indoor and outdoor kitchens
Source: John Burns Real Estate Consulting LLC (Data: Nov-20, Pub: Dec 2020)

                                                                                                                                                  37
                                                                                                                                                  37
In Addition to Household Income, Stage of Life Influences the
Choice of a Premium vs. More Budget-Friendly Kitchen Remodel

Drilling down further within the higher earning household cohort, the “Mature Households” (age 45+ with no
children) have the highest share of premium upgrades to the kitchen. This indicates stage of life and household
income jointly influence kitchen remodel cost considerations.

Share of All Kitchen Features Remodeled: Households Earning more than $120,000
100%                                                                                                                                              32 percentage point
                                                                                                                                                  increase in share of
90%                                                                                                                                               premium upgrades
                                                                                                                                                  to kitchen features
                   Premium upgrade
80%                      40%                                                                                     Premium upgrade
                                                                 Premium upgrade                                       46%
70%                                                                    54%
                                                                                                                                                               Premium upgrade
60%                                                                                                                                                                  78%

50%
                Budget friendly option
40%                      40%
                                                                                                              Budget friendly option
30%                                                           Budget friendly option                                   40%
                                                                       33%
20%                                                                                                                                                         Budget friendly option
                                                                                                                                                                      9%
                 No upgrade in quality
10%                      20%                                  No upgrade in quality                           No upgrade in quality                          No upgrade in quality
                                                                      13%                                             14%                                            13%
  0%
        Young single or couple (under age 45) with no   Family with childr en in the household, all   Family with childr en in the household, some    Mature single or couple (age 45+) with no
                 children in the household                            under age 12                      (or all) older than age 12 (including adult          children in the household
                                                                                                                          children)

Source: John Burns Real Estate Consulting LLC (Data: Nov-20, Pub: Dec 2020)

                                                                                                                                                                                          38
                                                                                                                                                                                          38
Kitchen Remodels Inspire Bathroom Remodels; Bathroom
Remodels Inspire Kitchen Remodels to a Lesser Degree

Longer-term kitchen remodels will be followed by future bathroom remodels. Deferred big project, PRO-
intensive kitchen remodels are likely to lead to strong bathroom remodeling activity.

% Respondents Indicating Next Project on the Remodeling “To-Do” list
                                                                  Households are approximately two times more likely to
                                                                  remodel their bathroom after an indoor kitchen remodel than
                                                                  the other way round

                                   18%

                                                                                                     9%

                    B AT H R O O M R E M O D E L                                           KITCHEN REMODEL

                 Following indoor kitchen remodel                                        Following bathroom remodel
Source: John Burns Real Estate Consulting LLC (Data: Nov-20, Pub: Dec 2020)

                                                                                                                                39
                                                                                                                                39
Bathroom Remodels Did Not Mix-Shift Down as Did Kitchen
Remodels Since the Start of the Pandemic

The more invasive nature of having a PRO in the home for a large remodel had less of an impact on bathroom
remodels since the start of the pandemic, compared to kitchen remodels. Deferral of kitchen projects is more of
a story of aversion to having a PRO-in-the-home; bathroom remodels more of a DIY story.

Average Remodeling Budget: Primary Bathroom Remodels Since the Start of the Pandemic

$4,500
$4,000
$3,500
$3,000
$2,500
$2,000
$1,500
$1,000
   $500
      $0
                                      Pre-Pandemic                            Since the Pandemic

Source: John Burns Real Estate Consulting LLC (Data: Nov-20, Pub: Dec 2020)

                                                                                                             40
                                                                                                             40
Bathroom Remodels Have Less of a Clear Anchor
to a Given Bathroom Feature

Bathroom remodels often touch other areas in the bathroom and have less of a clear anchor to a given bathroom feature
remodeled. Premium bathroom remodels, such as those which include smart home products, are often completed in
isolation and not with the addition of other areas of the bathroom.

Count of Bathroom Features Remodeled Together

                                                              Bathroom Remodels often involve multiple areas of
                                                              the bathroom; premium upgrades (smart home
                                                              products) equally likely to be done in isolation

.
Source: John Burns Real Estate Consulting LLC (Data: Nov-20, Pub: Dec 2020)

                                                                                                                   41
                                                                                                                   41
Plumbing and Cabinets Were the Focus of “Budget” Remodels
Since the Start of the Pandemic

Premium upgrades are concentrated in smart home products for bathrooms. Consumers are more likely to
choose “budget-friendly” options in their bathroom remodels than in their kitchens.

Bathroom Features Remodeled Since the Start of the Pandemic
 100%

  90%
                                                                                                                                        33%
  80%                                                                                    43%         42%         42%        42%
                              47%             46%            45%              45%
  70%          58%

  60%

  50%

  40%                                                                                                38%         36%                    52%
                                              35%            35%              35%        39%                                43%
                              38%
  30%
               31%
  20%

  10%                                         19%            20%              20%        18%         20%         22%
               11%            15%                                                                                           16%         15%
    0%
            Smart home       Flooring        Lighting       Bathtubs          Toilets   Cabinets   Countertops   Mirrors   Faucets /   Cabinets
             products                                                                                                      plumbing
                                          No upgrade in quality         Budget friendly option     Premium upgrade

Note: Includes both indoor and outdoor kitchens
Source: John Burns Real Estate Consulting LLC (Data: Nov-20, Pub: Dec 2020)

                                                                                                                                          42
                                                                                                                                          42
Project Motivations / Inspirations
The Desire to Save, Time Allocation and Health-Related
Motivations Drive Choice to Do Recent DIY Projects
The pandemic has shifted the focus towards DIY projects for reasons related to saving money, more free time to pursue
projects, the direct health risk of the pandemic (avoiding a PRO in the home) and shifting wallet share. These projects are,
in general, less costly and smaller remodels compared to those requiring a PRO. A vaccine, or other measures to reduce
the public health impact of the virus, is likely to reverse or mitigate these DIY boosting trends.

  Reasons Cited as a “Significant Factor” for Recent DIY Projects

                                                                               Shifting wallet share trails
                                                                               more influential reasons for
        25%                                                                    a DIY project
                                   23%                        22%
                                                                                         15%
                                                                                                                  12%

                                                                                                                                    3%

Desire to save money        More free time to          Health and safety            Availability of          Inability to find an   Other
                           pursue DIY projects            concerns               discretionary funds       industry professional
                                                                                 previously spent on           to do the work
Increased savings                                                                     activities
potentially a source of
financing for larger kitchen
and bath projects in 2021

  Source: JBREC Online Survey Panel, John Burns Real Estate Consulting LLC (Data: Nov-20, Pub: Dec 2020)

                                                                                                                                            44
                                                                                                                                            44
Discretionary Spend Motivations Dominate other Reasons
for a Remodel Since the Pandemic Began

Households indicated that considerations such as improving the home’s aesthetics, maximizing quality and
durability, and increasing the value of the home are primary motivations for both kitchen and bathroom remodels
since the start of the pandemic. Increasing storage appears to be a stronger motivation for kitchen remodels,
compared to bathroom remodels.

Motivations for Kitchen and Bathroom Remodels Since the Start of the Pandemic
                                                                                                                                                                        Bathroom
18%                     Discretionary reasons for a
          16%           remodel lead other categories                                                                                                                   Kitchen
16%             15%

14%
                              12%
12%                                   11% 11%
                        10%                                       11%             10%
                                                           10%          10%
10%                                                                                     9%
                                                                                                                               8%
 8%                                                   7%                                               7%        7% 7%               7%        7%               7%
                                                                                                 6%                                                  6%              6%
 6%
 4%
 2%                                                                                                                                                                             1% 1%

 0%
         Improve your   Maximize     Increase value   Increase   Replace similar Repair existing Create a more Minimize cost   Promote or     Add luxury for Improve safety /   Other
           home's        quality /    of your home     storage    existing item   products or      functional                  protect our   your enjoyment accessibility
          aesthetics    durability                                                installations     floorplan                    health

 Source: NKBA/ JBREC Online Survey Panel, John Burns Real Estate Consulting LLC (Data: Nov-19, Pub: Dec 2020)

                                                                                                                                                                                        45
                                                                                                                                                                                        45
Google Search and Social Media are the Primary Inspirations
for Kitchen & Bathroom Remodels

 Google Search is the primary inspiration for kitchen and bathroom remodels. This is followed by a variety of
 other sources where homeowners find inspiration. Households frequently indicate they rely on more than
 one source to inspire them prior to a remodel.

 Sources of Inspiration for Kitchen and Bathroom Remodels (% of Responses)

                      Google search
                                                                                                 Kitchen
                            Instagram
                                                                                                 Bathroom
            Television show / HGTV
                 Design professional
                             Pinterest
                            Facebook
Other homes I have seen in person
                                Other
                                Houzz
                           Magazine
                         Design blog
                   E-design website

                                         0%                    5%              10%   15%   20%           25%

 Source: John Burns Real Estate Consulting LLC (Data: Nov-20, Pub: Dec 2020)

                                                                                                        46
                                                                                                        46
The Importance of Google and Social Media is Robust Across
Most Life Stages, Particularly Younger Households

Mature adults (45+) put greater weight on “other homes seen in person” than social media. This contrasts
with other Stage of Life categories.

Top Three Sources of Inspiration for Kitchen Remodels by Stage of Life (% of Responses)

30%

25%
                 Google

                                                      Google

                                                                                            Google
20%

                                                                                                                                  Other Homes Seen in Person
                          Instagram

15%
                                                                Instagram

                                                                                                                                                                            Google
                                                                                                     Instagram

                                                                                                                                                               Television
                                                                            Design Pro

                                                                                                                 Television
10%
                                      FB

 5%

 0%
              Young Single or Couple             Family with Young Children              Family with Older Children           Matures Singles or Couples
                YOUNG SINGLE                          FA M I LY W I T H                      FA M I LY W I T H                  M AT U R (45+)
                                                                                                                                         E SINGLES
                 OR COUPLE                         YOUNG CHILDREN                         OLDER CHILDREN                           OR COUPLES
                                                                                                                                        (45+)
Source: John Burns Real Estate Consulting LLC (Data: Nov-20, Pub: Dec 2020)

                                                                                                                                                                                     47
                                                                                                                                                                                     47
Appendix

           Kitchen design by Karen Swanson, photography by Jared Kuzia
Detailed Methodology
New Construction: John Burns Real Estate Consulting (JBREC) analyzed construction costs for new construction spending by
category within new home kitchens and bathrooms. Homes were segmented by size and price point. Due to regional differences in
home price points, segmentation was conducted by nine census divisions, then rolled up. All figures include both products and
labor (installed costs).

Kitchen and Bath Remodel: Spending values are JBREC calculations from tabulations of U.S. Census American Housing Survey
home-improvement projects microdata, NAA spending (rental), JBREC home-improvement estimates, and forecasts of single-
family rental renovation spending. All values include labor and materials, including all major elements within kitchen and bath
spending (plumbing fixtures, faucets, tile, vanities, countertops, lighting, showers and baths, etc.).

To better understand project activity in-light of COVID-19, a total of 4,732 online surveys were conducted in mid-November of 2020
among homeowners who had initiated a home improvement project since the start of the COVID-19 pandemic.
   •   Target household income distribution to approximate AHS 2019 survey of homeowners
   •   Target household head age distribution to approximate AHS 2019 survey of homeowners

Respondents were represented across four noncontiguous U.S. regions as defined below:
   •   Northeast: Connecticut, Maine, Massachusetts, New Hampshire, Rhode Island, Vermont, New Jersey, New York, Pennsylvania
   •   Midwest: Indiana, Illinois, Michigan, Ohio, Wisconsin, Iowa, Kansas, Minnesota, Missouri, Nebraska, North Dakota, South Dakota
   •   South: Delaware, District of Columbia, Florida, Georgia, Maryland, North Carolina, South Carolina. Virginia, West Virginia, Alabama, Kentucky,
       Mississippi, Tennessee, Arkansas, Louisiana, Oklahoma, Texas
   •   West: Arizona, Colorado, Idaho, New Mexico, Montana, Utah, Nevada, Wyoming, Alaska, California, Hawaii, Oregon, Washington

Source: NKBA/ JBREC Online Survey Panel; n=4,732

                                                                                                                                                        49
Consumer Demographics
 Age Range

40%
                                                                                                                                          33%
30%

20%
                                                                                                               14%           15%
                                                                             10%              9%
10%                           5%              5%              6%
             3%
 0%
          Under 30          30-34            35-39            40-44          45-49            50-54            55-59         60-64     65 or over

 Annual Household Income Distribution

30%
                                                                                                                                             23%
20%

                                  7%         9%          8%           8%        6%         8%                               7%
10%
                      4%                                                                               6%          6%
           3%                                                                                                                        4%
  0%
         < $10K      $10K -     $20K -      $30K -     $40K -     $50K -      $60K -     $70K -       $80K -      $90K -   $100K - $110K - > $120K
                     $19.9K     $29.9K      $39.9K     $49.9K     $59.9K      $69.9K     $79.9K       $89.9K      $99.9K   $109.9K $119.9K

Source: NKBA/ JBREC Online Survey Panel; n=4,732
Notes: Raw data shown. Target sample weights determined according to the 2019 AHS survey; subset of homeowners.

                                                                                                                                                    50
Limiting Conditions
The conclusions and recommendations presented in this report are based on our analysis of the information available to
us from our research as of the date of this report. We assume that the information is correct and reliable and that we
have been informed about any issues that would affect project marketability or success potential.

Our conclusions and recommendations are based on current and expected performance of the national, and/or local
economy and real estate market. Given that economic conditions can change and real estate markets are cyclical, it is
critical to monitor the economy and real estate market continuously, and to revisit key project assumptions periodically to
ensure that they are still justified.

The future is difficult to predict, particularly given that the economy and housing markets can be cyclical, as well as
subject to changing consumer and market psychology. There will usually be differences between projected and actual
results because events and circumstances frequently do not occur as expected, and the differences may be material. We
do not express any form of assurance on the achievability of any pricing or absorption estimates or reasonableness of the
underlying assumptions.

In general, for projects out in the future, we are assuming “normal” real estate market conditions, and not a condition of
either prolonged “boom” or “bust” market conditions. We do assume that economic, employment and household growth
will occur more or less in accordance with current expectations. We are not taking into account major shifts in the level of
consumer confidence; in the ability of developers to secure needed project entitlements; in the cost of development or
construction; in tax laws that favor or disfavor real estate markets; or in the availability and/or cost of capital and
mortgage financing for real estate developers, owners and buyers. Should there be such major shifts affecting real estate
markets, this analysis should be updated, with the conclusions and recommendations summarized herein reviewed and
reevaluated under a potential range of build-out scenarios reflecting changed market conditions.

We have no responsibility to update our report analysis for events and circumstances occurring after the date of our
report. This analysis represents just one resource that should be considered when assessing a market opportunity.

                                                                                                                        51
All NKBA research reports can be accessed by clicking here
and visiting the Market Research page at NKBA.org.

About the National Kitchen & Bath Association
The National Kitchen & Bath Association (NKBA) is the not-for-
profit trade association that owns the Kitchen & Bath Industry
Show® (KBIS), as part of Design and Construction Week® (DCW).
With nearly 50,000 members in all segments of the kitchen and
bath design and remodeling industry, the NKBA has educated and
led the industry since the association’s founding in 1963. The
NKBA envisions a world where everyone enjoys safe, beautiful and
functional kitchen and bath spaces. The mission of the NKBA is to
inspire, lead and empower the kitchen and bath industry through
the creations of certifications, specialty badges, marketplaces and
networks. For more information, visit www.nkba.org or call
1-800-THE-NKBA (843-6522).

KBIS ® and NKBA ® are registered trademarks of the
National Kitchen & Bath Association.

Kitchen design by Sarah Robertson, AKBD, photography by Adam Kane Macchia
You can also read