CROMWELL EUROPEAN REIT - European Real Estate Overview and Outlook INVEST Fair Suntec Singapore 17 August 2019
←
→
Page content transcription
If your browser does not render page correctly, please read the page content below

CROMWELL
EUROPEAN REIT
European Real Estate
Overview and Outlook
INVEST Fair
Suntec Singapore

17 August 2019
Disclaimer
This presentation shall be read only in conjunction and as a supplementary information to Cromwell European Real Estate Investment Trust’s (“CEREIT”) financial results
announcement dated 8 August 2019 published on SGXNet.
This presentation is for information purposes only and does not constitute or form part of an offer, invitation or solicitation of any offer to purchase or subscribe for any
securities of CEREIT in Singapore or any other jurisdiction nor should it or any part of it form the basis of, or be relied upon in connection with, any contract or commitment
whatsoever. The value of units in CEREIT (“Units”) and the income derived from them may fall as well as rise. The Units are not obligations of, deposits in, or guaranteed by
Cromwell EREIT Management Pte. Ltd, as manager of CEREIT (the “Manager”), Perpetual (Asia) Limited (as trustee of CEREIT) or any of their respective affiliates. The
past performance of CEREIT is not necessarily indicative of the future performance of CEREIT.
This presentation may contain forward-looking statements that involve risks and uncertainties. Actual future performance, outcomes and results may differ materially from
those expressed in forward-looking statements as a result of a number of risks, uncertainties and assumptions. These forward-looking statements speak only as at the date
of this presentation. No assurance can be given that future events will occur, that projections will be achieved, or that assumptions are correct. Representative examples of
these factors include (without limitation) general industry and economic conditions, interest rate trends, cost of capital and capital availability, competition from similar
developments, shifts in expected levels of property rental income, changes in operating expenses, including employee wages benefits and training, property expenses,
governmental and public policy changes and the continued availability of financing in the amounts and the terms necessary to support future business.
Prospective investors and unitholders of CEREIT (“Unitholders”) are cautioned not to place undue reliance on these forward-looking statements, which are based on the
current view of the Manager on future events. No representation or warranty, express or implied, is made as to, and no reliance should be placed on, the fairness, accuracy,
completeness or correctness of the information, or opinions contained in this presentation. None of the Manager, the trustee of CEREIT or any of their respective advisors,
representatives or agents shall have any responsibility or liability whatsoever (for negligence of otherwise) for any loss howsoever arising from any use of this presentation or
its contents or otherwise arising in connection with this presentation. The information set out herein may be subject to updating, completion, revision, verification and
amendment and such information may change materially. An investment in Units is subject to investment risks, including possible loss of the principal amount invested.
Unitholders have no right to request that the Manager redeem or purchase their Units while the Units are listed. It is intended that Unitholders may only deal in their Units
through trading on Singapore Exchange Securities Trading Limited (the “SGX-ST”). Listing of the Units on the SGX-ST does not guarantee a liquid market for the Units.

  Goldman Sachs (Singapore) Pte. and UBS AG, Singapore Branch were the joint issue managers for the initial public offering of CEREIT (the “IPO”). DBS Bank Ltd., Goldman
  Sachs (Singapore) Pte., and UBS AG, Singapore Branch were the joint global coordinators for the IPO. DBS Bank Ltd., Goldman Sachs (Singapore) Pte., UBS AG, Singapore
  Branch, Daiwa Capital Markets Singapore Limited and CLSA Singapore Pte Ltd were the joint bookrunners and underwriters for the IPO. The joint issue managers, joint global
  coordinators and joint underwriters of the IPO assume no responsibility for the contents of this announcement.
______________________
All figures in this presentation are as at 30 June 2019 and stated in Euro (“EUR” or “€”), unless otherwise stated
1.     “p.p.” refers to percentage points, and “bp” refers to basis points
2.     “dpu” refers to distribution per unit
3.     “cpu” refers to cents per unit
4.     “Q-on-Q” refers to quarter on quarter
5.     The CEREIT Prospectus dated 22 November 2017 (“Prospectus”) disclosed a profit projection for the period from 1 January 2019 to 31 December 2019. “IPO Forecast” refers to the interpolation of this projection
       for the relevant period adjusted for the issuance of 600,834,459 new Units in December 2018 (the “Rights Issue”) where applicable
6.     “1Q 2019” refers to the period from 1 January 2019 to 31 March 2019; “2Q 2019” refers to the period from 1 April 2019 to 30 June 2019; “1H 2019” refers to the period from 1 January 2019 to 30 June 2019;
       “FY2019” refers to the period from 1 January 2019 to 31 December 2019
7.     “pcp” refers to the prior corresponding period; “1H 2018” refers to the period from 1 January 2018 to 30 June 2018

                                                                                                                                                                                                                         2
                                          European Real Estate Overview and Outlook – INVEST Fair – Suntec Singapore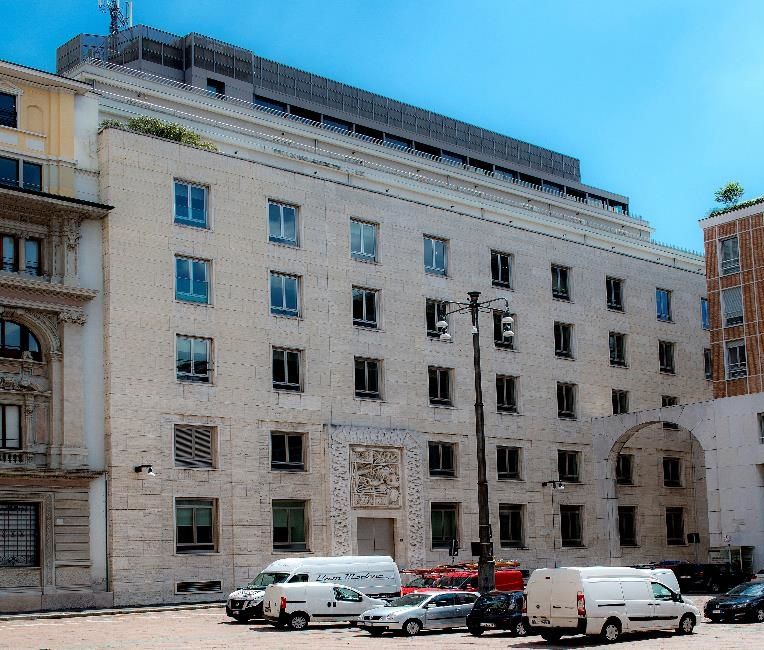
Contents
 1   European Real Estate Overview and Outlook

 2   CEREIT Introduction and Investment Case

 3   Portfolio Highlights

 4   Financial Performance

 5   Key Takeaways

                                                                                          3
             European Real Estate Overview and Outlook – INVEST Fair – Suntec Singapore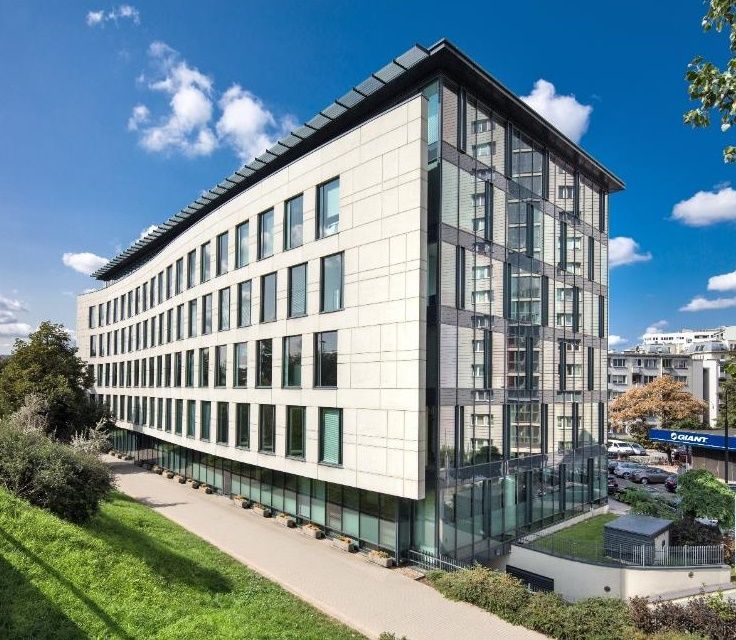
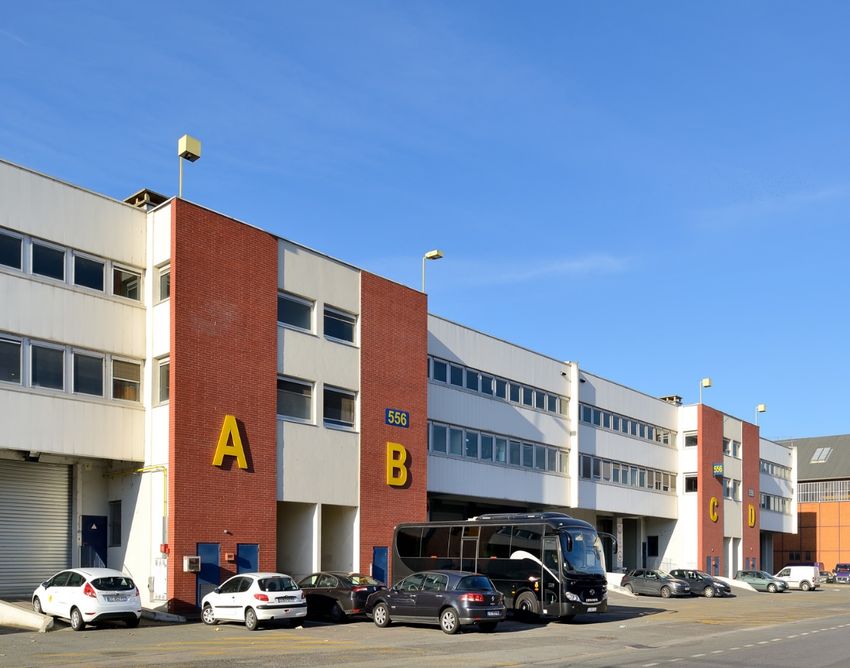
Parsdorfer Weg 10                                                   Boekweitstraat 1 - 21 & Luzernestraat 2 - 12
Kirchheim, Germany                                                  Nieuw-Vennep, The Netherlands

  European Real Estate
  Overview and Outlook

                                                                                                                   4
                     European Real Estate Overview and Outlook – INVEST Fair – Suntec Singapore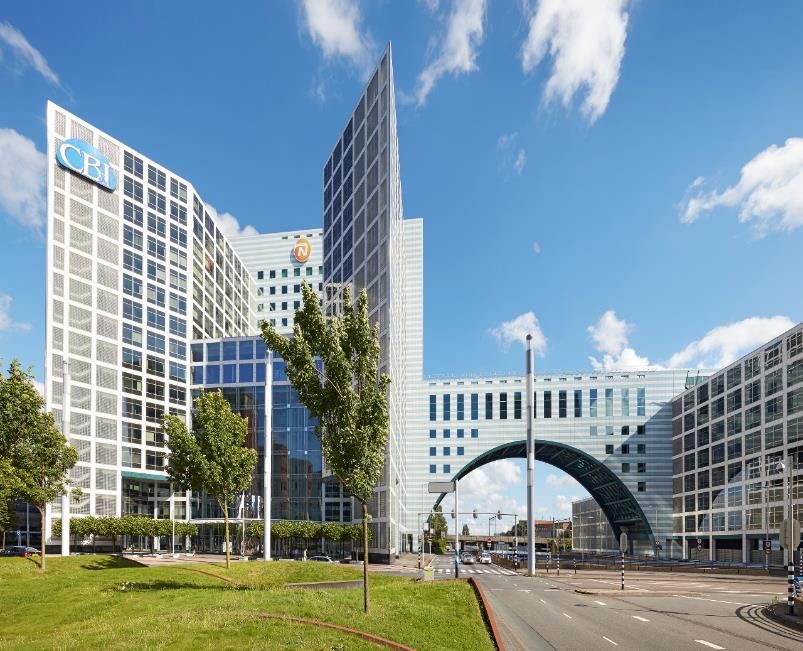
Commentary on the European Economy
Eurozone economies are slowing, however are not in recessionary mode
Still seeing robust activity in services sector although manufacturing sector
is in decline
Strong domestic demand remains as higher household spending is boosted
by increasing employment and wages growing at the fastest pace in a
decade
The labour market remains resilient and the unemployment rate is at a
decade-low of 7.5%
The European Central Bank (“ECB”) changed its forward guidance in June
to indicate that rates would remain at present levels until at least 2H 2020
Low cost of debt, with 12-month EURIBOR rate at -0.35%1, and 42% of
corporate debt and 60% of government bonds trading at negative yields2
Risks to global growth linger from political uncertainty to global trade
tensions, tighter monetary policies and a slowdown in China
______________________
Source: Oxford Economics, Tradeweb
1. As at 14 August 2019
2. As at 31 July 2019
5
European Real Estate Overview and Outlook – INVEST Fair – Suntec Singapore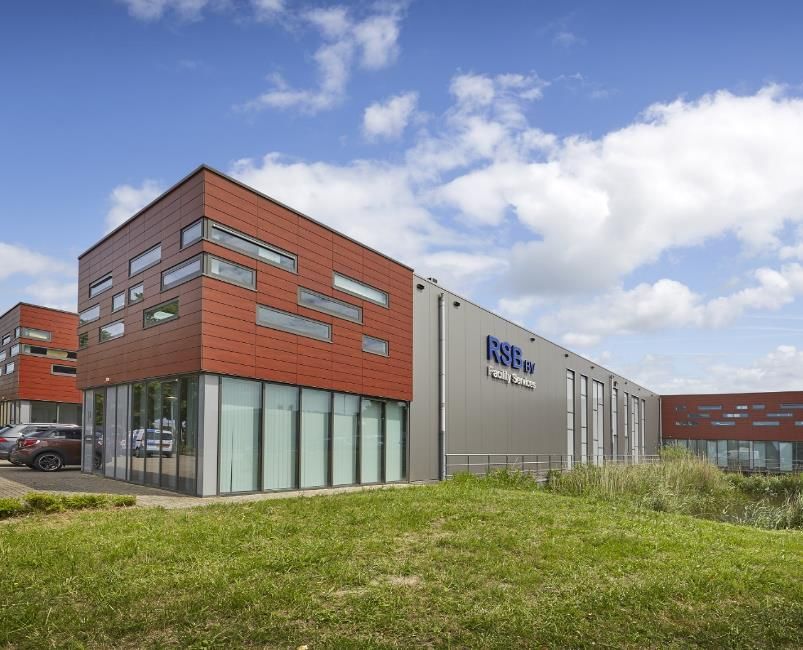
Commentary on European Commercial Real Estate
The ECB indicated that rates would remain at present levels until at Investment by Sector
(12 months to June 2019)
least 2H 2020 and the expectations are that the ECB will announce in
October that they are resuming quantitively easing (“QE”) at a pace of
5%
€30 billion per month 8%
Office
Europe’s real estate market is in relatively good health at the halfway 12% Retail
point of 2019 despite a slowing European economy and lower 42%
Apartment
investment volumes across the region Industrial
2Q 2019 initial European property trading volumes reached €59.7 billion, 20% Hotel
Dev Site
up an encouraging 16% on 1Q levels of activity 13%
European real estate capital inflows are still robust (44% of all global
inflows in 2Q) but have edged down since the beginning of 2019, with Top 10 European Destinations
(€ billion, 12 months to June 2019)
Asian capital being the dominant force
The office sector continues to be the most sought after, securing 43% of Finland. 6.97 Poland. 6.18
2Q trading volumes, similar to the 42% seen in 1Q; the industrial sector Austria. 7.82
recorded a market share of 10% – a similar level to the last twelve Italy. 8.21 Germany. 66.52
Sweden. 14.14
months
The Netherlands.
Yields remain at historic lows across office and industrial sectors in the 19.23
majority of locations having stabilised across at the end of 2018
Spain. 23.71
Gateway European cities and Tier II markets with robust fundamentals United Kingdom.
56.57
continue to attract institutional investors
France. 36.35
Sources:
Real Capital Analytics – data as at 29 July 2019 6
European Real Estate Overview and Outlook – INVEST Fair – Suntec Singapore BNP Paribas – Investment Markets in Europe 2Q 2019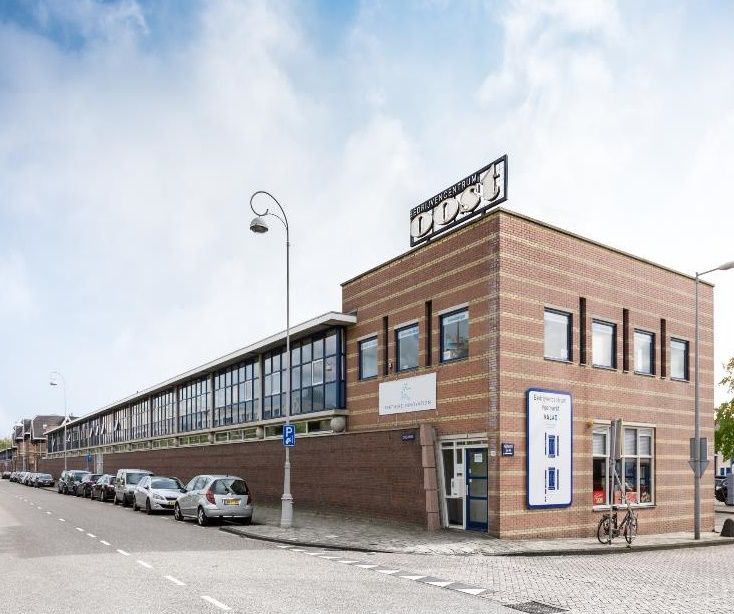
Global Capital Flows to Europe Momentum Continue in 2019
Cross-Border Activity: Twelve Months to 2Q 2019

                                           €46.9                                                                       EUROPE
                                                                                                                    (non domestic)
                                          Billion                                                €73.7
                                                                                                 Billion

                                                            EUROPE

                  THE AMERICAS
                                                                                 €20.1                    APAC

                                                                                 Billion
                                                               €6.7
                                                              Billion

                                                                           MIDDLE EAST
                                                                           AND AFRICA

                                                                                                                                                              7
                    European Real Estate Overview and Outlook – INVEST Fair – Suntec Singapore     Source: Real Capital Analytics – data as at 29 July 2019
Bastion                                                            Riverside
’s-Hertogenbosch, The Netherlands                                  Warsaw, Poland

CEREIT
Introduction and
Investment Case

                                                                                                   8
                      European Real Estate Overview and Outlook – INVEST Fair – Suntec Singapore
About CEREIT
     Our purpose is to deliver stable and growing distributions and asset value for all unitholders, through a
     proactive and sustainable approach to asset and capital management, acquisitions and divestments.

                                                                                                                   FINLAND
     Cromwell European REIT                                                        €2.08
     (“CEREIT”) is a real estate                                                   BILLION1                        Properties       11

     investment trust (“REIT”)                                                      DIVERSIFIED                    POLAND
                                                                                    PORTFOLIO
     with the principal                                                                                            Properties        6
     investment strategy of
                                                                                                                   DENMARK
     investing, directly or                                                        1032                            Properties       13
     indirectly, in a diversified                                                   PRIMARILY
     portfolio of income-                                                           FREEHOLD                       THE
                                                                                    PROPERTIES                     NETHERLANDS
     producing real estate
                                                                                                                   Properties       17
     assets in Europe that are
     used primarily for office,                                                     7
     light industrial / logistics,                                                 EUROPEAN
                                                                                   COUNTRIES
     and retail purposes.                                                                                                                GERMANY
                                                                                                                                         Properties    11

______________________

1.    Based on 97 properties valued as at 30 June 2019 and 6                       1.5m SQM2                                             ITALY
      properties as per the announced acquisitions on 21 June                       NET LETTABLE                                         Properties    17
      2019 recorded at purchase price. Upon successful
      completion of the sale of Parc d’Osny, the portfolio value will               AREA
      stand at €2,065 million with a total of 102 properties.

2.    Based on 97 properties as at 30 June 2019, and 6 properties
                                                                                                                                          FRANCE
      as per the announced acquisitions on 21 June 2019 that will
      be acquired in 2H 2019.                                                                                                             Properties   28

                                                                                                                                                       9
                                                       European Real Estate Overview and Outlook – INVEST Fair – Suntec Singapore
A Selection of CEREIT’s Properties

       Haagse Poort                 De Ruijterkade                       Bastion                 Bischofsheim (An der Steinlach)       Parc Des Grésillons               Naverland 7-11
The Hague, The Netherlands   Amsterdam, The Netherlands      ’s-Hertogenbosch, The Netherlands         Frankfurt, Germany                 Paris, France              Copenhagen, Denmark

    Milano Piazza Affari             Naverland 8                       Parc Delizy                        Central Plaza                   Koningskade           Bischofsheim (An der Kreuzlache)
      Lombardy, Italy           Copenhagen, Denmark                   Paris, France                Rotterdam, The Netherlands      The Hague, The Netherlands         Frankfurt, Germany

   Roma Amba Aradam          Hamburg (Moorfleeter Strasse)           Parc Des Docks                        Riverside                    Herstedvang 2-4                  Parc Acticlub
        Lazio, Italy              Hamburg, Germany                    Paris, France                     Warsaw, Poland               Copenhagen, Denmark                 Paris, France

                                                                                                                                                                                          10
                               European Real Estate Overview and Outlook – INVEST Fair – Suntec Singapore
New Properties
Paryseine + Lénine Cap Mermoz
Avatar Office Green Office Business Garden Poznań (Phase 1)
11
European Real Estate Overview and Outlook – INVEST Fair – Suntec SingaporeCEREIT’s Investment Case
Delivering Sustainable Unitholder Returns and Opportunity for Growth
7.9% Annualised Distribution Yield1 Balanced Asset Class
Exposure4
DPU of €2.04 cpu for 1H 2019 was 4.6% above the IPO Forecast DPU2 and 3.0%
above pcp3 7%
31%
On track to deliver the adjusted FY2019 IPO Forecast of €4.02 cpu2
€2.08 billion4 pan-European portfolio diversified across asset classes and geography
Well-positioned to take advantage of accretive acquisition opportunities in Europe with 62%
attractive yield / debt spreads and on-the-ground execution team
Light Industrial / Logistics
Able to source high-quality assets in strategic, “on-theme” cities Office
Others 5
Opportunities for income and net asset value growth via active asset management and
market rent growth with positive blended rental reversion rate of 4.8% for 2Q 2019 Diversified Geography
Exposure4
First divestment of non-core asset with the announced sale of Parc d’Osny
4% 5%
Well-managed debt with an aggregate gearing ratio of 35.4% and significant interest 12%
cover of 8.7x
21%
Cromwell Property Group (the “Sponsor”) is an internationally recognised sponsor 30%
listed on the Australian Securities Exchange 6%
______________________ 22%
1. Based on €0.51, the last traded price on SGX-ST on 31 July 2019 and DPU of €4.02 cpu (FY2019 IPO Forecast of €4.40 cpu adjusted for the Rights Issue in December 2018)
2. The IPO Forecast DPU for FY2019 was €4.40 cpu. Taking into account the new units issued in December 2018 (in accordance with paragraph 46 of Statement of
Denmark Finland
Recommended Accounting Practice 7 “Reporting Framework for Unit Trusts”), the adjusted FY2019 DPU is €4.02 cpu. 1H 2019 IPO Forecast is interpolated from the
France Germany
Adjusted FY2019 IPO Forecast Italy The Netherlands
3. 1H 2018 DPU is restated to reflect the bonus element in the new units issued pursuant to the Rights Issue in December 2018 Poland
4. Based on a total of 103 properties (97 properties valued as at 30 June 2019 and 6 properties as per the announced acquisitions on 21 June 2019 recorded at purchase price).
Upon successful completion of the sale of Parc d’Osny, the portfolio value will stand at €2,065 million with a total of 102 properties
5. Others include three government-let campuses, one leisure / retail property and one hotel in Italy
12
European Real Estate Overview and Outlook – INVEST Fair – Suntec SingaporeCromwell European REIT – Distribution Yield
CEREIT 2019E DPU Yield of 7.9%1 Compares Favourably to Other Global Yield Investment Alternatives
US
Europe Benchmarks Singapore Benchmarks
Yield Spread to Benchmark
Benchmarks
+7.0% +3.6% +6.0% +6.0% +5.4% +2.6%
7.9%
5.3%
4.3%
2.5%
1.9% 1.9%
0.9%
CEREIT 2019E DPU Europe 10-Year FTSE EPRA US Government Monetary Authority Central Provident FTSE Straits Times
1 2 3 4
Yield Government Bond Eurozone Index 10-Year Bond of Singapore Fund 5 REIT Index 6
10-Year Bond 4
____________________
Sources: Bloomberg, European Commission, data from April to June 2019
1. Based on €0.51, the last traded price on SGX-ST on 31 July 2019 and DPU of €4.02 cpu (FY2019 IPO Forecast of €4.40 cpu adjusted for the Rights Issue)
2. Based on the monthly averages (non-seasonally adjusted data) of the yields of the 10-year government bonds of the countries in the Eurozone
3. Based on Bloomberg’s estimated DPU yield for the year ended 31 December 2019 for FTSE EPRA Eurozone Index
4. Based on Bloomberg’s bid yield to maturity of bond
5. Based on the legislated minimum interest of 2.5% per annum earned in Central Provident Fund Ordinary Account
6. Based on Bloomberg’s estimated DPU yield for the year ended 31 December 2019 for FTSE Straits Times Real Estate Investment Trust Index
13
European Real Estate Overview and Outlook – INVEST Fair – Suntec SingaporeCEREIT’s Track Record Since IPO
More than 50% Growth in Portfolio Size since IPO
CEREIT Continues to Target Accretive High-Quality Assets in Strategic, “On-Theme” Cities and Markets
102 103
97 properties properties
93 properties Portfolio value at Portfolio value at
90 properties
properties Portfolio value at €1,993 €2,081
Portfolio value at
Portfolio value at €1,795 million million3
77 €1,718 million
75 €1,695
properties
properties million July 2019:
Sept 2019:
Expected completion
74 Portfolio value at million Feb 2019: Completed the of Business Garden,
properties Portfolio value at Jan 2019: Completed acquisition of in Poznań, Poland2
€1,426 Dec 2018: Completed acquisition of the Lénine, Paryseine
Portfolio value at €1,390 Completed acquisition of property in and Cap Mermoz
€1,354 million acquisition of properties in Sully- Genevilliers, France
million properties in Utrecht sur-Loire, Parcay- and properties in
assets in Paris,
France1 and Green
million Jun 2018:
Dec 2018:
Completed
and ‘s-
Hertogenbosch, the
Meslay and
Villeneuve-lès-
Warsaw and
Gdansk, Poland
Office and Avatar
Completed Office in Kraków,
acquisition of Netherlands, and in Béziers, France
Nov 2017: acquisition of Poland2
properties in Bari Helsinki and Kuopio,
Listed on SGX-ST property in Ivrea, and Genova, Italy Finland
Italy
Mar 2018:
Portfolio revalued Jul 2018:
higher at €1,361 Secured settlement
million on deferred
consideration for
Apr 2018: Parc Des Docks,
Commenced dual Paris, leading to €6m
currency trading valuation gain
____________________
1. Lénine, Paryseine and Cap Mermoz are herein referred to as “Greater Paris Properties”
2. Green Office, Avatar Office and Business Garden are herein referred to as “Poland Properties”
3. Based on a total of 103 properties (97 properties valued as at 30 June 2019 and 6 properties as per the announced acquisitions on 21 June 2019 recorded at purchase price). Upon successful completion of the sale of
Parc d’Osny, the portfolio value will stand at €2,065 million with a total of 102 properties
14
European Real Estate Overview and Outlook – INVEST Fair – Suntec SingaporeBacked by a Strong Sponsor Aligned with Unitholders
Cromwell Property Group is a Real Estate Investor and Manager, operating on Three Continents
with a Global Investor Base
A$11.5 3.8 million
billion AUM1 sq m
€$7.3
billion AUM1
280+
A$2.2 properties
billion
Market
capitalisation2
3,700+
tenants
A$204.1
million 390+
Profit for the people Legend:
financial year3
Markets with Cromwell’s presence
_____________________
1. Total assets for Cromwell Property Group as at 31 December 2018 including attributable asset under management (“AUM”) of Phoenix Portfolios (45%) and Oyster Group (50%)
2. Market capitalisation as at 31 December 2018
3. Profit for the financial year ended 30 June 2018
15
European Real Estate Overview and Outlook – INVEST Fair – Suntec SingaporeLong-Term Focus on Sustainability
Environment, Social and Governance (“ESG”) Matters are a Key Priority to CEREIT
CEREIT published its first sustainability report in May 2019, prepared in
compliance with Practice Note 7.6 (Sustainability Reporting Guide) of the
SGX-ST and in accordance to Global Reporting Initiatives (“GRI”) (core
option) standards
The CEREIT Manager has committed to clearly defined sustainability targets
that are measured and monitored
Key management has KPIs focused on specific ESG targets
CEREIT is participating for a second year in a row in the Global Real Estate
Sustainability Benchmark (“GRESB”) with rating results expected in
September
Portfolio-level focus on environment:
All CEREIT assets have obtained Energy Performance Certificates
(“EPC”) that are required by European energy efficiency legislation
CEREIT’s objective is to certify another 10 properties for BREEAM1 in-
use asset level certification in 2020
CEREIT’s assets in the Netherlands, Germany and Denmark have
already adopted renewable energy procurement contracts
____________________
1. Refers to the Building Research Establishment Environmental Assessment Method, the world’s leading sustainability assessment method for master planning projects, infrastructure and buildings. It recognises and
reflects the value in higher performing assets across the built environment lifecycle, from new construction to in-use and refurbishment. BREEAM is used as an asset-level sustainability certification.
16
European Real Estate Overview and Outlook – INVEST Fair – Suntec SingaporeCEREIT Board of Directors and Management Team
Majority Independent Board and Experienced Senior Leadership Team
Board of Directors
Lim Swe Guan Fang Ai Lian Christian Delaire Paul Weightman Simon Garing
Chairman and Independent Independent Independent Non-Independent Chief Executive Officer and
Non-Executive Director Non-Executive Director Non-Executive Director Non-Executive Director Executive Director
Leadership team
Simon Garing Thierry Leleu Shane Hagan Elena Arabadjieva Christina Tham
Chief Executive Officer Chief Investment Chief Financial Chief Operating Officer Head of Legal,
and Executive Director Officer Officer and Head of Investor Compliance and
Relations Company Secretarial
17
European Real Estate Overview and Outlook – INVEST Fair – Suntec SingaporeParc des Grésillons Hochstraße 150-152
Gennevilliers, France Duisburg, Germany
Portfolio Highlights
18
European Real Estate Overview and Outlook – INVEST Fair – Suntec SingaporeIncome Resilience Supported by Long WALE
Portfolio occupancy by area as at 30 June 2019 is 91.6%
4.7 years WALE remained stable Q-o-Q, WALB slightly reduced by 0.1 year to 3.8 years
Top 10 tenant-customers’ WALE is 4.9 years as at 30 June 2019
Pro-actively working on extension strategies
Lease Expiry Profile
67.0%
53.7%
49% of expiries and breaks until
[•]% of expiries and
December 2019 have been
breaks have been
54.0%
de-risked as of 30 June 2019
extended
40.9%
11.6% 10.1% 11.7% 12.0% 10.9%
6.5% 8.0% 8.4% 23.9%
20.5%
11.6% 14.9%
8.4% 2018 8.7% 10.8%
6.2% 2019 2020 2021 2022 and
Beyond
% by WALE % by WALB
2019 2020 2021 2022 2023 and beyond
% by WALE % by WALB
____________________
Note: WALE is defined as weighted average lease expiry by headline rent based on the final termination date of the agreement (assuming the tenant-customer does not terminate the lease on any of the permissible break date(s), if applicable), on the basis that
the Motorola Solutions Systems leases have been renewed; WALB is defined as the weighted average lease break by headline rent based on the earlier of the next permissible break date at the tenant-customer’s election or the expiry of the lease
19
European Real Estate Overview and Outlook – INVEST Fair – Suntec SingaporePositive Leasing Momentum Continues in 2Q 2019
Asset Management Highlights
Active leasing in 2Q 2019 Occupancy By Country
100.0%
47,242 sq m (41 leases) in new leases signed with
9,260 sq m in Office leases and 37,982 sq m in 90.0%
Light Industrial / Logistics leases
80.0%
This compares favourably against 25,043 sq m (53
leases) in new leases signed in 1Q 2019 70.0%
IPO Q1 2018 Q2 2018 Q3 2018 Q4 2018 Q1 2019 Q2 2019
Further uplift in portfolio occupancy rate in 2Q
2019 Denmark Finland France Germany
Italy Netherlands Poland TOTAL
91.6% occupancy by area as at 30 June 2019
This represents 1.4 p.p. increase from the 90.2% Occupancy By Sector
occupancy by area as at 31 March 2019
Positive rental reversion continues in 2Q 2019 95.0% 91.6%
89.1% 89.4% 88.7% 89.6%
Positive blended rental reversion rate (Office and 90.8% 90.2%
85.0%
Light Industrial / Logistics) of 4.8%, illustrating
rental growth across assets in average (Light
Industrial / Logistics at 9.1% vs. Office at -0.8%) 75.0%
IPO Q1 2018 Q2 2018 Q3 2018 Q4 2018 Q1 2019 Q2 2019
Light Industrial / Logistics sector contributed Light Industrial/Logistics Office Other TOTAL
39.1% of Net Property Income (“NPI”) in 1H 2019
20
European Real Estate Overview and Outlook – INVEST Fair – Suntec SingaporeFurther Diversification of High-Quality Tenant-Customer Base
Top 10 Tenant-Customers Represent 36.8% of the Portfolio as at 30 June 2019 (down from 41% at IPO)
Total no. of leases as at 30 June 2019 1,104
Total no. of tenant-customers as at 30 June 2019 911
Top 10 Tenant-Customers Tenant-Customer Trade Sector Breakdown by Headline Rent1
% of Total
# Customers Country
Headline Rent1
Agenzia del Demanio (Italian State 16.1% 16.4%
1 Italy 15.2%
Property Office)
2 Nationale-Nederlanden The Netherlands 6.1% 4.4%
4.4% 12.1%
3 Essent Nederland B.V. The Netherlands 3.0%
4.6%
4 Kamer van Koophandel The Netherlands 2.3%
5.7% 9.0%
5 Employee Insurance Agency (UWV)2 The Netherlands 2.3% 6.1%
7.8%
Holland Casino3 The Netherlands 1.9% 6.5% 7.0%
6
7 Anas Italy 1.6%
Public Administration Wholesale - Retail
8 A. Manzoni & c. S.p.A.4 Italy 1.6%
Financial - Insurance Manufacturing
9 Coolblue B.V. The Netherlands 1.4% Professional - Scientific Extraterritorial Bodies
Transportation - Storage IT - Communication
10 CBI Nederland B.V. The Netherlands 1.4%
Administrative Entertainment
36.8% Construction Others 5
____________________
1. As at 30 June 2019
2. Uitvoeringsinstituut Werknemersverzekeringen (UWV)
3. Nationale Stichting tot Exploitatie van Casinospelen in the Netherlands
4. Subsidiary of GEDI Gruppo Editoriale
5. Others comprise Accommodation / Utility / Education / Rural / Human Health / Mining / Other Service Activities / Residential / Water / Miscellaneous Services
21
European Real Estate Overview and Outlook – INVEST Fair – Suntec SingaporeParc des Docks Veemarkt
Paris, France Amsterdam, The Netherlands
Financial Performance
22
European Real Estate Overview and Outlook – INVEST Fair – Suntec SingaporeKey Financial Metrics
Net Property Income and Distributable Income Exceed IPO Forecast
Net Property Income (€‘000) Income Available for Distribution (€‘000)
€ ‘000 € ‘000
30,000 30,000
28,000 28,000
26,000 26,000
24,000 24,000
22,000 22,000
20,000 20,000
27,715
18,000 26,419 18,000
16,000 16,000 22,394 22,446
21,508 20,929
20,739
19,751
14,000 14,000
17,265 17,090 17,220
16,363
12,000 12,000
10,000 10,000
1
1Q FY18 2Q FY18 3Q FY18 4Q FY18 1Q FY19 2Q FY19 1Q FY181 2Q FY18 3Q FY18 4Q FY18 1Q FY19 2Q FY19
______________________
1. For the period from 1 January 2018 to 31 March 2018
23
European Real Estate Overview and Outlook – INVEST Fair – Suntec SingaporeResults Driven by Acquisitions
Key Performance Metrics for 1H 2019
1H 2019 vs 1H 2018 1H 2019 vs IPO Forecast2
Gross revenue up 32.5% Gross revenue up 31.5%
NPI up 33.7% NPI up 31.5%
Income available for distribution Income available for distribution
up 33.3% up 31.6%
DPU of €2.04 cents up by 3%1 DPU of €2.04 cents up by 4.6%
______________________
1. 1H 2018 DPU is restated to reflect the bonus element in the new units issued pursuant to the Rights Issue in December 2018
2. As compared to amounts stated in the Prospectus, adjusted for the Rights Issue where applicable. 1H 2019 IPO Forecast is interpolated from FY2019 IPO Forecast
24
European Real Estate Overview and Outlook – INVEST Fair – Suntec SingaporeOngoing Focus on Driving Distributable Income
Key Performance Metrics for 1H 2019
Gross Revenue and NPI
Outperformance driven by new acquisitions
Total Return
Includes €32.1 million fair value gain from valuations as at 30 June 2019 (€54.5 million gain in 1H 2018)
Distributable Income
€44.84 million, 31.6% above the IPO Forecast, and 33.3% above 1H 2018
DPU
€2.04 cents, 3.0% above 1H 20181 and 4.6% above the IPO Forecast2
Actual Actual IPO
Variance Forecast Variance
1H 2019 1H 2018 1H 2019
Gross Revenue (€’000) 82,372 62,147 32.5% 62,623 31.5%
NPI (€’000) 54,134 40,490 33.7% 41,167 31.5%
Total return for the period attributable to
56,865 71,652 20.6% 30,108 88.9%
Unitholders (€’000)
Income Available for Distribution to Unitholders
44,840 33,628 33.3% 34,071 31.6%
(€’000)
DPU (€ cents) 2.04 1.981 3.0% 1.952 4.6%
______________________
1. 1H 2018 DPU is restated to reflect the bonus element in the new units issued pursuant to the Rights Issue in December 2018
2. As compared to amounts stated in the Prospectus, adjusted for the Rights Issue in December 2018. 1H 2019 IPO Forecast is interpolated from FY2019 IPO Forecast
25
European Real Estate Overview and Outlook – INVEST Fair – Suntec SingaporeResponsible Capital Management
Aggregate leverage is 35.4%
Interest coverage ratio is at 8.7x reflects the wide spread between NPI and interest expense.
Annualised cost of debt stands at ~1.34% per annum (excludes RCF)
3-Month Euribor was -0.35 bps as at 14 August 2019
Debt refinancing programme well advanced which will increase weighted average term of debt to above 3.5yrs
Weighted Average Term to Maturity is 2.4 years1
€ million
(Expiring in November 2020)
• Italy - €150.0 million
350 • France - €66.0 million
61.8
• The Netherlands - €57.5 million
300
• Denmark - €26.1 million
Fixed-rate loan
250 against three core
assets in the
200 (Expiring in Netherlands
December 2021)
150 299.6
Pan-European facility
243.5
100 including Germany,
Poland, France and
50 the Netherlands
82.4
0
2019 2020 2021 2022 2023 2024 2025 2026
% of
Total 52.6% 35.4% 12.0%
Debt
Asset Financing Facilities Unsecured RCF (Drawn)
Total: €625.5 million Total: €61.8 million
______________________
1. Weighted average term to maturity includes the drawn portion of the RCF
26
European Real Estate Overview and Outlook – INVEST Fair – Suntec SingaporeHaagse Poort, The Hague Piazza Affari, Milan
The Netherlands Italy
Key Takeaways
27
European Real Estate Overview and Outlook – INVEST Fair – Suntec SingaporeKey Takeaways
Exceeded IPO Forecast for 2Q 2019 and 1H 2019
NPI for 1H 2019 up 31.5% vs. IPO Forecast
DPU of €2.04 cpu is up by 4.6% vs. IPO Forecast DPU and 3.0% above pcp DPU
Total return attributable to Unitholders for 1H2019 up 88.9% vs. IPO Forecast
Providing Resilient Income through Active Leasing
Leasing success continued in 2Q 2019 with significant lease outcomes at Parc dec Docks and Haagse Poort
1.4 p.p. increase in occupancy by area of the entire CEREIT Portfolio in 2Q 2019 vs. 1Q 2019
Positive blended rental reversion rate (Office and Light Industrial / Logistics) of 4.8%, illustrating rental growth
across assets in average (Light Industrial / Logistics at 9.1% vs. Office at -0.8%)
Barbell approach to portfolio management provides stability with long leases in the Office sector, coupled with
significant leasing activity across the Light Industrial / Logistics portfolio
Managing for Growth through Successful Acquisitions
CEREIT continues to target high-quality assets in strategic, "on-theme" cities and markets
Entry into the Greater Paris office market and increased presence in Poland – the growth champion of Europe –
through the acquisition of six predominantly office assets valued at €248.1 million, 100% Freehold, 98.7%
occupancy, 4.6 years WALE
Managing Capital Responsibly
Substantial headroom available to take advantage of investment opportunities
Interest coverage ratio is at 8.7x due to attractive spread between NPI and interest expense
28
European Real Estate Overview and Outlook – INVEST Fair – Suntec SingaporeTHANK YOU If you have any queries, kindly contact: Cromwell EREIT Management Pte. Ltd., Chief Operating Officer & Head of Investor Relations, Ms Elena Arabadjieva at elena.arabadjieva@cromwell.com.sg, Tel: +65 6920 7539, or Newgate Communications at cereit@newgatecomms.com.sg.
You can also read