Corporate Summary September 2021
←
→
Page content transcription
If your browser does not render page correctly, please read the page content below
Corporate
                                  Summary
                                  September 2021

TSX: YRI | NYSE: AUY | LSE: AUY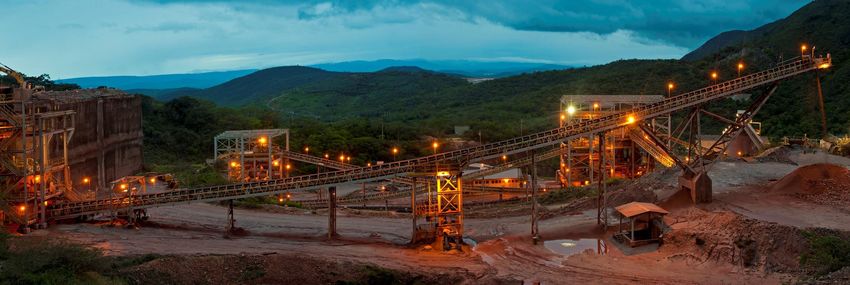
CAUTIONARY NOTE
REGARDING FORWARD-LOOKING STATEMENTS
CAUTIONARY NOTE REGARDING FORWARD-LOOKING STATEMENTS: This presentation contains or incorporates by reference “forward-looking statements” and “forward-looking information” under applicable
Canadian securities legislation within the meaning of the United States Private Securities Litigation Reform Act of 1995. Forward-looking information includes, but is not limited to leverage ratios, information
with respect to the Company’s strategy, plans, and future financial or operating performance, guidance on expected production, costs and capital spending, funding of growth objectives, the Company’s ten
year overview, plans for long term growth and Canadian production profile, future dividend payments and strategies, future use of the NCIB to purchase common shares, continued advancements at Jacobina
(including the potential Phase 2 and Phase 3 expansion), Canadian Malartic (including the development of the Odyssey project), Cerro Moro, El Peñón, Minera Florida and Minera Agua Rica Alumbrera (MARA),
the advancement of development projects including the Wasamac project growth objectives and funding thereof, the global economic impact of COVID-19 and its effect on the Company and market conditions,
future share price performance, future gold, silver and copper price performance, valuations, plans and objectives for future exploration and expected timing for the release of exploration updates, future
feasibility and pre-feasibility studies and the expected timing thereof, and the potential for future additions to mineral resources and mineral reserves. Forward-looking statements are characterized by words
such as “plan,” “expect”, “budget”, “target”, “project”, “intend”, “believe”, “anticipate”, “estimate” and other similar words, or statements that certain events or conditions “may” or “will” occur. Forward-
looking statements are based on the opinions, assumptions and estimates of management considered reasonable at the date the statements are made, and are inherently subject to a variety of risks and
uncertainties and other known and unknown factors that could cause actual events or results to differ materially from those projected in the forward-looking statements. These factors include the impact of
general domestic and foreign business, economic and political conditions, global liquidity and credit availability on the timing of cash flows and the values of assets and liabilities based on projected future
conditions, fluctuating metal prices (such as gold, copper, silver and zinc), currency exchange rates (such as the Brazilian real, the Chilean peso, the Argentine peso, and the Canadian dollar versus the United
States dollar), interest rates, possible variations in ore grade or recovery rates, changes in the Company’s hedging program, changes in accounting policies, changes in Mineral Reserves (as defined herein) and
Mineral Resources (as defined herein), and risks related to acquisitions and/or dispositions, changes in project parameters as plans continue to be refined, changes in project development, construction,
production and commissioning time frames, risks associated with infectious diseases, including COVID-19, nature and climatic condition risks, risks related to joint venture operations, the possibility of project
cost overruns or unanticipated costs and expenses, potential impairment charges, higher prices for fuel, steel, power, labour and other consumables contributing to higher costs and general risks of the mining
industry, including but not limited to, failure of plant, equipment or processes to operate as anticipated, unexpected changes in mine life, final pricing for concentrate sales, unanticipated results of future
studies, seasonality and unanticipated weather changes, costs and timing of the development of new deposits, success of exploration activities, permitting timelines, environmental and government regulation
and the risk of government expropriation or nationalization of mining operations, risks related to relying on local advisors and consultants in foreign jurisdictions, environmental risks, unanticipated reclamation
expenses, title disputes or claims, limitations on insurance coverage, timing and possible outcome of pending and outstanding litigation and labour disputes, risks related to enforcing legal rights in foreign
jurisdictions, vulnerability of information systems and risks related to global financial conditions, as well as those risk factors discussed or referred to herein and in the Company's Annual Information Form filed
with the securities regulatory authorities in all provinces of Canada and available at www.sedar.com, and the Company’s Annual Report on Form 40-F filed with the United States Securities and Exchange
Commission. Although the Company has attempted to identify important factors that could cause actual actions, events or results to differ materially from those described in forward-looking statements, there
may be other factors that cause actions, events or results not to be anticipated, estimated or intended. There can be no assurance that forward-looking statements will prove to be accurate, as actual results
and future events could differ materially from those anticipated in such statements. The Company undertakes no obligation to update forward-looking statements if circumstances or management’s estimates,
assumptions or opinions should change, except as required by applicable law. The reader is cautioned not to place undue reliance on forward-looking statements. The forward-looking information contained
herein is presented for the purpose of assisting investors in understanding the Company’s expected financial and operational performance and results as at and for the periods ended on the dates presented in
the Company’s plans and objectives and may not be appropriate for other purposes.
Non-GAAP Measures:
The Company has included certain non-GAAP financial measures and additional line items or subtotals, which the Company believes that together with measures determined in accordance with IFRS, provide
investors with an improved ability to evaluate the underlying performance of the Company. Non-GAAP financial measures do not have any standardized meaning prescribed under IFRS, and therefore they may
not be comparable to similar measures employed by other companies. The data is intended to provide additional information and should not be considered in isolation or as a substitute for measures of
performance prepared in accordance with IFRS. The non-GAAP financial measures included in this presentation include: Net free cash flow, free cash flow before dividends and debt repayments, net debt, cash
costs per gold equivalent ounce sold, all-in sustaining costs (AISC) per gold equivalent ounce sold. Please refer to section 11 of the Company's second quarter Management's Discussion and Analysis and
associated press release filed on SEDAR and includes a detailed discussion of the usefulness of the non-GAAP measures. The Company believes that in addition to conventional measures prepared in accordance
with IFRS, the Company and certain investors and analysts use this information to evaluate the Company’s performance. In particular, management uses these measures for internal valuation for the period and
to assist with planning and forecasting of future operations.
Qualified Persons
Scientific and technical information contained in this presentation has been reviewed and approved by Sébastien Bernier (Senior Director, Geology and Mineral Resources). Sébastien Bernier P.Geo is an
employee of Yamana Gold Inc. and a "Qualified Person" as defined by Canadian Securities Administrators' National Instrument 43-101 - Standards of Disclosure for Mineral Projects Data verification related to
certain scientific and technical information disclosed herein in connection with Yamana’s material properties can be found in the Company’s technical reports entitled “NI 43-101 Technical Report, El Peñón
Gold-Silver Mine, Antofagasta Region, Chile” and dated effective December 31, 2020, “NI 43-101 Technical Report, Jacobina Gold Mine, Bahia State, Brazil” and dated effective December 31, 2019, and “NI 43-
101 Technical Report, Canadian Malartic Mine, Quebec, Canada” and dated effective December 31, 2020 available under the Company’s profile on SEDAR at www.sedar.com and on the Company’s website. The
information presented herein was approved by management of Yamana Gold on September 7, 2021.
All amounts are expressed in United States dollars unless otherwise indicated.
This presentation includes market and industry data which was obtained from various publicly available sources and other sources believed by the Company to be true. Although the Company believes it to be
reliable, the Company has not independently verified any of the data from third party sources referred to in this presentation, or analyzed or verified the underlying reports relied upon or referred to by such
sources, or ascertained the underlying assumptions relied upon by such sources. The Company does not make any representation as to the accuracy of such information

                                                                                                                                                                                                                    2
s
    DOMINANT GOLD PRODUCER
    KEY REASONS TO INVEST(1)

                                                                                                                              Providing a
                                                                        Ability to                                           Strengthening
                                                       Asset            Deliver on      Country Risk        Financial            Return
                   ESG                                Quality            Results          Profile           Strength        to Shareholders
         A Commitment to                          High Quality          Track Record     Operating in     Strong Balance       Cumulatively
         High Quality ESG                          Diversified         of Consistency   Mining Friendly      Sheet and      Increased Dividend
           Management                            Portfolio with                          Jurisdictions    Increasing Free          500%
                                                      Long                                                  Cash Flows         Since Q2 2019
                                                   Life Assets
                                                                                                                            Announced a NCIB

    1.    See Cautionary Note Regarding Forward-Looking Information.                                                                             3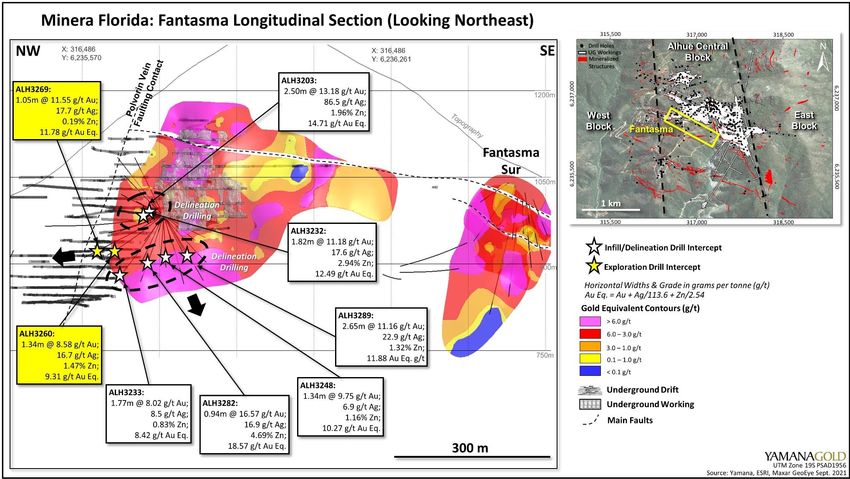
s
ESG PERFORMANCE
OVERVIEW(1)
Health and
Safety Governance Environment Social Tailings
Focus on leading Board oversight of All sites have Social License to Direct reporting on tailings
indicators ESG topics climate change, Operate Index management to CEO,
water and indicates solid trust Executive Chairman and
biodiversity risk and Board
assessments and acceptance from
action plans our host
communities
Top rated mining company by Corporate Knights 2021 ranking of Canada’s 50 best corporate citizens
Corporate ESG performance ranked in top 10% of peers by ISS (2019)
Included in Jantzi Social Index for 10 consecutive years
Best in class amongst peers in ESG scorecards of reporting investment banks
1. Material issues report does not include the Canadian Malartic mine which as a separate company, to which we maintain a 50% ownership in, Canadian Malartic prepares a standalone annual sustainability report, available at
www.canadianmalartic.com.
4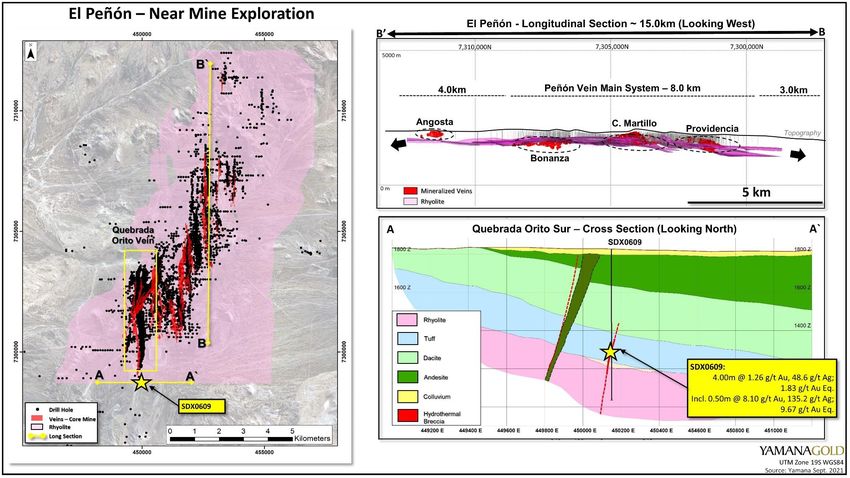
PORTFOLIO
OVERVIEW(1)
        We are a precious metals company primarily focused on gold but with exposure to
                              green metals from silver and copper

                                                                                                                                                                                                                    OPERATION
                                                                                                                                               NORTH    SOUTH                                                       DEVELOPMENT PROJECTS
                                                                                                                                               AMERICA AMERICA

                                                                                                                    Wasamac
                                                                                                                                                                                                                           Jacobina
                                                                                                                                 Odyssey (50%)

                                                                                           Canadian
                                                                                         Malartic (50%)
                                                                                                                                                                          El Peñón
                                                                                                                                                                                                               MARA (56.25%)

              13%                                                                                                                                                     Minera
                                                                                                                                                                      Florida

                 Revenue                                                                                                                                                                                    Suyai
                by Metal(1,2)
                                                                                                                                                                                                          Cerro Moro
                             87%
           Gold                  Silver

     Production Platform of 1M Gold Equivalent Ounces(3) at Low All-in Sustaining Costs(4)
1.   See Cautionary Note Regarding Forward-Looking Information.
2.   Based on 2021 production guidance and estimated run rate for revenue contribution by metal.
3.   Gold equivalent ounces (“GEO”) assumes gold plus silver at a ratio of 72.00:1 for 2021.                                                                                                                                          5
4.   A non-GAAP measure, additional line item or subtotal. Please refer to section 11 of the Company's second quarter Management's Discussion and Analysis and associated press release filed on SEDAR.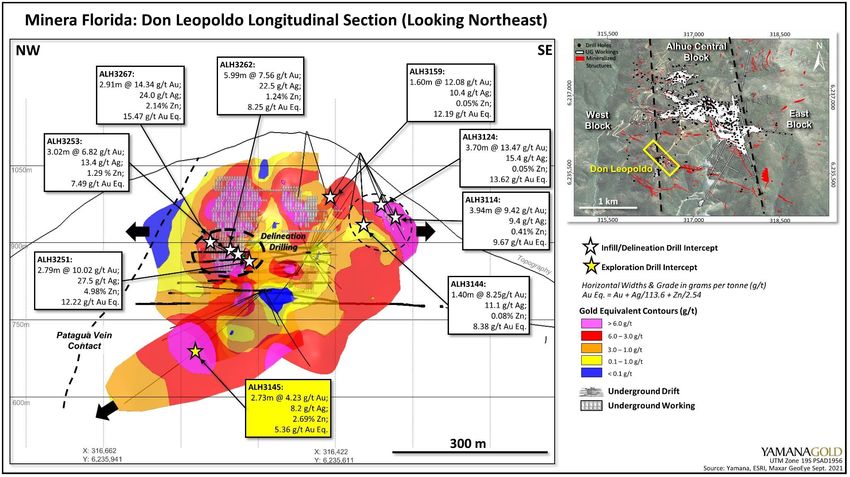
PRECIOUS METALS PORTFOLIO
COMPANY GUIDANCE(1)

                                                                             3-Year Production Guidance(3)
                                                                                   Mid-Point of Guidance Range +/- 3%

                                                                                                1M GEO                                               1M GEO                                               1M GEO
                                        901k GEO

                                            780k oz                                               862k oz                                              870k oz                                            889k oz

                                          10.4M oz                                             10.0M oz                                               9.4M oz                                             8.0M oz
                                                                                                (+/-) 3%                                             (+/-) 3%                                             (+/-) 3%
                                             2020A                                               2021                                                 2022                                                 2023

                                                                              2021 Cost Guidance, $/GEO
                                                                                                                                                                        1,020
                                                                                                  695                                                                     -
                                                                                                                                   1,080
                                                                                                   -                                                                     980
                                                              701                                 655
                                                             2020A                                 2021                             2020A                                 2021

                                                                      Cash Costs(2)                                                                   AISC(2)
1.   See Cautionary Note Regarding Forward-Looking Information.
2.   A non-GAAP measure, additional line item or subtotal. Please refer to section 11 of the Company's second quarter Management's Discussion and Analysis and associated press release filed on SEDAR.              6
3.   GEO assumes gold ounces plus the gold equivalent of silver ounces using a ratio of 88.86:1 for the full year 2020 and 72.00:1 for the periods 2021, 2022 and 2023.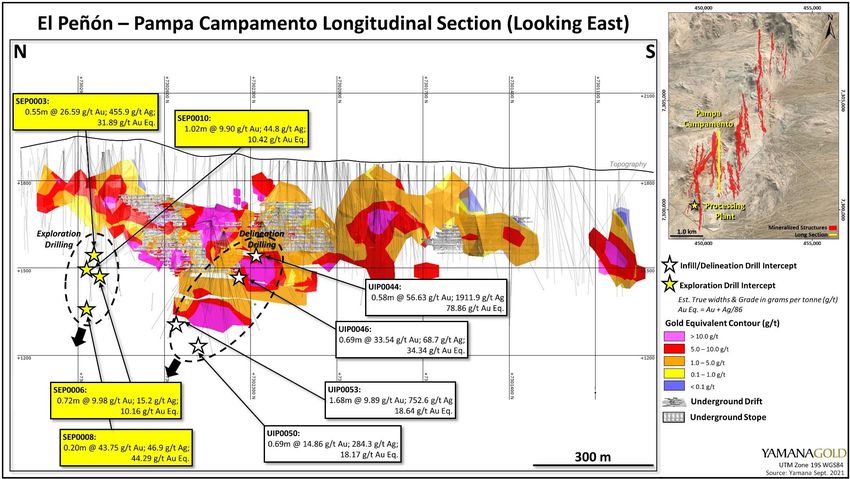
FINANCIAL FLEXIBILITY
TO REALIZE CAPITAL ALLOCATION OBJECTIVES(1)
Strong financial position, significant cash balances and increasing cash flows with
two capital allocation objectives
Strengthening Returns Low Capital Organic Growth
Maximizing returns through increasing dividends with a focus on Investing in targeted growth opportunities particularly at our current
sustainability through metal price volatility operations as well as exploration
Announced NCIB to purchase up to 5% of the current issued and
outstanding common shares
Annualized Dividend/Share Delivering Returns
$0.12
$0.08 Delivering
Low Capital
Returns on
Investment
Investment
$0.04
$0.00 Future Production
Q2 Q3 Q4 Q1 Q2 Q3 Q4 Q1 Q2 Q3 Growth
2019 2019 2019 2020 2020 2020 2020 2021 2021 2021
The current dividend a per ounce of production basis, represents
Expansionary capital for growth projects is on average $125M per year (3)
approximately $120 per GEO(2)
Dividends and organic growth are fully funded with cash on hand and free cash flow generation
1. See Cautionary Note Regarding Forward-Looking Information
2. Gold equivalent ounces (“GEO”) assumes gold plus silver at a ratio of 72.00:1 for 2021. 7
3. Includes forecasted expansionary capital from 2022 to 2028 for growth projects: Wasamac, Jacobina Phase 2 and the expansionary capital net of positive cash flow from production during development of the Odyssey underground project.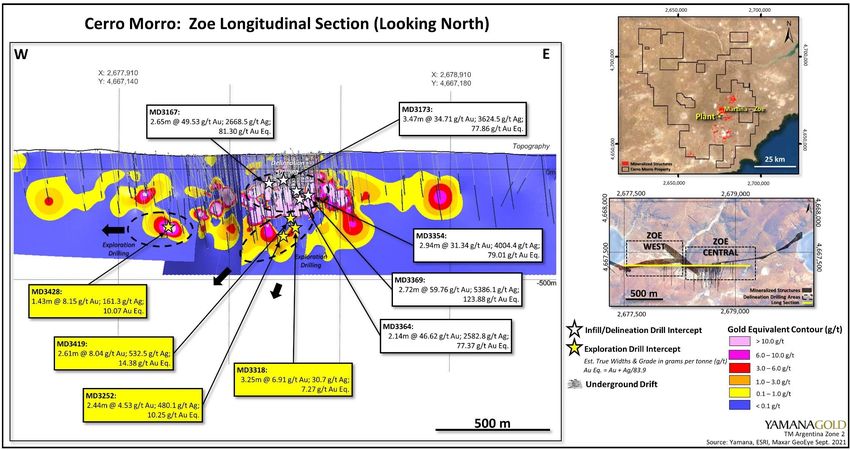
LOW CAPITAL ORGANIC GROWTH AND REINVESTMENT
APPROACH TO PURSUING GROWTH(1)
Growth Approach to Growth
Growth is focused on opportunities within the
Growth is Organically
existing portfolio including growth at current
Focused operations and growth from attractive high return
projects
Increases in mineral resources
Growth is Defined by a Increases to production and mine life
Number of Measures
Increases to financial measures including EBITDA,
cash flows and free cash flows(2)
Growth objectives are fully funded with existing
Growth is Fully Funded cash on hand and future cash flow generation
1. See Cautionary Note Regarding Forward-Looking Information. 8
2. A non-GAAP measure, additional line item or subtotal. Please refer to section 11 of the Company's second quarter Management's Discussion and Analysis and associated press release filed on SEDAR.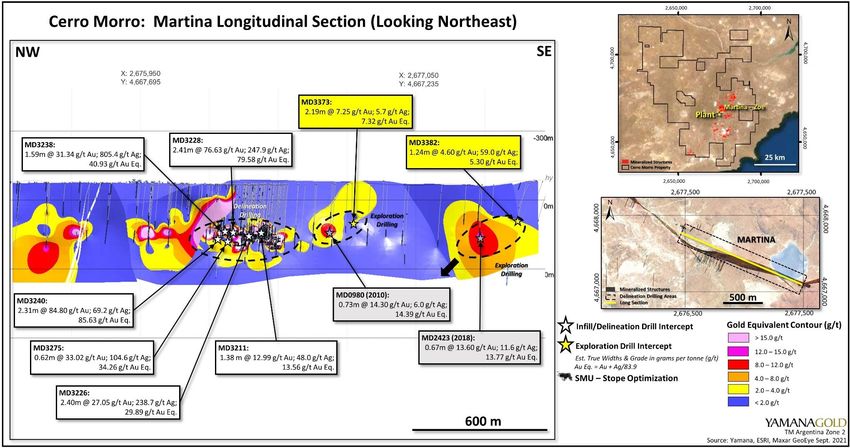
LOW CAPITAL ORGANIC GROWTH AND REINVESTMENT
GROWTH WITHIN EXISTING ASSET PORTFOLIO(1)
Growth Building a Portfolio of Generational Assets
Growth at Existing Operations Advancing Projects Generative Exploration Program
Jacobina Phased Expansion Ownership in advanced Seven identified
projects with attractive opportunities
Canadian Malartic - Odyssey returns
Underground Project Objective to increase at least
Wasamac one resource base to 1.5M
El Peñón Exploration and Plant ounces upon which to build a
Capacity MARA mine plan for the next mine
in the portfolio
Minera Florida Exploration and Suyai
Plant Capacity
Cerro Moro Exploration
1. See Cautionary Note Regarding Forward-Looking Information. 9
STRATEGIC 10-YEAR PRODUCTION OVERVIEW
OUTLOOK(1)

                                  Sustainable Production Platform of 1M Gold Equivalent Ounces
                                                with Further Upside Potential(2,3,4)
                                                                                                                                                               Development
                                                                                                                                                                  Project
     1 Moz GEO                                                                                                                                                   Wasamac

                                                                                                                                                               Exploration

                                                                                                                                                       The Company is not
                                                                                                                                                          dependent on
                                                                                                                                                           exploration
                                                                                                                                                          discoveries to
                                                                                                                                                       maintain its baseline
                                                                                                                                                        production level

         2020              2021             2022              2023             2024              2025           2026    2027     2028   2029   2030
        Actual                          Guidance                                                                       Outlook

                             10-year visibility at 1 M GEO(3)                                                            Addition of Wasamac from 2026 to ensure
                                from current operations                                                                 sustainability and provide production upside

                                                     Wasamac is based on the 2021 accelerated production profile
1.   See Cautionary Note Regarding Forward-Looking Information.
2.   Production guidance for the period 2021 – 2023 reflects the mid-point of the production range of +/- 3%.                                                           10
3.   Production from 2024 – 2030 is illustrative production profile.
4.   Gold equivalent ounces (“GEO”) assumes gold plus silver at a ratio of 72.00:1
CANADIAN MALARTIC
A GENERATIONAL ASSET(1)
CANADIAN MALARTIC MINE AND THE ODYSSEY PROJECT CANADA
50% Yamana Owned
Open Pit Mine and Underground Development Project
Overview(2)
Canada’s largest gold mine with annual production of 700,000 ounces (100% basis) from the open pit
AISC(3) are well below the Company and industry averages
The Odyssey underground project has modest capital requirements in any given year
Significance
Production from the underground the during construction period makes Odyssey mostly self-funding
Odyssey is expected to produce between 500,000 – 600,000 ounces per year (100% basis) with exploration potential and
future plant capacity providing additional upside potential
A generational asset where we can demonstrate at least several decades of mine life in a premier mining jurisdiction
1. See Cautionary Note Regarding Forward-Looking Information and Company press releases dated September 9, 2019 regarding Canadian Malartic.
2. Production Platform is estimated future production, for 2021 – 2023 production guidance ranges by mine please see the press release ‘Yamana Gold Reports Strong Fourth Quarter and Full Year 2020 Results’ dated February 11, 2021. 11
3. A non-GAAP measure, additional line item or subtotal. Please refer to section 11 of the Company's second quarter Management's Discussion and Analysis and associated press release filed on SEDAR.JACOBINA
A DERISKED PHASED EXPANSION FOR GROWTH
JACOBINA BRAZIL
100% Yamana Owned
Complex of Underground Mines
Overview(2)
Production platform of 230,000 ounces with the potential to increase to 270,000 ounces with the Phase 3 expansion
AISC(4) are well below the Company and industry averages
Significance
As the Company’s lowest cost mine, further production growth is contributing higher margin ounces
Exceptional geological endowment underpinned by exploration discoveries support Jacobina as a generational asset
where we can demonstrate several decades of mine life(3)
1. See Cautionary Note Regarding Forward-Looking Information
2. Production Platform is estimated future production, for 2021 – 2023 production guidance ranges by mine please see the press release ‘Yamana Gold Reports Strong Fourth Quarter and Full Year 2020 Results’ dated February 11, 2021. 12
3. See press release “Yamana Gold Reports Significant Progress on Phase 2 Expansion at Jacobina and Strong Exploration Results for the Operation” dated July 29,2021.
4. A non-GAAP measure, additional line item or subtotal. Please refer to section 11 of the Company's second quarter Management's Discussion and Analysis and associated press release filed on SEDAR.EL PEÑÓN
TRACK RECORD OF MINERAL RESERVE REPLACEMENT(1)
EL PEÑÓN CHILE
100% Yamana Owned
Underground Gold and Silver Mine
Overview(2)
Production platform of 220,000 GEO(4) with a strategic mine life of at least 10 years
AISC(3) are well below the Company and industry averages
Significance
Excess plant capacity provides flexibility and potential to increase annual production
Exploration discoveries and track record of mineral reserve replacement supports the strategic mine life
1. See Cautionary Note Regarding Forward-Looking Information.
2. Production platform is estimated future production. For 2021 – 2023 production guidance ranges by mine please see the press release ‘Yamana Gold Reports Strong Fourth Quarter and Full Year 2020 Results’ dated February 11, 2021.
3. A non-GAAP measure, additional line item or subtotal. Please refer to section 11 of the Company's second quarter Management's Discussion and Analysis and associated press release filed on SEDAR. 13
4. GEO assumes gold ounces plus the gold equivalent of silver ounces using a ratio of 72.00:1.MINERA FLORIDA
FUTURE PRODUCTION GROWTH POTENTIAL(1)
MINERA FLORIDA CHILE
100% Yamana Owned
Underground Mine
Overview(2)
Production platform of 90,000 ounces with potential to increase to 120,000 ounces with higher throughput
Plant de-bottlenecking study and preparation of the ESIA are advancing on schedule, with the objective to increase
throughput from 74,500 to 100,000 tonnes per month
Potential to significantly improve AISC(3) thereby meaningfully driving down the Company average
Significance
Continuation of recent exploration successes, ultimately leading to increasing mining flexibility and feeding the
additional mill capacity for increasing production and mine life
1. See Cautionary Note Regarding Forward-Looking Information. 14
2. Production Platform is estimated future production. For 2021 – 2023 production guidance ranges by mine see the press release ‘Yamana Gold Reports Strong Fourth Quarter and Full Year 2020 Results’ dated February 11, 2021.
3. A non-GAAP measure, additional line item or subtotal. Please refer to section 11 of the Company's second quarter Management's Discussion and Analysis and associated press release filed on SEDAR.CERRO MORO
HIGH-GRADE MINE WITH EXPLORATION UPSIDE(1)
CERRO MORO ARGENTINA
100% Yamana Owned
Open Pit and Underground Gold and Silver Mine
Overview(2)
High grade, low tonnage operation with base case production platform of 150,000 to 165,000 GEO(4) per year
Potential to significantly improve AISC(3) thereby meaningfully driving down the Company average
Significance
Upside production profile of >200,000 GEO(4) per year through exploration success and heap leach opportunity
Plant is scalable allowing for potential future expansion
Excellent exploration potential with large mine property and surrounding area, which together exceed 300,000
hectares
1. See Cautionary Note Regarding Forward-Looking Information.
2. Production Platform is estimated future production. For 2021 – 2023 production guidance ranges by mine please see the press release ‘Yamana Gold Reports Strong Fourth Quarter and Full Year 2020 Results’ dated February 11, 2021. 15
3. A non-GAAP measure, additional line item or subtotal. Please refer to section 11 of the Company's second quarter Management's Discussion and Analysis and associated press release filed on SEDAR.
4. GEO assumes gold ounces plus the gold equivalent of silver ounces using a ratio of 72.00:1.WASAMAC PROJECT
POSITIVE DEVELOPMENT DECISION(1)
WASAMAC CANADA
100% Yamana Owned
Underground Development Project
Project site 3D rendered image
Overview(2)
Underground development stage project with an annual production platform of 180,000 - 200,000 ounces
AISC(3) expected to be well below the Company and industry averages
Capital costs will not be spent until 2024, the Company will earmark funds beginning this year to ensure the project
is fully funded
Significance
Delivering significant growth and cash flows while improving the overall Company cost profile and contributing to an
expected 450,000 - 500,000 ounce production platform from the Abitibi region(2)
A strategic mine life of fifteen years with excellent exploration opportunities to become a generational asset
1. See Cautionary Note Regarding Forward-Looking Information
2. Production Platform for Wasamac is estimated production in 2028 following construction and ramp up, production platform for the Abitibi includes production from Wasamac, Canadian Malartic and the Odyssey 16
project. Please see the press release “Yamana Gold Announces Positive Development Decision on Its Wholly-Owned Wasamac Project” dated July 19, 2021.
3. A non-GAAP measure, additional line item or subtotal. Please refer to section 11 of the Company's second quarter Management's Discussion and Analysis and associated press release filed on SEDAR.ADVANCED PROJECTS
MARA AND SUYAI(1)
MARA
$3.00/lb Copper $4.00/lb Copper
100% basis $1,300/oz Gold(4) $1,700/oz Gold
NPV8% $1.91B >$4B
Robust Economics(5)
Key Project Information
Processing Capacity +115,000 tpd Mine Life 27 years
First 10 Years 556 Mlbs LOM Average 469 Mlbs
Average Production CuEq(2) Production CuEq(2)
AISC(3), First 10
$1.44/lb AISC(3), LOM $1.49/lb
Years
Large-scale copper, gold, silver, molybdenum deposit located in Catamarca, Argentina
In 2020, completed the formal integration of Agua Rica with Minera Alumbrera including its existing plant and
infrastructure, creating one of the most capital efficient copper projects in the world, with a de-risked profile, and
smaller environmental footprint
Ownership: Yamana Gold 56.25%, Glencore 25%, Newmont 18.75%
Advancing Feasibility Study (2022), ESIA and continuing to strengthen MARA’s social license
SUYAI
High grade gold-silver deposit located in Chubut Argentina, with +7 years of mine life and target production of +250,000
GEO(1)
1. See Cautionary Note Regarding Forward-Looking Information.
2. Copper equivalent metal includes copper with gold, molybdenum, and silver converted to copper-equivalent metal based on the following metal price assumptions: $6,614 per tonne of copper, $1,250 per ounce for gold, $24,250
per tonne for molybdenum, and $18.00 per ounce for silver
3. A non-GAAP measure, additional line item or subtotal. Please refer to section 11 of the Company's second quarter Management's Discussion and Analysis and associated press release filed on SEDAR. 17
4. Assuming metal prices of $3.00 per pound of copper, $1,300 per ounce of gold price, $18.00 per ounce of silver, $11.00 per pound of molybdenum.
5. From MARA PFS (B), please refer to the press release titled “Yamana Gold Reports Strong First Quarter 2021 Production Results and Cash Flows” dated April 28, 2021.STRATEGIC 10-YEAR PRODUCTION OVERVIEW
UPSIDE FROM EXISTING PORTFOLIO(1,2,3,4)
For representation purposes, 260M lbs of copper Plus average annual
would generate the equivalent revenue of over copper production of Represents copper
590,000 gold ounces, thereby placing the company 260M lbs production from
on a significant path for production growth and MARA (56.25%)
more than doubling our cash flows(5)
Other
200-300k GEO development
opportunities
including MARA,
Suyai, and the
Generative
Exploration
Program
Development Assets in the Portfolio Provide Opportunities for Production
Above the 10-Year Outlook and Cash Flow and Cash Generation Optionality
1. See Cautionary Note Regarding Forward-Looking Information.
2. Production guidance for the period 2021 – 2023 reflects the mid-point of the production range of +/- 3%.
3.
4.
Production from 2024 – 2030 is illustrative production profile.
Gold equivalent ounces (“GEO”) assumes gold plus silver at a ratio of 72.00:1.
18
5. Assuming approximate prices of $3.00/lb copper and $1,320/oz goldNEAR-TERM CATALYSTS
AND UPCOMING MILESTONES
Upcoming Near-Term Catalysts(1)
2021 - MARA key technical results
2021 – Cerro Moro heap leach results from metallurgical lab testing
2022 – Updated year end 2021 mineral reserves and mineral resources
2022 - MARA full feasibility study results and ESIA
1. Cautionary Note Regarding Forward-Looking Information. 19Focus on
investing in a gold company
with assets in mining tolerant
jurisdictions, a commitment to
high quality ESG management,
a strong balance sheet
and with capital allocation strategies
that continue to pay
increasing dividends 20APPENDIX
21CANADIAN MALARTIC
OVERVIEW(1)
CANADIAN MALARTIC CANADA
50% Yamana Owned Gold Open Pit
Open Pit Mine, Underground Development Project
Canada’s largest gold mine and Yamana’s
biggest producer
Mining is transitioning from the Canadian
Malartic pit to the Barnat pit, now in
commercial production
Underground – The Odyssey Project
Developing the underground in two phases,
initially with a ramp followed by a shaft
2020 2021 The underground has the potential to support
Production Guidance(1) annual gold production of 500,000 to 600,000
284,317 oz 340,000 - 361,000 oz ounces (100% basis). Further extension of the
mine life beyond 2039 provides additional
upside, with several opportunities under
2021 AISC(1,2) Guidance evaluation(1)
$850-885/oz
1. See Cautionary Note Regarding Forward-Looking Information. 22
2. A non-GAAP measure, additional line item or subtotal. Please refer to section 11 of the Company's second quarter Management's Discussion and Analysis and associated press release filed on SEDAR.ODYSSEY PROJECT
CONTINUED EXPLORATION SUCCESS(1)
Measured and Indicated Mineral Inferred Mineral Resources
16,000
Resources 100% basis(2) 100% basis(2) 13,582
Measured and indicated mineral
2,000 12,000 9,596 resources and inferred mineral
Gold Ounces in 000’s
6,418
1,500
8,000 2,738 resources have rapidly grown to
858 830 858
1,000 4,146 4,424 0.9M and 13.6M ounces of gold
5,192 5,338
500 722 694 736
4,000
1,428 2,470 2,806 respectively(1)(2)
0 18
136 136 122 1,428 1,676 1,618 1,666 1,826
0 0
2016 2017 2018 2019 2020 2016 2017 2018 2019 2020 The technical study
incorporates only ~50% of
mineral resources leaving
significant potential upside to
be captured via delineation
drilling and underground
development
During Q1 2021, a new intercept
opened the possibility for
significant expansion of the East
Gouldie zone to the east
Exploration update expected in
Q3 2021 to report on both the
infill and exploration drilling
results
1. See Cautionary Note Regarding Forward-Looking Information. 23
2. Indicated and Inferred Mineral Resources at 100% Basis. As of December 31, 2020, further details including tonnes, grade and assumptions are presented in the full mineral reserves and mineral resources estimates commencing on slide 32.ODYSSEY PROJECT
LONG-TERM GROWTH(1)
Underground production to offset a significant portion of the decline in open pit production
800,000 Open Pit 100% Basis 800,000 Open Pit Underground 100% Basis
600,000 600,000
400,000 400,000
200,000 200,000
ounces
ounces
0 0
2021 2022 2023 2024 2025 2026 2027 2028 2021 2022 2023 2024 2025 2026 2027 2028
Modest capital in any given year which is manageable
Expect 932k ounces (100% basis) of production and fully funded using Canadian Malartic’s cash on
during the 2021 to 2028 construction period with hand and free cash flow generation with no external
proceeds significantly reducing capital requirements funding required
$120
$100
Assuming the gold price used in the financial $80
analysis for the project of $1,550 per ounce, the $60
projected capital cost would be reduced in half $40
Millions
$20
$0
From 2029 – 2039, average annual production from
2021 2022 2023 2024 2025 2026 2027 2028
the underground is expected to be ~545k ounces
Odyssey Initial Capital Expenditures and
(100% basis) Other Growth Capital Expenditures (50% Basis)
1. See Cautionary Note Regarding Forward-Looking Information. 24CANADIAN PRODUCTION PROFILE
UP TO 500,000 OUNCES PER YEAR(1)
Consolidated gold production from Quebec of 450,000 to 500,000 ounces
600
000’s of ounces
500
400
300
200
100
0
2021 2022 2023 2024 2025 2026 2027 2028 2029 2030 2031 2032 2033 2034 2035 2036 2037 2038 2039
Canadian Malartic Odyssey Wasamac
(50% basis) (50% basis)
Upside: 500,000 ounces gold production to 2040 and beyond
600 Bring forward Wasamac Exploration potential &
Production by 1 Year spare processing capacity
500
000’s of ounces
400
300
200
100
0
2021 2022 2023 2024 2025 2026 2027 2028 2029 2030 2031 2032 2033 2034 2035 2036 2037 2038 2039
Canadian Malartic Odyssey Wasamac Exploration
(50% basis) (50% basis)
1. See Cautionary Note Regarding Forward-Looking Information. 25CANADIAN MALARTIC EXPLORATION(1,2) 1. See Cautionary Note Regarding Forward-Looking Information. 26 2. See press release “Yamana Gold reports positive exploration results at its producing mines” dated September 7, 2021.
JACOBINA
OVERVIEW(1)
JACOBINA BRAZIL Phase 2 Expansion Update
100% Yamana Owned Gold Implementing a simplified approach of
Complex of Underground Mines debottlenecking and incremental operational
improvements to achieve the Phase 2 rate of
8,500 tpd without requiring an additional ball mill
Capital costs are expected to be a fraction of the
original planned capital estimated and not
exceeding $15M to $20M
Expect to begin processing at 8,500 tpd by H2
2023, subject to permitting timelines
Recent exploration discoveries support the
strategic mine life of several decades at a
production level in excess of the Phase 2 annual
production of 230,000 ounces
2020 2021
Production Guidance(1) Phase 3 Expansion
177,830 oz 170,000 - 180,000 oz
Engineering for the Phase 3 expansion to 10,000
tpd will advance in parallel, with the plant
2021 AISC(1,2) Guidance
modification originally planned for Phase 2 now
$735 - 765/oz considered adequate for Phase 3. A feasibility
study is scheduled for completion in 2023 and
project commissioning still on track for 2027
1. See Cautionary Note Regarding Forward-Looking Information.
2. A non-GAAP measure, additional line item or subtotal. Please refer to section 11 of the Company's second quarter Management's Discussion and Analysis and associated press release filed on SEDAR. 27
3. See Company press release dated July 29, 2021 including Information on the Jacobina Phase 2 expansion.JACOBINA
EXPLORATION(1,2)
Jacobina Location Map Showing Main Target Areas and Mining Sectors
1. See Cautionary Note Regarding Forward-Looking Information. 28
2. See press release “Yamana Gold Reports Significant Progress on Phase 2 Expansion at Jacobina and Strong Exploration Results for the Operation” dated July 29,2021.JACOBINA EXPLORATION(1,2) 1. See Cautionary Note Regarding Forward-Looking Information. 29 2. See press release “Yamana Gold Reports Significant Progress on Phase 2 Expansion at Jacobina and Strong Exploration Results for the Operation” dated July 29,2021.
JACOBINA
EXPLORATION(1,2)

1.   See Cautionary Note Regarding Forward-Looking Information.                                                                                                           30
2.   See press release “Yamana Gold Reports Significant Progress on Phase 2 Expansion at Jacobina and Strong Exploration Results for the Operation” dated July 29,2021.
JACOBINA
EXPLORATION(1,2)

1.   See Cautionary Note Regarding Forward-Looking Information.                                                                                                           31
2.   See press release “Yamana Gold Reports Significant Progress on Phase 2 Expansion at Jacobina and Strong Exploration Results for the Operation” dated July 29,2021.
EL PEÑÓN
OVERVIEW(1)
EL PEÑÓN CHILE Mineral Reserve Replacement:
100% Yamana Owned Gold and Silver Track record of ongoing discoveries and
Underground Mine extensions of veins to maintain a mine life
visibility of 10+ years
Since year end 2017, gold mineral reserves
increased from 764,000 ounces to 921,000
ounces. Silver mineral reserves increased from
23.6M ounces to 29.2M ounces
Production Growth Through Plant Capacity and
Exploration Potential:
2020 2021
Production Guidance(1) Consistent production since right-sizing in
2017, with incremental improvements in cost
216,749 GEO(3) 215,000 - 229,000 GEO(3)
The processing plant has a capacity of
2021 AISC(1,2) Guidance approximately 4,200 tpd, representing an
$835 - 870/GEO(3) upside of 20-30% above guidance providing the
flexibility to increase production with
supplemental ore sources
1. See Cautionary Note Regarding Forward-Looking Information.
2. A non-GAAP measure, additional line item or subtotal. Please refer to section 11 of the Company's second quarter Management's Discussion and Analysis and associated press release filed on SEDAR. 32
3. Gold equivalent ounces (“GEO”) includes gold plus silver at a ratio of 88.86:1 for 2020 and assumes 72:1 for 2021.EL PEÑÓN
EXPLORATION(1,2)
El Peñón District Plan Map, North-South Mine-Scale Long Section and Local Cross Section as Context to Exploration Drill Hole
SDX0609, Initial Test of Deep Rhyolite Host – Quebrada Orito South Vein Projection Drill Target
1. See Cautionary Note Regarding Forward-Looking Information. 33
2. See press release “Yamana Gold reports positive exploration results at its producing mines” dated September 7, 2021.EL PEÑÓN EXPLORATION(1,2) 1. See Cautionary Note Regarding Forward-Looking Information. 34 2. See press release “Yamana Gold reports positive exploration results at its producing mines” dated September 7, 2021.
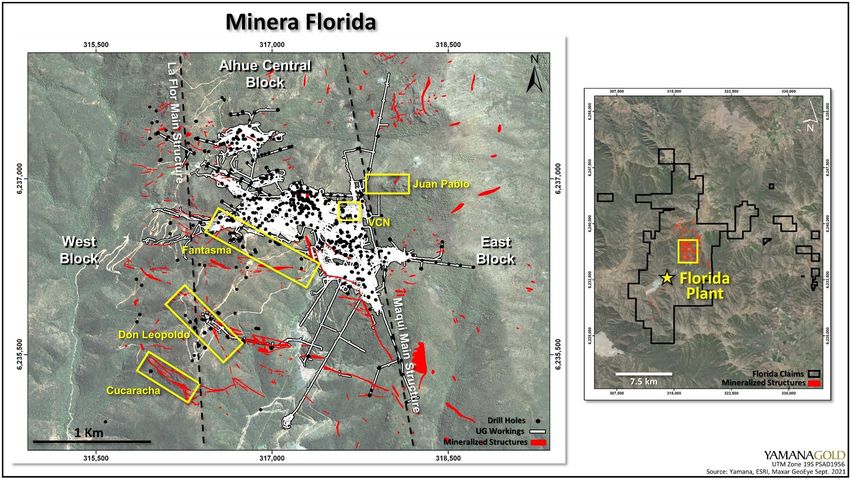
MINERA FLORIDA
OVERVIEW(1)
MINERA FLORIDA CHILE Mineral Reserve Replacement:
100% Yamana Owned Gold
Underground Mine Zinc and Silver Credits 180+ veins identified over exploration
concessions of 18,310 hectares, with a track
record of ongoing mineral reserves
replacement
Potential for Future Production Growth:
Minera Florida turned a corner in 2020,
achieving the highest run of mine gold
production since 2010
Excess processing capacity combined with
development of new mining sectors presents
production upside while exploration success
continues to extend mine life(1)
Plant de-bottlenecking study and preparation
of the ESIA are advancing on schedule, with
2020 2021 the objective to increase throughput from
Production Guidance(1) 74,500 to 100,000 tonnes per month
89,843 oz 84,000 - 90,000 oz
Production platform of 90,000 ounces has the
potential to increase to 120,000 ounces with
2021 AISC(1,2) Guidance
higher throughput
$1,065 – 1,105/oz
1. See Cautionary Note Regarding Forward-Looking Information. 35
2. A non-GAAP measure, additional line item or subtotal. Please refer to section 11 of the Company's second quarter Management's Discussion and Analysis and associated press release filed on SEDAR.MINERA FLORIDA
EXPLORATION(1,2)
Minera Florida Location Map Showing Main Target Areas, Principle Vein Systems, and Underground Workings
1. See Cautionary Note Regarding Forward-Looking Information. 36
2. See press release “Yamana Gold reports positive exploration results at its producing mines” dated September 7, 2021.MINERA FLORIDA EXPLORATION(1,2) 1. See Cautionary Note Regarding Forward-Looking Information. 37 2. See press release “Yamana Gold reports positive exploration results at its producing mines” dated September 7, 2021.
MINERA FLORIDA
EXPLORATION(1,2)

1.   See Cautionary Note Regarding Forward-Looking Information.                                                             38
2.   See press release “Yamana Gold reports positive exploration results at its producing mines” dated September 7, 2021.
CERRO MORO
OVERVIEW(1)
CERRO MORO ARGENTINA Existing Processing Plant (Base Case)
100% Yamana Owned Gold and Silver Maintain 150,000 to 165,000 GEO(3) per year until
Open Pit and Underground
2030
Mine life extension through exploration success
Heap Leach Opportunity
Assumes 3,000 tpd heap leach at estimated $45M
capex
Upside to >200,000 GEO(3) per year
Protects the downside of 165,000 GEO(3) per year
Other Opportunities
Parallel studies underway to enable economic
production from lower grade mineralization
Options include processing plant expansion, pre-
sorting, and installation of a new power line
Exploration Upside
2020 2021
Production Guidance(1) Excellent exploration potential with large mine
132,415 GEO(3) 161,000 - 171,000 GEO(3) property and surrounding area, which together
exceed 300,000 hectares. Still early into the
2021 AISC(1,2) Guidance exploration program, it has the largest budget to
$1,175 – 1,225/GEO(3) quickly advance(1)
1. See Cautionary Note Regarding Forward-Looking Information.
2. A non-GAAP measure, additional line item or subtotal. Please refer to section 11 of the Company's second quarter Management's Discussion and Analysis and associated press release filed on SEDAR. 39
3. Gold equivalent ounces (“GEO”) includes gold plus silver at a ratio of 88.86:1 for 2020 and assumes 72:1 for 2021.CERRO MORO
EXPLORATION(1,2)
Cerro Moro Core Mine Location Map Showing Main Near Mine Target Areas and Principle Vein Systems Along the Escondida-
Zoe Trend, and Location of Cassius Target to South
1. See Cautionary Note Regarding Forward-Looking Information. 40
2. See press release “Yamana Gold reports positive exploration results at its producing mines” dated September 7, 2021.CERRO MORO EXPLORATION(1,2) 1. See Cautionary Note Regarding Forward-Looking Information. 41 2. See press release “Yamana Gold reports positive exploration results at its producing mines” dated September 7, 2021.
CERRO MORO
EXPLORATION(1,2)

1.   See Cautionary Note Regarding Forward-Looking Information.                                                             42
2.   See press release “Yamana Gold reports positive exploration results at its producing mines” dated September 7, 2021.
CERRO MORO
EXPLORATION(1,2)

1.   See Cautionary Note Regarding Forward-Looking Information.                                                             43
2.   See press release “Yamana Gold reports positive exploration results at its producing mines” dated September 7, 2021.
WASAMAC PROJECT
OVERVIEW(1)
WASAMAC CANADA
Wasamac further solidifies the long-term growth
100% Yamana Owned Gold profile with a top-tier gold project in Quebec’s
Underground Development Project Abitibi region where Yamana has deep
operational, technical expertise and experience
Plan for rapid production ramp-up in first year
followed by sustained annual production of
~200,000 ounces for the following four years.
Average annual LOM gold production of 169,000
ounces
Average throughput of 7,000 tpd expected with
plant nameplate capacity of 7,500 tpd,
representing further upside
Strategic mine life of fifteen years or more Expect all permits and authorizations required for
project construction by Q3 2024
Development fully funded with available cash and
Located 100 Km from Canadian Malartic cash flows
LOM AISC and cash costs are well below the
Company average(1,3)
Proven and probable mineral reserves Expanded regional footprint with the Francoeur ,
increased 14% to 1.9 million ounces at Arntfield and Lac Fortune gold properties
2.56 g/t as of June 30, 2021(2) significantly adding to the exploration upside
1. See Cautionary Note Regarding Forward-Looking Information. 44
2. As of June 30, 2021 further details including tonnes, grade and assumptions are presented in the full mineral reserves and mineral resources estimates commencing on slide 32.
3. A non-GAAP measure, additional line item or subtotal. Please refer to section 11 of the Company's second quarter Management's Discussion and Analysis and associated press release filed on SEDAR.PROVEN AND PROBABLE MINERAL RESERVES
AS OF DECEMBER 31, 2020
45PROVEN AND PROBABLE MINERAL RESERVES
AS OF DECEMBER 31, 2020
46MEASURED, INDICATED AND INFERRED MINERAL RESOURCES
AS OF DECEMBER 31, 2020
47MEASURED, INDICATED AND INFERRED MINERAL RESOURCES
AS OF DECEMBER 31, 2020
4849
50
WASAMAC – JUNE 30, 2021 UPDATED
MINERAL RESERVES AND MINERAL RESOURCES

                                                        Wasamac Mineral Reserves, as of June 30, 2021
    Category                                             Tonnes (000)                           Gold Grade (g/t)                    Contained Gold Ounces (000)
    Probable                                                 23,168                                      2.56                                        1,910

                                 Wasamac Mineral Resources Exclusive of Mineral Reserves, as of June 30, 2021
    Category                                             Tonnes (000)                           Gold Grade (g/t)                     Contained Gold Ounces (000)

    Indicated                                                 5,769                                       1.76                                          326

    Inferred                                                  3,984                                       2.01                                          258

Notes to mineral reserves
1.     The qualified persons for the mineral reserve estimate are Mr. Denis Gourde, P.Eng. and Sébastien Tanguay, P.Eng. (InnovExplo).
2.     Mineral reserve estimate has an effective date of June 30, 2021.
3.     Estimated at US$1,250/oz Au using an exchange rate of US$1.32:C$1.00, variable cut-off Au value from 1.45 g/t to 1.68 g/t. Metallurgical recoveries and other parameters
       for the July 2021 MRE are shown in Chapter 6 of the UFS.
4.     Mineral reserve tonnage and mined metal have been rounded to reflect the accuracy of the estimate and numbers may not add due to rounding.
5.     Mineral reserves presented include both internal and external dilution along with mining recovery. The external dilution is estimated to be 11%. The average mining
       recovery factor was set at 93.5% to account for mineralized material left in the margins of the deposit in each block.
Notes to mineral resources
1.     The qualified persons for the current mineral resource estimates are Mr. Vincent Nadeau-Benoit, P.Geo. and Alain Carrier, M.Sc., P.Geo. (InnovExplo). Mineral resources
       have been estimated by Yamana and independently audited and validated by InnovExplo. The mineral resource estimate follows 2019 CIM definitions and guidelines for
       mineral resources and are reported exclusive of mineral reserves.
2.     Mineral resources were evaluated using the ordinary kriging weighting algorithm informed by capped composites and constrained by three-dimensional mineralization
       wireframes. Mineral resource categories were assigned using clipping boundaries. Indicated category was established for blocks interpolated during the first two passes
       within 40 m closest distance from an historical channel samples within the same mineralized zone. Inferred category was established for the remaining interpolated blocks
       inside the mineralization wireframes. A bulk density of 2.80 g/cm3 was used to convert volume to tonnage.
3.     Cut-off grades, which corresponds to 75% of the cut-off grades used to estimate the mineral reserves, are variable based on the metallurgical recoveries ranging from 1.10
       to 1.30 g/t Au.
4.     Mineral resources are below a 32 m surface crown pillar and outside a 5 m minimum buffer around historical underground infrastructures and constrained by potentially
       mineable shapes based on a minimum mining width of 2 m and considering internal waste and dilution.
5.     All figures are rounded to reflect the relative accuracy of the estimate. Numbers may not add up due to rounding.                                                          51
JOÃO BELO SUL – JUNE 30, 2021 UPDATED
MINERAL RESOURCES
João Belo Sul Mineral Resources, as of June 30, 2021
Category Tonnes (000) Gold Grade (g/t) Contained Gold Ounces (000)
Inferred 8,738 1.91 536
Notes to mineral resources
1. The Qualified Persons for the mineral resource estimates are Dr. Jean-Francois Ravenelle, P.Geo. and Dominic Chartier, P.Geo., both full time employees of Yamana Gold
Inc. The mineral resource estimate follows 2019 CIM definitions and guidelines for mineral resources.
2. The effective date for the mineral resource estimate is June 30, 2021.
3. Mineral resources were evaluated using the ordinary kriging weighting algorithm informed by capped composites and constrained by three-dimensional mineralization
wireframes.
4. A bulk density varying from 2.63 to 2.64 g/cm3 was used to convert volume to tonnage.
5. Mineral resources are constrained by potentially mineable shapes based on a minimum mining width of 1.5 m and considering internal waste and dilution. Underground cut-
off grade of 1.00 g/t gold, which corresponds to 75% of the cut-off used to estimate the mineral reserves at the Jacobina Mine that considers a gold price of $1,250/oz and
a metallurgical recovery of 96.5%.
6. Mineral resources are not mineral reserves and do not have demonstrated economic viability.
7. All figures are rounded to reflect the relative accuracy of the estimate. Numbers may not add up due to rounding.
52Corporate Summary
Investor Relations
200 Bay Street, Suite 2200
Toronto, Ontario
M5J 2J3
416-815-0220/1-888-809-0925
investor@yamana.com
NYSE: AUY | TSX: YRI | LSE: AUY www.yamana.com
53You can also read