COVID-19 ON SOCIAL MEDIA: ANALYZING MISINFORMATION
←
→
Page content transcription
If your browser does not render page correctly, please read the page content below
COVID-19 ON S OCIAL M EDIA : A NALYZING M ISINFORMATION
                                                     IN T WITTER C ONVERSATIONS

                                                                                             A P REPRINT

                                                      Karishma Sharma, Sungyong Seo, Chuizheng Meng, Sirisha Rambhatla, Yan Liu
                                                                           Department of Computer Science
                                                                           University of Southern California
arXiv:2003.12309v3 [cs.SI] 8 May 2020

                                                                                 Los Angeles, USA.
                                                            {krsharma,sungyons,chuizhem,sirishar,yanliu.cs}@usc.edu

                                                                                             May 12, 2020

                                                                                            A BSTRACT
                                                 The ongoing Coronavirus Disease (COVID-19) pandemic highlights the interconnected-ness of
                                                 our present-day globalized world. With social distancing policies in place, virtual communication
                                                 has become an important source of (mis)information. As increasing number of people rely on
                                                 social media platforms for news, identifying misinformation has emerged as a critical task in these
                                                 unprecedented times. In addition to being malicious, the spread of such information poses a serious
                                                 public health risk. To this end, we design a dashboard to track misinformation on popular social
                                                 media news sharing platform – Twitter. The dashboard provides visibility into the social media
                                                 discussions around Coronavirus and the quality of information shared on the platform, updated over
                                                 time. We collect streaming data using the Twitter API from March 1, 2020 to date and identify false,
                                                 misleading and clickbait contents from collected Tweets. We provide analysis of user accounts
                                                 and misinformation spread across countries. In addition, we provide analysis of public sentiments
                                                 on intervention policies such as “SocialDistancing” and “WorkFromHome”, and we track topics,
                                                 and emerging hashtags and sentiments over countries. The dashboard maintains an evolving
                                                 list of misinformation cascades, sentiments and emerging trends over time, accessible online at
                                                 https://usc-melady.github.io/COVID-19-Tweet-Analysis.

                                                 Keywords. COVID-19, Misinformation, Fake News, Social Media

                                        1   Introduction
                                        As social media becomes the primary source of information for people around the world, it has become increasingly
                                        critical and challenging to curb misinformation. According to Pew Research report, social media outpaced print news
                                        paper in 2018 (Shearer, 2018 (accessed March 20, 2020, Mitchell, 2018), as the share of Americans who get their news
                                        online continues to increase (Geiger, 2019 (accessed March 20, 2020).
                                        The misinformation surrounding COVID-19 pandemic is especially damaging, since any mis-steps can pose a serious
                                        public health risk by leading to exponential spread of the disease and accidental death due to self-medication (Vigdor,
                                        2020 (accessed March 24, 2020). The risk of misinformation surrounding the pandemic has motivated the World Health
                                        Organization (WHO) to launch a “Mythbuster” page WHO (2020 (accessed March 20, 2020), however, these counter
                                        measures face challenges with the fast-paced evolution and spread of news on social media. As a result, it is extremely
                                        important to identify and potentially curb the spread of misinformation as close as possible to its point of origin.
                                        To this end, we present a dashboard to provide insights about the nature of information that is currently shared through
                                        social media regarding the COVID-19 pandemic. The dashboard provides an analysis of topics, sentiments, and trends,
                                        assessed from Twitter posts; along with identified false, misleading and clickbait information spreading on social media,
                                        related to COVID-19. Here, we focus our analysis on Twitter since it has the highest number of news focused users
                                        (Hughes and Wojcik, 2019 (accessed March 20, 2020) and provides access to public Tweets data.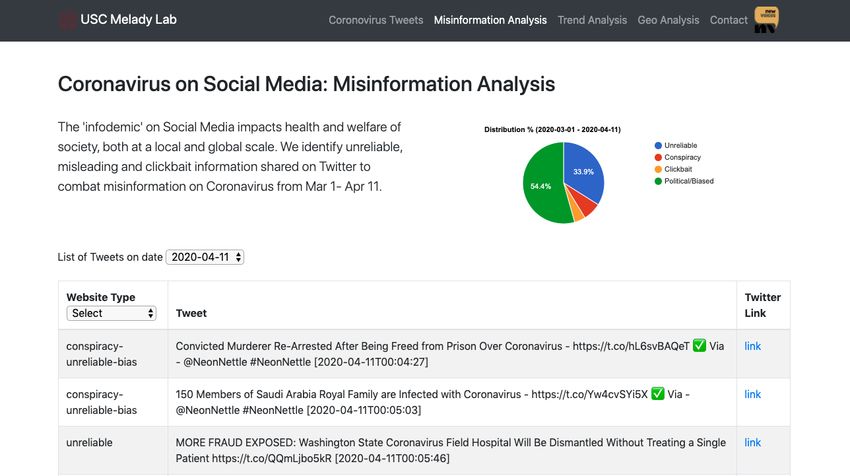
A PREPRINT - M AY 12, 2020

    (a) Sentiment and topic analysis of Twitter conversations.           (b) Misinformation analysis on Twitter
Figure 1: COVID-19 Social Media Analysis Dashboard analyzing sentiments, trends, and misinformation on Twitter.
Accessible online at https://usc-melady.github.io/COVID-19-Tweet-Analysis.

Social media plays a pivotal role in information dissemination and consumption during the pandemic (Godfrey, 2020
(accessed April 20, 2020). More so with increasing social distancing and growing reliance on online communication,
social media has both positive and negative social impacts during the crisis. For instance, safety tips such as “wash your
hands" and “stay home" are shared widely to gain community support in fighting the COVID-19 pandemic (Godfrey,
2020 (accessed April 20, 2020). On the other hand, misinformation and hate speech are growing problems that can
adversely impact the safety of individuals and society. The indirect and direct impacts, such as instances of 5G towers
being burned down due to conspiracy theories linking them to Coronavirus (Parveen and Waterson, 2020 (accessed
April 17, 2020), make it imperative to address the problem of misinformation.
In this work, we attempt to analyze both the positive and negative aspects of social media during the pandemic, and
utilize computational techniques to process information shared on social media related to COVID-19. We collect Twitter
conversations from March 1, 2020 to date and provide analysis results on the dashboard. The purpose of the dashboard
is to provide transparency into Twitter conversations surrounding the pandemic, which is an important step towards
curbing misinformation and increasing awareness about the overall nature and quality of information being consumed.
Towards this end, we use topic modeling to identify prominent topics from social media posts on COVID-19. We also
extract emerging hashtags in each country over time, to understand the evolution of conversations as the pandemic
situation changes in a given region or in association to important events or occasions that are impacted by the pandemic.
In addition, we utilize social media posts to understand the sentiments over time in each country/region. We also
leverage sentiment analysis to estimate the public perception on Twitter towards policies related to “Social Distancing"
and “Work From Home".
Towards the goal of curbing misinformation, we extract information cascades on social media - that correspond to the
sharing of news articles through retweets/replies on Twitter, and identify misinformation cascades based on the source
information. In this work, we define misinformation to include four types of information namely, unreliable, conspiracy,
clickbait, and political/biased. Each of these types can have negative societal impact on public health, intervention
policies and elections. In addition, we analyze user accounts and activities to characterize the nature of spread on
misinformation on social media. The dashboard provides the list of misinformation cascades identified from March 1,
2020 to date and misinformation spread across countries for prominent cascades.
The research on misinformation analysis related to healthcare and pandemics is important and understudied. This work
on COVID-19 aims to provide new insights and analysis on social media and misinformation related to global crisis and
pandemics. In the following sections, we will discuss the data collection, analysis and results, and future work.

2    Data Collection

We collect social media posts on Twitter using the streaming API service starting from March 1, 2020 to date. We use
keywords related to COVID-19 to filter the Twitter stream and obtain relevant tweets about the pandemic. The dataset
from March 1, 2020 to March 30, 2020 contains 30.8M tweets from 182 countries. The subset of English tweets equals
20.5M. The data collection is ongoing and will be used to update the analysis on the dashboard.

                                                                 2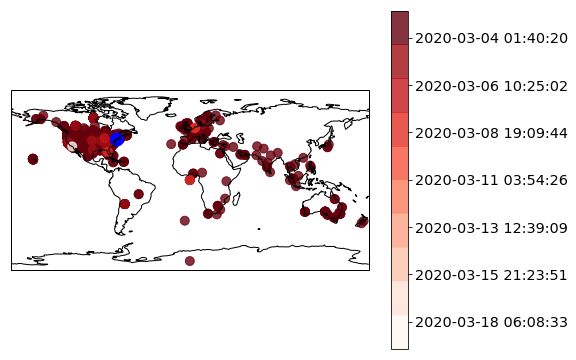
A PREPRINT - M AY 12, 2020

                     Keywords
                                                     March 1-30                              Count
                     Covid19
                                                     # Tweets                              30.80 M
                     coronavirus
                                                     % Tweets (In English Lang)             66.42%
                     corona virus
                                                     % Tweets (with Geo Information)        42.56%
                     2019nCoV
                                                     # User Accounts                        6.25 M
                     CoronavirusOutbreak
                                                     % Verified User Accounts                3.79%
                     coronapocalypse
                       Table 1: Statistics of COVID-19 Tweets collected in March 1-30, 2020.

                         Top Countries        # Tweets            Top US States        # Tweets
                          United States      5,246,932               California        787,563
                         United Kingdom       769,856                New York          430,823
                               India          558,341                   Texas          373,999
                             Canada           320,327                  Florida         360,664
                             Nigeria          235,201              Pennsylvania        168,909
                            Australia         190,708            Dist. of Columbia     154,054
                          South Africa        101,092                 Georgia          152,490
                            Malaysia           81,758                  Illinois        152,453
                              Kenya            71,939                   Ohio           141,034
                             Pakistan          71,832                 Arizona          119,831
                              France           71,454                Michigan          115,303
                              Ireland          70,170               New Jersey         113,450
                            Indonesia          67,224                 Virginia         112,168
                           Hong Kong           55,477               Washington         106,883
                           Philippines         53,665             Massachusetts        100,907
                            Germany            43,831             North Carolina        91,171
                              Ghana            34,743                  Oregon           91,065
                           Singapore           27,699                Maryland           87,177
                               Japan           26,203                Tennessee          85,548
                               Spain           25,984                Colorado           68,956
    Table 2: Distribution of English Tweets across countries, and states in the United States in March 1-30, 2020.

Dataset statistics. Table 1 provides details about the tweets collected and the user accounts associated with the tweets.
The English Tweets are utilized for further analysis and therefore the table reports the details about what fraction of
English Tweets contains geolocation information, and count of unique user accounts associated with the tweets, as well
as the percentage of Twitter verified accounts among those user accounts.
Geolocation. We obtain geolocation information at the country-level based on Dredze et al. (2013). The extracted
geolocation based on Dredze et al. (2013) is not always available. The information is available if the user has geo-enabled
feature on Twitter, or if the user mentions a valid location in his public profile. Based on the extracted geolocation
information, we provide the distribution of English Tweets among countries, and states in the United States in Table 2.

3   Misinformation Analysis
Misinformation forms an important aspect of our online world. Due to social distancing measures, the reliance on
information available online has become critical. To address this challenge, we identify misinformation and provide the
list of identified posts propagating such information on the dashboard. The task of distinguishing legitimate vs. false,
misleading and clickbait content is challenging from both, a human and machine perspective. In fact, this increases
the importance of eliminating such information from social media platforms, because the general public is easily
manipulated into believing false information, which in this case can be detrimental to public health and have dire
consequences (Vigdor, 2020 (accessed March 24, 2020, Parveen and Waterson, 2020 (accessed April 17, 2020).

                                                            3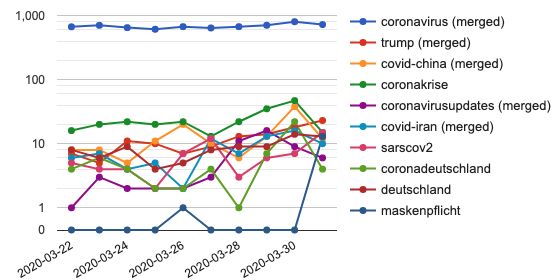
A PREPRINT - M AY 12, 2020

3.1        Identification of false and misleading content

Misinformation detection poses new challenges in the domain of healthcare and pandemics. There are numerous
existing datasets on misinformation (Sharma et al., 2019), labeled based on information collected from fact-checking
websites. The existing labeled datasets are either on general events reported during a period in time (Ma et al., 2016,
2018), or domain specific events, such as the Syrian civil war or hurricane Sandy (Salem et al., 2019, Gupta et al., 2013).
We focus on building a domain specific dataset on COVID-19 to provide real-time identification of misinformation on
the pandemic, and in the future, to improve research in misinformation analysis related to healthcare and pandemics.
Information Cascades. In order to identify misinformation, we first extract retweet/reply links between tweets using
the Twitter API. We found 19M edges i.e. retweet/reply links between the 20M English Tweets collected between
March 1-30, 2020. We cluster the retweet graph to identify source tweets propagating or being shared over the social
network. Of the 19M tweets, 2.17M are identified as source tweets and 172K have at least 10 retweets. Each source
tweet has associated tweet text and user account features, as well as the propagation related information available in
the form of retweets and reply tweets. The source tweet along with its propagation information is referred to as an
information cascade (Yang and Leskovec, 2010). In this work, we focus on identifying the list of misinformation
cascades from the collected dataset.
Detection. Misinformation is defined to incorporate false and misleading information of varying degrees of falsehood
(Sharma et al., 2019). Disinformation more specifically refers to false information with a deliberate intent, whereas
misinformation is defined to include false information which might not have a deliberate malicious intent. However,
varying degrees of falsehood and varying intents such as promotion of clickbait and political influence, make it important
to expose different kinds of malicious information. Therefore, we construct four categories of information which can
have negative societal impact, and use the term misinformation to broadly encompass the four categories.
Categorization. We categorize information into four types - unreliable, conspiracy, clickbait, and political/biased
using news sources compiled from fact-checking websites namely, Media Bias/Fact Check1 , and list of news websites
provided in Zimdars (2016). We define the categories as follows.

            • Unreliable. This category is defined to include false, questionable, rumorous and misleading news. In addition,
              we include satire, based on the consideration that satire has the potential to perpetuate misinformation (Zimdars,
              2016) or be used as a cover for misinformation publication (Sharma et al., 2019).
            • Conspiracy. This category is defined to include conspiracy theories and scientifically dubious news.
            • Clickbait. This category includes clickbait news i.e. exaggerated or misleading headlines and/or body purposed
              to attract attention, for reliable and/or unreliable information.
            • Political/Biased. This category includes political and biased news, written in support of a particular point of
              view or political orientation, for reliable and/or unreliable information such as propaganda.

Note that a tweet can belong to more than one of the above mentioned categories; as can multiple types be associated
with a news source. To label tweets, we identify source tweets that contain external links to news articles using tweet
metadata. Based on the news article links, we extract the news source (publisher) information. Similar to Qian et al.
(2018), we construct labels for each source tweet containing external links, based on the news source information.
Misinformation during pandemics can impact public health, intervention policies and future elections. Therefore, we
maintain separate categories of unreliable, conspiracy, clickbait, political/biased, and provide the list of source tweets
identified under each category on the dashboard. In the future, we will update our analysis to include detection based on
source and social context information extracted from the network.

3.2        User activities and coordination

The 6.25M user accounts engaging in Twitter conversations from March 1-30, 2020 in the collected dataset are studied
to provide information about the spread of COVID-19 related tweets. We extract user account features using the Twitter
API. The account creation date provides important information about the engagement of users on the social network.
Discussion. In Figure 2, the distribution of user accounts with respect to the account creation date is visualized. The
user accounts engaging in COVID-19 tweets include accounts created between 2006 to 2020, i.e. from when the
Twitter platform was introduced, to date. The trend shows a spike/increase between December 2019 and March 2020.
The percentage of new user accounts created between November 2019 - March 2020 is 5.58% of all user accounts
engaging in collected COVID-19 tweets. While not all new user accounts created are necessarily malicious, the spike in
      1
          https://mediabiasfactcheck.com/

                                                                 4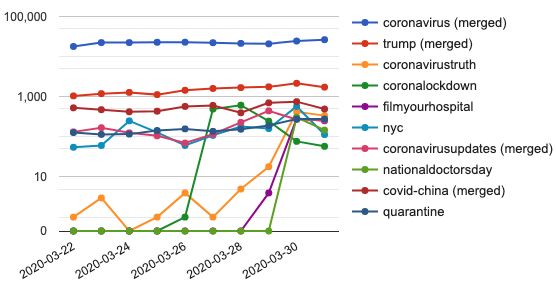
A PREPRINT - M AY 12, 2020
(a) Distribution of user accounts over 2006 - 2020. (b) Breakdown in months of 2019 - 2020.
Figure 2: User accounts tweeting about COVID-19 based on account creation date.
new accounts tweeting about COVID-19 provides information about the changing social network structure during the
pandemic. In the future, we will investigate the activity patterns of new user accounts to identify the role or function
they play in either dissemination of useful information about the pandemic, or towards misinformation propagation.
3.3 Misinformation spread across countries
The misinformation spread across countries for sample tweets identified from the collected dataset is shown in Figure 5.
The figure shows the information cascade corresponding to each source tweet. The points indicate the retweet or
replies of the source tweet over the time scale. Tweets containing geolocation information are visualized, based on
the extracted latitude and longitude information. The identified misinformation in the four categories - unreliable,
conspiracy, clickbait, and political/biased, were found to contain both healthcare and political misinformation. We
provide and discuss examples of source tweets and their propagation patterns across countries.
Discussion. In Fig. 3a, a false claim circulated about Nevada Governor’s Chief Medical Officer banning the use of
Hydroxychloroquine treatments was seen to circulate through social media. In this case, the observed geolocation of
source tweet is in the United States, the country with the highest Twitter usage, and it propagates to other countries
within minutes. In other cases, source tweets are also observed to originate from other countries and travel to United
States and other countries. For example, in Fig. 3b, for a false claim that the virus was found to transmit through toilet
paper, the source tweet geolocation was observed in Australia, with retweets traveling to several other countries.
In cases where the geolocation information of the source tweet is unobserved, the geolocation of other tweets in the
information cascade still provides estimates of the exposure and spread in different countries, of the misinformation
claims propagated through the source tweet. For instance, in Fig. 4a the spread of the conspiracy promoting that the
virus is a bioweapon is observed over multiple countries, whereas in Fig. 4b the spread of the claim that the pandemic is
less deadly than the flu is observed within the United States.
Misinformation of varying degree of falsehood and biased/clickbait news reporting can mislead and influence public
perception, especially with widespread propagation. We observe that the largest cascade in the collected dataset has
over 10, 000 retweets spanning multiple countries, shown in Fig 5a. It corresponds to a political clickbait news article
published on the discussion surrounding affordability and price control on vaccines being researched for the virus. We
also find other cases of political misinformation with false claims regarding political figures maliciously attempting to
worsen the crisis, as shown in Fig. 5b. As seen these cases of misinformation have the potential to harm public health
and effectiveness of health intervention policies.
4 Sentiment Analysis
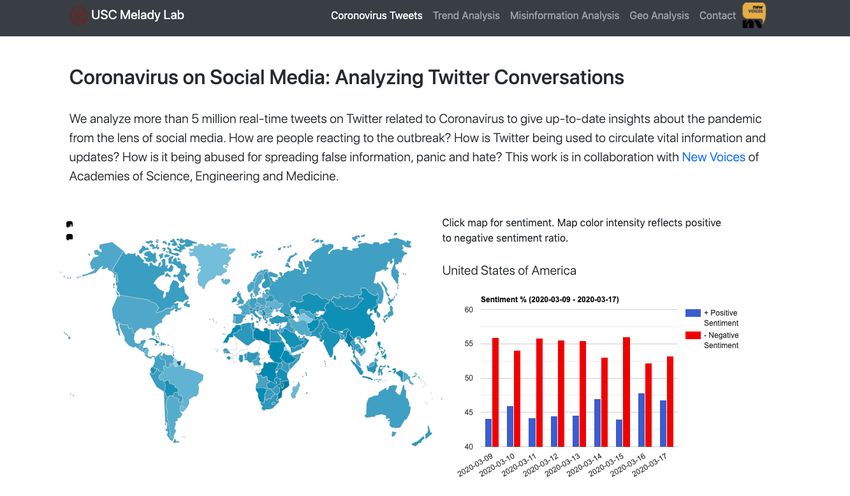
Country-wise sentiments. We analyze the evolving country-wise sentiments related to the COVID-19 pandemic. The
public perceptions constitute an important factor for gauging the reactions to policy decisions and preparedness efforts.
In addition, they also reflect the nature of news coverage and potential misinformation. We extract sentiments from
social media posts at the country-level and over time, to study the evolving public perceptions towards the pandemic.
Using lexical sentiment extraction based on (Hutto and Gilbert, 2014), we obtain the valence (positive or negative)
along with its intensity for each tweet based on its textual information. The sentiment is aggregated over tweets to
estimate the overall sentiment distribution. The distribution of sentiments was found to vary over time and country.
5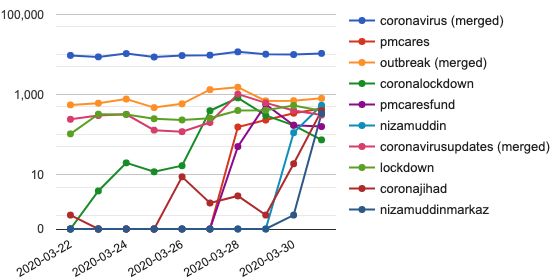
A PREPRINT - M AY 12, 2020

(a) Unreliable. “Nevada Governor Sisolak’s Chief Medical Officer
                                                                 (b) Unreliable. “Widespread panic hits as Corona Virus found to
Who Banned Hydroxychloroquine for Treating Coronavirus DOES
                                                                 transmit via toilet paper #toiletpapergate #coronavirus"
NOT Have License to Practice Medicine."
Figure 3: Misinformation spread across countries. (Left) Source tweet observed in United States (Right) Source tweet
observed outside of United States. Legend: Source tweet (Blue), Retweet/Replies (Red, intensity based on time scale).

                                                                    (b) Unreliable. “Numbers Show Coronavirus Appears Far Less
     (a) Conspiracy. “It is not the flu, it is a #bioweapon."
                                                                    Deadly Than Flu Media Keep Promoting Panic."
Figure 4: Misinformation spread across countries, examples with source tweet geolocation unavailable. (Left)
Retweets/Replies observed across countries (Right) Retweets/Replies observed within United States. Legend:
Retweet/Replies (Red, intensity based on time scale).

Social distancing/Work from home sentiments. In addition, we analyze the public perception of emerging policies
such as social distancing and remote work. These disease mitigation strategies also provide unprecedented glimpse
into the effect of remote work and isolation on mental health. Although the option to work remotely is limited to
the white collar workforce, nevertheless absence of child and dependent-care has emerged as an important challenge.
Furthermore, this forced remote work will impact workdays of white collar workers beyond the pandemic. In order
to understand public sentiment and opinion about different social issues, we extract hashtag information from the
collected tweets, and filter based on keywords “#workfromhome, #wfm, #workfromhome, #workingfromhome,
#wfhlife” and “#socialdistance, #socialdistancing”. The filtered tweets are analyzed to obtain positive and
negative sentiments and ranked and visualized based on valence and intensity. The analysis is shown in Fig. 6 for
sentiments on social distancing and on work from home policy interventions.

5   Topic and Trend Analysis
Topic clusters. We analyze Twitter conversations to identify topics and trends in the Twitter data on COVID-19. We
use topic modeling based on character embeddings (Joulin et al., 2016) extracted from social media posts Nguyen
et al. (2015), Li et al. (2016). We identified 20 different topics from the collected English tweets. We found that the
prominent topics of discussions during early March were centered around global outbreaks (Wuhan, Italy, Iran), travel

                                                                6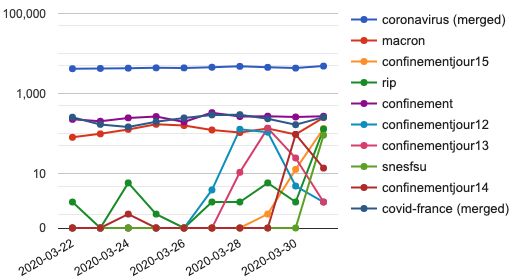
A PREPRINT - M AY 12, 2020

(a) Political-Clickbait. “GOP blocking coronavirus bill — be- (b) Unreliable. “An Obama Holdover in an Obscure Government
cause it limits how much drugmakers can charge for a vaccine." Arm Helped Cause the Country’s Coronavirus Crisis."
Figure 5: Misinformation spread across, political examples. (Left) Example with political-clickbait news (Right)
Example with unreliable news. Legend: Source tweet (Blue), Retweet/Replies (Red, intensity based on time scale).

   Figure 6: Twitter sentiments analysis related to intervention policies of SocialDistancing and WorkFromHome.

restrictions, prevention measures such as hand washing and masks, hoarding, symptoms and infections, immunization,
event cancellations, testing kits and centers, government response and emergency funding. The topic clusters along
with the most representative tweets in each cluster are provided on the dashboard. The representative tweets of each
cluster are obtained based on word similarity of the tweet to the tf-idf word distribution of the cluster. The label to each
cluster of tweets was assigned by manual inspection of the word distribution and representative tweets of the cluster.
Emerging trends. The emerging trend on Twitter highlight changes in perception or importance of topics as the
pandemic situation changes. We extract hashtags from the tweet text for all tweets in the dataset for March/2020. The

                                                             7
A PREPRINT - M AY 12, 2020
(a) United States, March 22-31. (b) France, March 22-31
Figure 7: Emerging hashtags for countries/regions for March 22-31, depicted for United states and France.
(a) Germany, March 22-31. (b) India, March 22-31
Figure 8: Emerging hashtags for countries/regions for March 22-31, depicted for Germany and India.
hashtags with emerging popularity are estimated based on fitted linear regression curves on the usage counts of hashtags
over the period. On the dashboard (Fig. 7, Fig. 8), we provide the Top-30 emerging hashtags to show trendy interest in
social media over the world. As the hashtags also reflect spatial characteristics (e.g., country-level policy or trend), the
Top-10 emerging hashtags of each country for last 10 days are also visualized on the dashboard and regularly updated.
The country/region-based emerging hashtags are particularly important to track people’s interest. For instance, the
line chart in Fig. 7 shows which hashtags emerged in terms of a slope of usage counts in the United States from
March/22 to March/31. While the use of some hashtags (e.g., #coronavirus and #trump) continuously dominates
the conversations, other hashtags (e.g., #coronalockdown, #coronavirustruth and #nationaldoctorsday) are
temporally significant. The end of March is when most of states announced lockdown on many business and a stay-
at-home order, and it causes people to use lockdown-related hashtags (#coronalockdown). Moreover, it shows that
people get more and more interested in facts on coronavirus. Finally, the slope-based extraction easily detects spike
pattern of some hashtags (#nationaldoctorsday), which are only used in a particular day.
In Germany (Fig. 7), we could detect that people are interested in wearing masks (#maskenpflicht, mask required)
from the end of March. In France (Fig. 8)have counted the containment day (#confinementjour) everyday and their
patterns show time lags as expected. Finally, the plot is also useful to see what trendy issues are (#coronajihad,
#nizamuddin) in India (Fig. 8).
Geoinformation trends. We also analyze the geographical distribution of daily counts of tweets and its trend using the
extracted geolocation information. The dashboard provides (1) the geographical distribution of the daily count of tweets
over countries/regions; (2) the daily increment of the count of tweets for each country/region; (3) the time for each
country/region when it encounters its peak of daily counts of tweets. (1) shows a steady distribution of daily counts
of tweets: users in United States contribute more than half of the total daily counts of tweets around the world, and
users in Europe, India, Oceania and South America are also active. (2) reveals that the daily counts of tweets of most
countries/regions are steady during the time of our observation. (3) illustrates the spatio-temporal pattern of which day
each country/region achieves it highest activity over the observation time period.
8A PREPRINT - M AY 12, 2020
6 Future Work
There are several critical directions of future work to address this large-scale “infodemic" surrounding COVID-19. The
proportion of Twitter users in the United states is higher than in other countries like China with alternate social media
platforms. Since the pandemic is at a global scale, social media analysis for other platforms and languages is critical
towards curbing misinformation. The second important factor is that the annotation for misinformation is a challenging
task and requires expert verification. Therefore, research in unsupervised or distant supervision are important towards
alternate forms of labeling, to improve classification and handle the imbalance in the distribution of misinformation vs.
legitimate information. We also plan to include social context information towards improving misinformation detection.
In addition, we plan to analyze sentiments about other emerging topics, and moreover to study the impact of public
perception as well as misinformation on policy interventions on curbing the pandemic.
References
Mark Dredze, Michael J Paul, Shane Bergsma, and Hieu Tran. Carmen: A twitter geolocation system with applications
to public health. In Workshops at the Twenty-Seventh AAAI Conference on Artificial Intelligence, 2013.
A. W. Geiger. Key findings about the online news landscape in America, 2019 (ac-
cessed March 20, 2020). URL https://www.pewresearch.org/fact-tank/2019/09/11/
key-findings-about-the-online-news-landscape-in-america/.
Logan Godfrey. Social Media’s Role in the Coronavirus Pandemic, 2020 (accessed
April 20, 2020). URL https://www.business2community.com/social-media/
social-medias-role-in-the-coronavirus-pandemic-02296280.
Aditi Gupta, Hemank Lamba, Ponnurangam Kumaraguru, and Anupam Joshi. Faking sandy: characterizing and
identifying fake images on twitter during hurricane sandy. In Proceedings of the 22nd international conference on
World Wide Web, pages 729–736. ACM, 2013.
Adam Hughes and Stefan Wojcik. 10 facts about Americans and Twitter, 2019 (accessed March 20, 2020). URL
https://www.pewresearch.org/fact-tank/2019/08/02/10-facts-about-americans-and-twitter/.
Clayton J Hutto and Eric Gilbert. Vader: A parsimonious rule-based model for sentiment analysis of social media text.
In Eighth international AAAI conference on weblogs and social media, 2014.
Armand Joulin, Edouard Grave, Piotr Bojanowski, Matthijs Douze, Hérve Jégou, and Tomas Mikolov. Fasttext.zip:
Compressing text classification models. arXiv preprint arXiv:1612.03651, 2016.
Chenliang Li, Haoran Wang, Zhiqian Zhang, Aixin Sun, and Zongyang Ma. Topic modeling for short texts with
auxiliary word embeddings. In Proceedings of the 39th International ACM SIGIR conference on Research and
Development in Information Retrieval, pages 165–174, 2016.
Jing Ma, Wei Gao, Prasenjit Mitra, Sejeong Kwon, Bernard J Jansen, Kam-Fai Wong, and Meeyoung Cha. Detecting
rumors from microblogs with recurrent neural networks. In IJCAI, pages 3818–3824, 2016.
Jing Ma, Wei Gao, and Kam-Fai Wong. Detect rumor and stance jointly by neural multi-task learning. In Companion
of the The Web Conference 2018 on The Web Conference 2018, pages 585–593. International World Wide Web
Conferences Steering Committee, 2018.
Amy Mitchell. Americans Still Prefer Watching to Reading the News - and Mostly
Still Through Television, 2018. URL https://www.journalism.org/2018/12/03/
americans-still-prefer-watching-to-reading-the-news-and-mostly-still-through-television/.
Dat Quoc Nguyen, Richard Billingsley, Lan Du, and Mark Johnson. Improving topic models with latent feature word
representations. Transactions of the Association for Computational Linguistics, 3:299–313, 2015.
N. Parveen and J. Waterson. UK phone masts attacked amid 5G-coronavirus conspiracy theory,
2020 (accessed April 17, 2020). URL https://www.theguardian.com/uk-news/2020/apr/04/
uk-phone-masts-attacked-amid-5g-coronavirus-conspiracy-theory.
Feng Qian, Chengyue Gong, Karishma Sharma, and Yan Liu. Neural user response generator: Fake news detection
with collective user intelligence. In IJCAI, volume 3834, page 3840, 2018.
Fatima K Abu Salem, Roaa Al Feel, Shady Elbassuoni, Mohamad Jaber, and May Farah. Fa-kes: a fake news dataset
around the syrian war. In Proceedings of the International AAAI Conference on Web and Social Media, volume 13,
pages 573–582, 2019.
Karishma Sharma, Feng Qian, He Jiang, Natali Ruchansky, Ming Zhang, and Yan Liu. Combating fake news: A survey
on identification and mitigation techniques. ACM Transcations on Intelligent Systems and TEchnology, 2019.
9A PREPRINT - M AY 12, 2020
Lisa Shearer. Social media outpaces print newspapers in the U.S. as a news source, 2018 (ac-
cessed March 20, 2020). URL https://www.pewresearch.org/fact-tank/2018/12/10/
social-media-outpaces-print-newspapers-in-the-u-s-as-a-news-source/.
N. Vigdor. Man Fatally Poisons Himself While Self-Medicating for Coronavirus, Doctor Says, 2020 (accessed March 24,
2020). URL https://www.nytimes.com/2020/03/24/us/chloroquine-poisoning-coronavirus.html.
WHO. Coronavirus disease (COVID-19) advice for the public: Myth busters, 2020 (accessed March 20, 2020).
URL https://www.who.int/emergencies/diseases/novel-coronavirus-2019/advice-for-public/
myth-busters.
Jaewon Yang and Jure Leskovec. Modeling information diffusion in implicit networks. In 2010 IEEE International
Conference on Data Mining, pages 599–608. IEEE, 2010.
Melissa Zimdars. False, misleading, clickbait-y, and satirical ‘news’ sources,
2016. URL https://21stcenturywire.com/wp-content/uploads/2017/02/
2017-DR-ZIMDARS-False-Misleading-Clickbait-y-and-Satirical-%E2%80%9CNews%E2%80%
9D-Sources-Google-Docs.pdf.
10You can also read