TSX: ANX OTCQX: ANXGF - Corporate Presentation - September 2021
←
→
Page content transcription
If your browser does not render page correctly, please read the page content below
Production   ·   Cash Flow   ·   Exploration   ·   Growth

TSX: ANX
OTCQX: ANXGF

A Growing Gold Producer
in Atlantic Canada

                                           Corporate Presentation - September 2021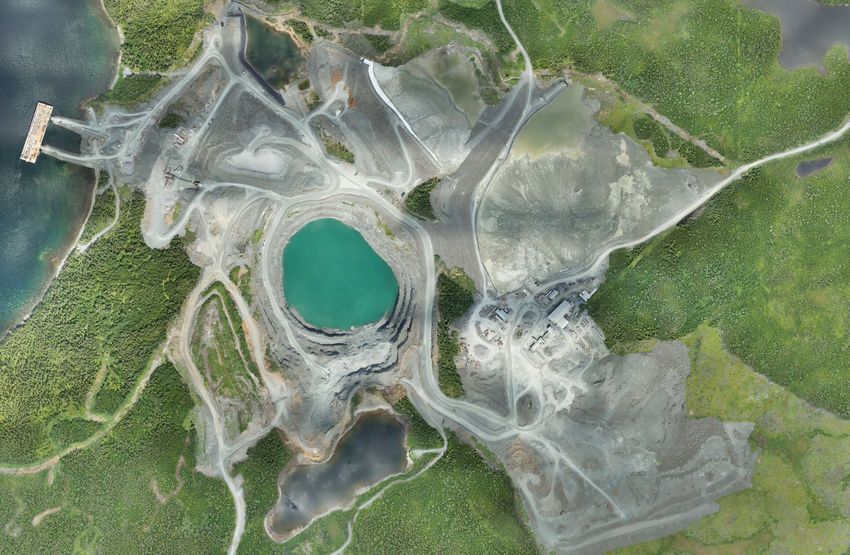
Cautionary Note Regarding Forward-Looking Information                                                                                                                     TSX:ANX

This presentation contains statements which constitute “forward-looking information” within the meaning of applicable securities laws, including statements regarding the plans, intentions,
beliefs and current expectations of Anaconda Mining Inc. with respect to future business activities and operating performance. Forward-looking information is often identified by the words
“may”, “would”, “could”, “should”, “will”, “intend”, “plan”, “anticipate”, “believe”, “estimate”, “expect” or similar expressions and include information regarding: (i) the amount of future
production over any period; (ii) assumptions relating to revenues, operating cash flow and other revenue metrics set out in the Company's disclosure materials; and (iii) future exploration
and development plans.
Investors are cautioned that forward-looking information is not based on historical facts but instead reflect management’s expectations, estimates or projections concerning future results
or events based on the opinions, assumptions and estimates of management considered reasonable at the date the statements are made. Although Anaconda Mining believes that the
expectations reflected in such forward-looking information are reasonable, such information involves risks and uncertainties, and undue reliance should not be placed on such information,
as unknown or unpredictable factors could have material adverse effects on future results, performance or achievements of the combined company. Among the key factors that could
cause actual results to differ materially from those projected in the forward looking information are the following: the requirement for additional funding for development and exploration;
the fluctuating price of gold; success of exploration, development and operations activities; health, safety and environmental risks and hazards; uncertainty in the estimation of mineral
reserves and mineral resources; replacement of depleted mineral reserves; the potential of production and cost overruns; obligations as a public company; risks relating to government and
taxation regulation; volatility in the market price of the Company’s securities; risks relating to title and First Nations; risks relating to the construction and development of new mines; risks
relating to the dependence of the Company on outside parties and key management personnel; and risks in the event of a potential conflict of interest.
This information is qualified in its entirety by cautionary statements and risk factor disclosure contained in filings made by Anaconda Mining Inc., including Anaconda Mining’s annual
information form, financial statements and related MD&A for the year ended December 31, 2020, all available at www.sedar.com. Should one or more of these risks or uncertainties
materialize, or should assumptions underlying the forward-looking information prove incorrect, actual results may vary materially from those described herein as intended, planned,
anticipated, believed, estimated or expected. Although the Company has attempted to identify important factors that could cause actual results to differ materially from those contained in
forward-looking information, there may be other factors that cause results not to be as anticipated, estimated or intended. Anaconda Mining does not intend, and does not assume any
obligation, to update this forward-looking information except as otherwise required by applicable law.
Cautionary Note
Cautionary statement NI 43-101: The PEA was prepared in accordance with NI 43-101. Readers are cautioned that the PEA is preliminary in nature. It includes inferred Mineral Resources
that are considered too speculative geologically to have the economic considerations applied to them that would enable them to be categorized as mineral reserves, and there is no
certainty that the PEA will be realized. Mineral Resources that are not mineral reserves do not have demonstrated economic viability.
Use of Non-IFRSMeasures
This Presentation may from time to time refer operating cash costs per ounce sold, all-in sustaining costs per ounce of gold sold, and earnings before income taxes, depreciation and
amortization (“EBITDA”), because certain readers may use this information to assess the Company’s performance and also to determine the Company’s ability to generate cash flow. This
data is furnished to provide additional information and are non-IFRS measures and do not have any standardized meaning prescribed by International Financial Reporting Standards
(“IFRS”). These measures should not be considered in isolation as a substitute for measures of performance prepared in accordance with IFRS and are not necessarily indicative of
operating costs presented under IFRS. Refer to the Company’s most recent MD&A for the definition and reconciliation of these measures.

All dollar amounts in this presentation are expressed in Canadian Dollars (C$) unless otherwise noted.

                                                                                                2
                                                                                                                                                                 From the ground up.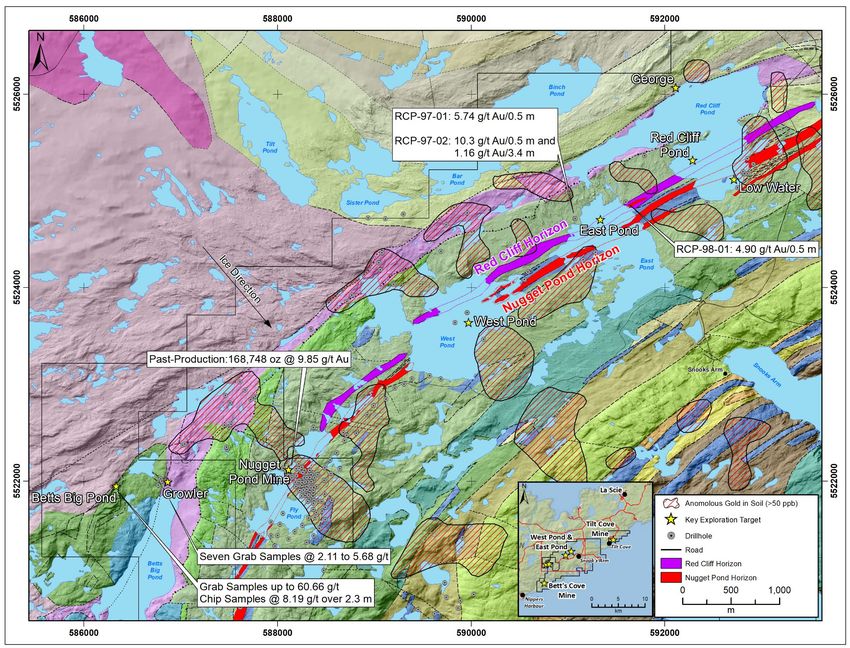
Overview of Anaconda Mining                                                                                                TSX:ANX

Established platform for growth, targeting 150,000 oz of gold production in 3-5 years
• Ten (10+) plus years of gold production in the top tier mining jurisdiction of Atlantic Canada

• Strong treasury, robust balance sheet and continued free cash flow generation

                                                                                                   Point Rousse Complex

                                                                                                   Goldboro
                                                                                                   Goldboro Gold
                                                                                                            Gold Project
                                                                                                                 Project
                                                                           3
                                                                                                                           From the ground up.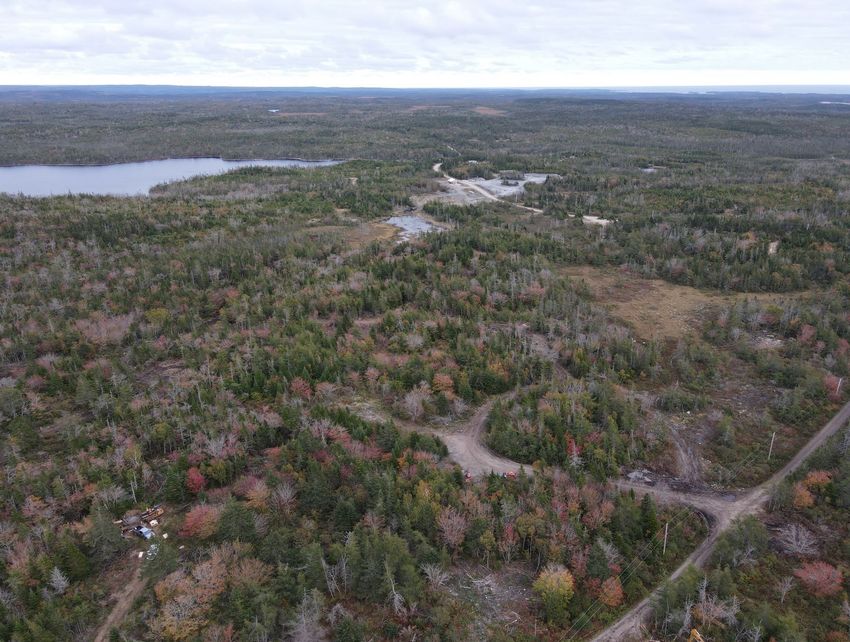
A Growing Gold Producer in Atlantic Canada                                          TSX:ANX

 Goldboro Gold Project                                      Point Rousse Project

                                                       10 years of continuous gold production in
100% Ownership, no royalties/streams
                                                       Newfoundland, generating free cash flow

Located in low-risk jurisdiction of Nova Scotia,       Projected production of 16,000 -17,000
Canada                                                 0unces in 2021

Measured and Indicated Resources of                    Excellent infrastructure including long-term
1,946,100 ounces of gold                               tailings storage capacity, no camp required

Inferred Resources of 798,100 ounces of gold
                                                              Tilt Cove Gold Project
Deposit open in all directions for resource
growth                                                 Over 35 kilometres of prospective strike
                                                       length, adjacent to the past producing, high
PEA demonstrates an estimated pre-tax NPV              grade Nugget Pond Mine
5% of 805 Million and IRR of 29.0%, after-tax
NPV 5% of 547 Million, IRR of 24.4%                    Historic high-grade area only 45 km along
(US$1,550 / C$2,000 gold price)                        paved road to the Company’s operating,
                                                       permitted mill and tailing facility
Subject to an ongoing Definitive Feasibility
Study, expected in Q4 2021                             Fully-funded for further exploration in 2021

                                                   4
                                                                               From the ground up.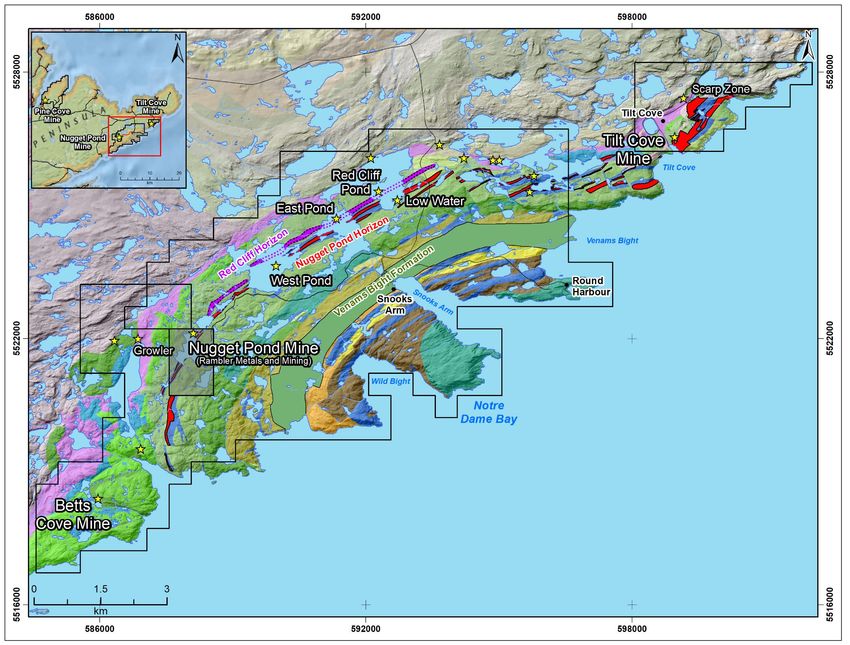
Experienced Mining & Financial Team                                                                                                         TSX:ANX

 Executive Management Team                       Board of Directors                                        Technical Advisory Committee
 Kevin Bullock                                   Jonathan Fitzgerald (Chairman)                            Keith Bullock, P.Eng.
 President and CEO, Director                     Former Chair & CEO of Orex Exploration Inc                Ex - Glencore (Falconbridge), Mining Lead for Onaping
                                                                                                           Depth and Nickel Rim Depth projects
 Robert Dufour                                   Kevin Bullock
 Chief Financial Officer                         President and CEO, Director
                                                                                                           Glenn Dobby, P.Eng and PhD
                                                                                                           Metallurgical engineering. Co-owner of Woodgrove
 Paul McNeill                                    Michael Byron                                             Technologies, a minerals technology company
                                                 President & CEO of Nighthawk Gold Corp.
 Vice President, Exploration
                                                 Lewis Lawrick                                             Jean-Pierre Landry
 Amanda Abballe                                  President and Chief Executive Officer, Magna              Registered Civil Engineer; Former director of Orex
 Vice President, Human Resources                 Terra Resources Inc.                                      Exploration Inc.

                                                 Mary-Lynn Oke
                                                 Previously Vice President of Finance, Chief Financial
                                                 Officer, Manitoba Business Unit of Hudbay Minerals Inc.

• Executive team has over 100 years of cumulative experience in mining, with a track record of running safe, profitable operations.
• Experience in acquiring, developing, and operating mining projects globally.
• Board and Management collectively own over 3% of Anaconda Mining.

                                                                            5
                                                                                                                                     From the ground up.
Corporate Structure                                                                                       TSX:ANX

Capital Market Data
                                                                        Shareholders
Symbol                                 TSX: ANX OTCQX: ANXGF                                                Institutions
                                                                                              22%
Shares Outstanding                     174.4M                                                       3%      Mgt & Board
Options                                3.1M
                                                                                    75%                     Retail
Warrants                               5.3M
Share Units                            1.9M
Fully Diluted                          184.7M
Market Capitalization                  $132.6M
                                                                        Analyst Coverage
Share Price (August 27, 2021)          $0.76
                                                                        • Beacon Securities Ltd
52 Week High/Low                       0.45 - $1.05
                                                                        • Mpartners
Cash Position (As of March 31, 2021)   $14.6M                           • Sprott Equity Research
Current Debt (As of March 31, 2021)    $1.7M (Total debt - $1.9M)

                                                                    6
                                                                                                    From the ground up.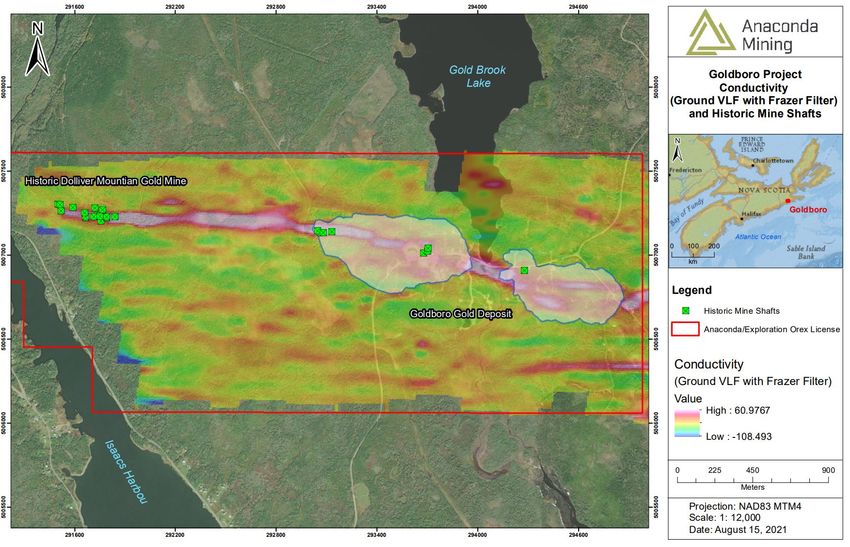
The Goldboro Gold Project                                                                                TSX:ANX

                                                                                                               Goldboro Project viewed to the East
• Prolific and stable gold jurisdiction with                                                                   Southeast and showing the surface
                                                                                                               expression of constraining pit shells
  6-7 M ounces of known gold in 11
  deposits in 150 km radius
• Similar geological trend to the Moose
  River Project (St. Barbara)

                                               • Goldboro is the single largest gold deposit in the Meguma Terrane and is poised to
                                                 be the next operating gold mine in Nova Scotia
                      Touquoy
                                               • Combined Open Pit and Underground Resource of:
                                                   •   1,946,100 ounces (16,036,000 tonnes at 3.78 g/t gold) M + I Resources
                                                   • 798,100 ounces (5,306,000 tonnes at 4.68 g/t gold) Inferred Resources

                                                        7
                                                                                                        From the ground up.
Goldboro 2021 Mineral Resource Estimate                                                                                                                                                       TSX:ANX

                           Cut-off                                  Tonnes Gold Grade            Troy         • February 2021 Mineral Resource based on:
   Resource Type                                Category
                            (g/t)                                    ('000)       (g/t)
                                                                                                Ounces               • 635 surface and underground drill holes
                                        Measured                      6,137        2.73        538,500               • A total of 113,132.9 metres of diamond drilling, including 45,409
                                        Indicated                    5,743        2.99         551,300                 metres conducted by Anaconda
      Open Pit              0.44
                                       Measured + Indicated          11,880       2.86        1,089,900       • High quality Mineral Resource
                                        Inferred                      1,580        1.75         89,000               • Constrained open pits were designed using only Measured and
                                                                                                                       Indicated Resources
                                        Measured                      1,384        7.36        327,700
                                        Indicated                     2,772       5.93         528,600               • Opportunity to target Inferred Resources adjacent to the constrained
    Underground              2.6                                                                                       open pits
                                        Measured + Indicated          4,156        6.41        856,200
                                                                                                              • Aggressive diamond drill campaign in addition to IP geophysical
                                        Inferred                     3,726        5.92         709,100
                                                                                                                survey
                                        Measured                      7,521       3.58         866,200
                                                                                                                     • 20,000 metre drill program initiated to target Inferred Resources
                                        Indicated                     8,515       3.95        1,079,900
     Combined*           0.44/2.60                                                                                     within and adjacent to the constrained open pits
                                        Measured + Indicated         16,036       3.78         1,946,100
                                                                                                                     • Survey to test opportunity along strike to the west towards a past
                                        Inferred                     5,306        4.68         798,100                 producing gold mine

Please refer to the technical report entitled "NI 43-101 Technical Report and Mineral Resource Estimate, Goldboro Gold Project, Eastern Goldfields district, Nova Scotia" dated February 22, 2021, which is available on
the Company's SEDAR profile at www.sedar.com. Mineral Resources were prepared in accordance with NI 43-101 and the CIM Definition Standards for Mineral Resources and Mineral Reserves (2014) and the CIM
Estimation of Mineral Resources and Mineral Reserves Best Practice Guidelines (2019). Mineral Resources that are not mineral reserves do not have demonstrated economic viability. Open Pit Mineral Resources are
reported at a cut-off grade of 0.44 g/t gold that is based on a gold price of CAD$2,000/oz (~US$1,550/oz) and a gold processing recovery factor of 96%. Underground Mineral Resource is reported at a cut-off grade
of 2.60 g/t gold that is based on a gold price of CAD$2,000/oz (~US$1,550/oz) and a gold processing recovery factor of 97%. Assays were variably capped on a wireframe-by-wireframe basis. Specific gravity was
applied using weighted averages to each individual wireframe. Mineral Resource effective date February 7, 2021. All figures are rounded to reflect the relative accuracy of the estimates and totals may not add
correctly. Excludes unclassified mineralization located within mined out areas. Reported from within a mineralization envelope accounting for mineral continuity.

                                                                                                             8
                                                                                                                                                                                       From the ground up.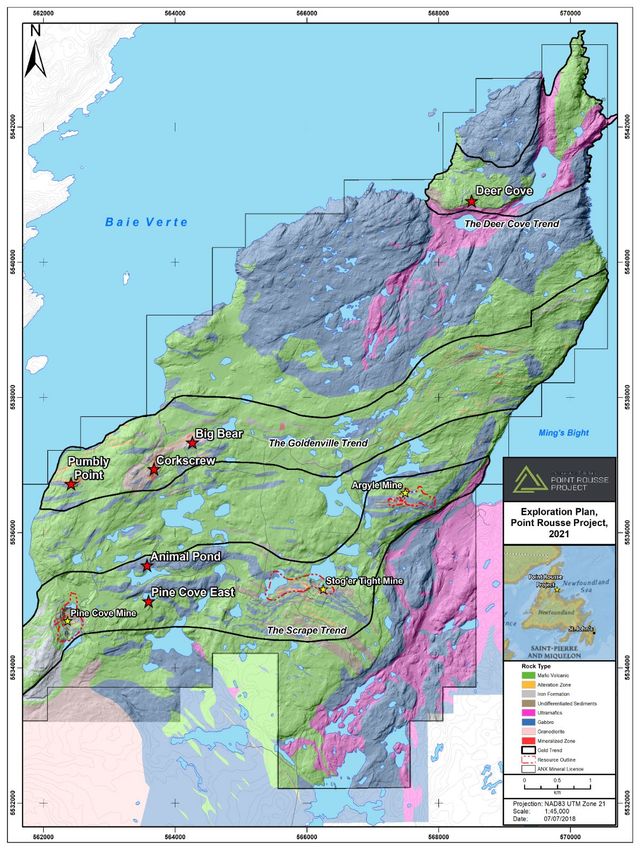
Goldboro Infrastructure and Facilities                         TSX:ANX

Infrastructure contained all within one single
watershed

• Fully lined Tailings Storage Facility designed for
  19,000,000 of tailings
• Camp to house up to 150 personnel
• CIL/CIP Process Plant designed for 4,000
  tpd/1,460,000 tpa throughput
• Diversion of public road access
• Waste Storage areas designed for 115,000,000
  tonnes of waste
• Organic stockpile areas

                                                       9
                                                           From the ground up.
Goldboro Preliminary Economic Assessment                                                 TSX:ANX

C$547 MILLION,               17.6-Year Mine                                96.4%
                                  Life               C$286 MILLION
  IRR 24.4%
 AFTER-TAX NPV5%                                      INITIAL CAPITAL     AVERAGE GOLD
                               LOM Production                               RECOVERY
  (US$1,550/oz Gold Price)

   1.9 NPV to                  112,000
                                                     US$668/ounce       US$799/ounce
                               OUNCES
 Initial Capital                                       LOM Operation
                              AVERAGE ANNUAL                              LOM AISC per
                                                       Cash Costs per
  AFTER-TAX IRR                  LOM GOLD                                   ounce
 (US$1,550/oz Gold Price)       PRODUCTION                ounce

                                                10
                                                                                  From the ground up.
The Goldboro Gold Project – PEA 2021 Overview TSX:ANX
2021 PEA KEY PARAMETERS
Key Assumptions
Base Case Gold Price US$1,550/oz
• Long mine life with strong project economics
FX Rate C$:US$ 1.29 • Gross revenue of $3.9 billion from 1.95 million ounces of gold, resulting the potential
Base Case Gold Price for PEA C$2,000/oz for $1.6 billion in undiscounted pre-tax net cash flow
Production Profile • Pre-tax NPV 5% of $805 million and IRR of 29.0%
17.6 years • After-tax NPV 5% of $547 million and IRR of 24.4%
Life of Mine
• Low operating and AISC cost per ounce of $862 (US$668) and $1,031 (US$799),
Total Mined Tonnage (including pre-production) respectively
114.2
from Open Pit Mining
• Initial capital cost $286 million resulting in an after-tax NPV 5% to Capex ratio of 1.9
Total Milled Tonnage from Open Pit Mining 15.0
• At a C$2,200 (US$1,705) gold price, Goldboro could yield an after-tax NPV 5% of over
4,000 tpd/
Processing Rate
1.46Mtpa
$700 million, IRR 29.2%
Overall Strip Ratio 6.6 • Establishing a robust project with significant growth
Gold Recovery 96.4%
LOM Average Annual Gold Production 112 koz
potential
Unit Operating Costs • Average gold production of over 89,500 ounces per year over the first 7 years of
LOM Average Operating Cash Costs US$668/oz (C$862) production, increasing to average annual production of over 120,000 ounces in years
LOM Average All-In Sustaining Cash Costs US$799/oz (C$1,031) 8 through 18
Capital Costs • Goldboro Deposit is open along strike and at-depth; significant opportunity for further
Initial Capital Cost $286.3 million growth
Ratio of NPV to Initial Capital Cost 1.9 • Potential to be a multi-generational gold mine
Sustaining Capital Cost $269.2 million
11
From the ground up.Goldboro PEA – Gold Price Leverage TSX:ANX
Description Unit Net Present Value (C$ M)
% Variation % -20% -10% 0% +10% +20%
• The PEA indicates a robust Project with Au Price2 US$/oz US$1,240 US$1,395 US$1,550 US$1,705 US$1,860
strong economics at US$1,550 gold C$/oz C$1,600 C$1,800 C$2,000 C$2,200 C$2,400
(C$2,000), with significant leverage in an
Discount Rate 0% C$M 562 836 1,110 1,384 1,658
increasing gold price environment
• At a US$1,705 gold price (C$2,200), the 3% C$M 330 528 724 921 1118
after-tax NPV 5% of Goldboro increases to 5% C$M 224 386 547 707 867
over $700 million, with an after-tax IRR of
29.2% and a payback period of only 2.1 8% C$M 115 238 359 479 599
years 10% C$M 64 167 269 370 470
IRR % 13.7% 19.3% 24.4% 29.2% 33.7%
Payback Period3 years 9.2 4.5 3.2 2.6 2.1
12
From the ground up.Peer Group Trading Multiples TSX:ANX
Anaconda Mining | peer group trading multiples
P/NAV (x)
0.8x
Note: Anaconda Mining NAV is the Goldboro NPV5% of C$547mm adjusted for balance sheet items
0.5x
0.5x 0.5x Median: 0.4x
0.4x
0.4x 0.4x 0.4x 0.4x
0.3x
0.3x
0.2x
0.2x
0.2x
Marathon Gold Skeena Osisko Mining Perpetua Artemis Gold Fury Gold Gold Standard Corvus Gold Sabina Integra Anaconda First Mining Treasury Kore Mining
Resources Mines Ventures Resources Mining Gold Metals
Source: Raymond James Ltd., Cap. IQ, Company Reports, Available Equity Research
13
From the ground up.Gold Production and Average Annual LOM TSX:ANX
200 2000.0
180 1800.0
160 1600.0
1497.0
105
140 1400.0
1319.0
120 1183.3 61 1200.0
55
58
50
1029.4 1021.3
100 1000.0
968.2 43
949.6 17
917.6 17 17 3
889.0
859.0
826.7 811.5 810.8
80 797.8 798.2 794.5 789.5 800.0
743.9 728.9
665.5 667.3 662.2 681.5
60 66 594.6 615.3 600.0
590.4
109 100 551.7
548.7 539.1 554.0
514.1
473.4 93 486.6 487.3 0
465.0 89
87 86 86 89
40 82 82 83 83 83 400.0
78 75 392.2 76
48
20 200.0
27
0 0 0.0 0 0.0 0 0 0 0 0 3 0.0
YR-2 YR-1 YR1 YR2 YR3 YR4 YR5 YR6 YR7 YR8 YR9 YR10 YR11 YR12 YR13 YR14 YR15 YR16 YR17 YR18
Under Ground Open Pit AISC per Ounce US$ Operating Cash Costs per Ounce US$
14
From the ground up.After-Tax Cash Flow Profile TSX:ANX
Underground development commences
1,200.0 70.0
1,113.4
1,089.3
61.8
1,000.0 1,003.4
60.0
907.6
828.5
800.0
752.8 50.0
655.6
600.0
530.9 40.0
400.0 32.9
339.8
27.9 30.0
26.7
25.5 239.8 24.7 191.2
200.0
167.7
148.3
124.7
84.4 92.5 94.1 100.0 97.1 95.8 85.9
73.9 73.5 72.1 75.7 79.1
55.1 56.3 20.0
37.1
28.1 24.1
0.0 -9.0 8.1 1.7
14.1
-64.1
-99.2 11.7
-138.0 9.3 9.1 9.0
-187.1 10.0
-200.0 7.4
4.3 4.0
-286.3
0.9
0.0 0.0 0.0 0.0 0.0
-400.0 0.0
Sustaining Capital Costs (incl. Contingency) After-tax cash flow Cumulative After-Tax Cash Flow
15
From the ground up.…With Continued Growth Potential TSX:ANX
16
From the ground up.Continued Resource Growth Potential at Surface TSX:ANX
• Opportunity for Resource Growth to the West of the
Deposit towards the past producing Dolliver Mountain
Gold Mine
• Anaconda is planning a 50-line kilometer Induced
Polarization ("IP") geophysical survey over the area west
of the Goldboro Deposit for approximately one kilometre
up to the past producing Dolliver Mountain
• Will assist in identifying such continuation to the west as
well as any potential parallel zones north and south of
the currently known extents of the deposit
• The Goldboro Deposit remains open in all directions and
at depth
• These anticline /saddle reef are analogous to the
Victorian Goldfields, which are known to continue at
depth for multiple kilometres
• We believe this has the potential to be a multi-
generational mining operation
17
From the ground up.Goldboro Gold Project – Clear Path to Development TSX:ANX
45,000 m infill drill program
Updated and Expanded Mineral
Resource Completion of ongoing Definitive
M&I of 1,946,100 ounces, including Feasibility Study by end of Q4 Detailed Engineering
1,089,900 in constrained open pits
Site Construction
Inferred of 798,100 ounces 2021
Preliminary Economic Assessment by Complete the Environmental Surface mining Pre-Production
end of Q2 2021
Assessment Registration Process Plant Commissioning
Continued 20,000 metres of Infill
Drilling to upgrade Inferred Resources Document Commercial Production from
Ongoing permitting and environmental Receive Permits and Mineral surface mining
baseline studies Lease
2021
18
From the ground up.Baie Verte Mining District, Newfoundland TSX:ANX
Excellent Infrastructure – Unique Advantage
• ANX is the only operating gold mine in the province
• Experienced, skilled local workforce – no camp
• Operating mill with long-term permitted tailings capacity
• Fully-owned port facility with tide water access
• Site is accessible by a paved road network
• Fast track from discovery to development
Prolific mining camp for high grade golddeposits
• Hosts five (5) known gold deposits - all within 50 km
• Home to two (2) past producing high-grade gold mines (Nugget Pond
at 9.85 g/t and Hammerdown at 15.74 g/t)
• Three (3) gold mines in the region have produced more than
400,000 oz of gold
• +100 km of prospective strike – similar structural setting to other
large gold camps
• ~11,000 ha of prospective mineral lands
19
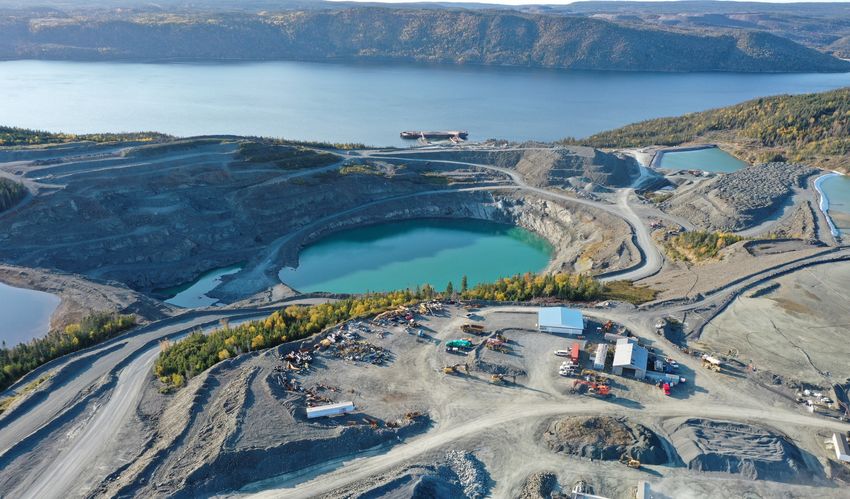
From the ground up.Potential to Leverage Operating Infrastructure TSX:ANX
Polishing
ANX’s Deep Water Pond
Port and Dock
Tailings
Tailings
7Mt In-pit
tailings facility
Pine Cove Mill
and Operations
~1.4 km
20
From the ground up.Point Rousse Operations – Production and Cash Flow TSX:ANX
• Over a decade of profitable mining operations at the Point Rousse Operations
in the Baie Verte Peninsula
• Free cash flow generation has allowed for minimal dilution of shares and the
ability to pursue growth opportunities
2020 Production Results
• Achieved guidance with gold production of 18,268 ounces
• Generated record revenues of $41.5 million
• Processing of ore from the Argyle Gold Mine commenced in Q4 2020
• Realized EBITDA at Point Rousse Project of $20.5 million
• Generated $14.1 million in operating cash flow from operations
2021 Production and Cash Cost Guidance
• Production and sales of 16,000 – 17,000 ounces of gold from continued mining
at Argyle with supplement feed from Pine Cove stockpiles
• Operating cash costs for the remainder of the year (Q2 through Q4) to be
between US$1,125 - US$1,175 (C$$1,450 - C$1,500), full year operating cash
costs per ounce are expected to be between US$1,225 – US$1,275 (C$1,625 -
$C1,675).
21
From the ground up.Point Rousse Operation – Reserves and LOM TSX:ANX
Point Rousse Strategy
• Continued cash generation
• Ongoing Expansion and Infill drilling at the Stog’er Tight
Extension
• Continued discovery and LOM
• Exploration on other drill targets
Point Rousse Mineral Reserve Estimate* - (Effective Dates Below)
Deposit Category Cut-off (g/t) Tonnes Grade (g/t) Ounces
Argyle^ Probable 0.56 535,592 2.06 35,477
Pine Cove# - Mine+ROM Probable 0.5 170,851 1.4 7,706
Pine Cove# - Marginal Stockpile Probable 0.5 252,560 0.55 4,466
Total Combined Probable 959,003 47,649
^Argyle Mineral Reserve Estimate Effective Date - August 4th, 2020
#Pine Cove Effective Date - August 31st, 2020
*Reserve table taken from the technical report, entitled " NI 43-101 Technical Report, Mineral Resource and Mineral Reserve
Update on the Point Rousse Project, Baie Verte, Newfoundland and Labrador, Canada " with a report date of September 18,
2020. See full reference and Mineral Resource and Reserves notes in the Appendices.
22
From the ground up.Point Rousse - Exploration Upside & Extension of LOM TSX:ANX
Next Discovery - Stog’er Tight Extension (278 Zone)
• 278 zone is an extension of the Stog’er Tight Mine;
• Channel samples in the area included 1.28 g/t gold over 8.8 metres and
3.81 g/t gold over 3.0 metres;
• Recently completed a 4,000-metre diamond drill program to outline a
deposit;
• Highlights of the drill program to date include:
• 5.45 g/t gold over 20.0 metres (44.0 to 64.0 metres), including
33.90 g/t gold over 1.0 metre in diamond drill hole BN-20-311;
• 4.37 g/t gold over 15.0 metres (98.0 to 113.0 metres), including 10.41
g/t gold over 5.0 metres in diamond drill hole BN-20-338;
• 18.42 g/t gold over 5.0 metres (48.0 to 53.0 metres), including
74.40 g/t gold over 1.0 metre in diamond drill hole BN-20-309;
• 10.14 g/t gold over 7.0 metres (28.0 to 35.0 metres), including
33.90 g/t gold over 1.0 metre in diamond drill hole BN-20-310; and
• 5.55 g/t gold over 8.0 metres (25.0 to 33.0 metres), including 39.70
g/t gold over 1.0 metre in diamond drill hole BN-19-295.
• Mineralization encountered to date is shallow and associated with
second order geophysical anomalies;
• Will test other second order geophysical anomalies along the Scrape
Trend (e.g. Pine Cove East).
23
From the ground up.Tilt Cove Gold Project – Targeting High-Grade Gold Deposits TSX:ANX
• 35 km of prospective strike including more than 15,000 ha
assembled for the first time in 20 years
• Between 40-50 km from Pine Cove Mill along existing
paved road networks
• Past Producing Nugget Pond Mine included 537,672
tonnes at 9.85 g/t gold (168,748 oz) with 98% recovery
• Includes the Nugget Pond Horizon and Red Cliff Pond
Horizons – iron formations
• Down-ice, Gold-in-soil anomalies, Alteration halos includes
the replacement of magnetite by pyrite, IP chargeability
anomalies associated with gold deposits
• 13 priority exploration targets including significant drill
intersections of gold
24 From the ground up.Nugget Pond Area TSX:ANX
West Pond Prospect
• 1.3-km long target beneath West Pond
• Combined till and soil anomaly up to 600 m down-ice (SW)
of NPH indicating erosion of a mineralized body
• Coincident break in the magnetic trend of NPH
East Pond Prospect
• Previous drilling missed the NPH, but intersected footwall
mineralization as found at Nugget Pond including:
5.74 g/t gold over 0.5 m
10.30 g/t gold over 0.5 m
1.16 g/t gold over 3.4 m, and
4.90 g/t gold over 0.5 m
• 800-m long segment of the NPH
• No historic soil sampling down ice to the southeast
Red Cliff Pond
• 1.2-km long target at Red Cliff Pond
• Anomalous gold bearing soils to the southeast with grab
samples up to 5.56 g/t gold
• Drill intercepts including 1.92 g/t over 4.3 m
25 From the ground up.Key Investment Takeaways TSX:ANX
Anaconda Mining offers investors unique exposure to production and free cash flow, growth from
development, and discovery upside, all in a premier, low-risk mining jurisdiction.
Well funded - Cash on hand of $14.5M of March 31, 2021 (plus $8.5M Flow Through funds raised in late May, 2021)
and continued free cash flow generation to drive continued growth and minimize shareholder dilution
Multiple Near-Term Growth Catalysts
Preliminary Economic Assessment delivered for Goldboro in June 2021 in light of the significantly expanded
Mineral Resource announced in February 2021
Actively drilling at multiple targets at the highly prospective Tilt Cove Gold Project
Ongoing drill results at Point Rousse to continue to extend the Life of Mine
Ongoing Feasibility Study for the Goldboro Gold Project anticipated in Q4 2021
Mining and processing from the Argyle Gold Mine has commenced, providing continued profitable production and
free cash flow, with further potential to increase the Point Rousse life of mine
Numerous development milestones on course to achieve annual production ~ +100,000 ounces of gold
Current valuation presents and optimal entry point for investors – Strong Valuation Upside
26
From the ground up.TSX:ANX
Appendices
28
From the ground up.Biographies TSX:ANX
Kevin Bullock | President, Chief Executive Officer & Director
Kevin Bullock is a registered Professional Mining Engineer in the province of Ontario. Kevin was Volta Resources Inc.’s President and CEO and was the
founding President and CEO of Goldcrest (a Volta predecessor company) since its inception in 2002. Kevin was instrumental in the growth of Volta from
a shell company through to the ultimate sale of the company to B2Gold at the end of 2013. Kevin has over 30 years of experience, at senior levels, in
mining exploration, mine development, mine operations and capital markets. Throughout his career, Kevin has been involved in projects from inception
through exploration to development and production. Kevin was most recently the CEO of Mako Mining Corp. and is currently a director of B2Gold. Mr.
Bullock has also worked for Kirkland Lake Gold and Iamgold Corporation.
Robert Dufour | Chief Financial Officer & Corporate Secretary
Robert Dufour was appointed Chief Financial Officer of Anaconda Mining in May 2017. Mr. Dufour brings a strong track record in the mining sector with
deep experience in capital markets and finance, including debt structuring, royalty arrangements and financing, as well as extensive experience with
corporate governance and risk management. Most recently, Mr. Dufour was Chief Financial Officer of Newmarket Gold, a TSX-listed mid-tier Australian
gold producer which produced over 220,000 ounces of gold. Mr. Dufour was part of the team that executed the transformational merger between
Newmarket Gold and Kirkland Lake Gold, creating a new 500,000+ ounce gold producer in 2017. Prior to his appointment as Chief Financial Officer at
Newmarket Gold in 2015, Mr. Dufour was Chief Financial Officer of Crocodile Gold. In 2015, Mr. Dufour also led the merger between Newmarket Gold and
Crocodile Gold. Mr. Dufour joined Crocodile Gold in June 2012 as Director of Finance and was appointed Chief Financial Officer in April 2013. Mr. Dufour
is a Chartered Professional Accountant with over 12 years of finance and accounting experience. He started his career with the Toronto office of
PricewaterhouseCoopers. He later joined Northgate Minerals Corporation as Corporate Controller and subsequently was promoted to Group Financial
Controller for Northgate's Australian subsidiaries, and was based out of Victoria, Australia until its acquisition by AuRico Gold.
29
From the ground up.Biographies TSX:ANX
Paul McNeill | Vice President, Exploration
Mr. McNeill joined Anaconda in 2014. Formerly, he served as Principal Geologist with Paladin Energy Ltd. of Perth, Australia and Vice President – Exploration for
Aurora Energy Resources Ltd. based in St John’s NL, where he was focused on the development of the Michelin Project in Labrador, as well as working on
uranium projects in Australia and a gold project in Nevada. Mr. McNeill has developed expertise in structural controls on mineralization, project development and
grass roots exploration. Mr. McNeill is a Professional Geologist registered in the Provinces of Newfoundland and Labrador and Nova Scotia. He currently serves
on the board of Mining NL and is the Past President of the CIM NL branch.
Amanda Abballe | Vice President, Human Resources
Ms. Abballe has over 14 years of progressive human resources experience. Since joining Anaconda in 2019, she has had executive responsibility for driving the
Company’s people and talent strategy globally, including employee experience, leadership, compliance and culture. Ms. Abballe previously held a variety of senior
positions in different Industries including Mining. Her functional experience spans global mobility, M&A integration, employee engagement, internal
investigations, work-force planning, succession planning, leadership development and digital transformation. Amanda holds a number of industry designations
and is a member of the Human Resources Professional Association. Ms. Abballe holds an Honours Bachelor of Arts in Labour Relations and Human Resources
Management from York University.
30
From the ground up.Point Rousse –Resource Estimate TSX:ANX
Mineral Resource Estimate Notes
Average Point Rousse Mineral Resources
1. Mineral Resources were prepared in accordance with NI
Cut-off Grade of
Reserve Grade Tonnes Gold Contained Ounces Open Pit (OP) Constrained 43-101, the CIM Definition Standards for MRMR (2014)
Deposit Category (g/t) (t) (g/t) of Gold Deposit Cut-off (g/t) Indicated Tonnes (t) Gold (g/t) Ounces and 2019 CIM MRMR Best Practice Guidelines.
Argyle Probable 0.56 535,592 2.06 35,477 2. Mineral Resources are inclusive of Mineral Reserves.
Argyle 0.5 488,000 3.14 49,300
Pine Cove - Mine+ROM Probable 0.50 170,851 1.40 7,706 Mineral Resources that are not Mineral Reserves do not
Pine Cove 0.5 722,000 1.64 38,100
Pine Cove - Marginal Stockpile Probable 0.50 252,560 0.55 4,466 have demonstrated economic viability.
Stog'er Tight 0.5 102,000 2.39 7,800
Total Combined Probable 959,003 47,649 3. Open Pit Mineral Resources occur within an optimized pit
Combined Indicated 0.5 1,311,000 2.26 95,100 shell developed by Dassault Systèmes Canada Inc.; base-
case optimization parameters include: mining at $4.00 per
Point Rousse Mineral Reserve Notes Deposit Cut-off (g/t) Inferred Tonnes (t) Gold (g/t) Ounces tonne, combined processing and G&A at $29.00 per tonne,
1. Mineral Reserves were prepared in accordance with NI 43-101, the CIM Definition
and a gold price of CAD$1,900/oz (US$1,425/oz).
Standards for MRMR (2014) and 2019 CIM MRMR Best Practice Guidelines. Argyle 0.5 9,000 3.80 1,100
4. “Open Pit” Mineral Resources are reported at a cut-off
2. Mineral Resources are inclusive of Mineral Reserves. Mineral Resources that are not Pine Cove 0.5 13,000 1.56 700
grade of 0.50 g/t gold within the optimized pit shell and are
Mineral Reserves do not have demonstrated economic viability. Stog'er Tight 0.5 134,000 3.06 13,200
considered to have reasonable prospects for eventual
3. The Argyle Mineral Reserve is based on the Mineral Resource Estimate prepared by
Combined Inferred 0.5 156,000 2.98 14,900 economic extraction by open pit mining methods.
Mercator Geological Services Limited with an effective date August 4, 2020.
5. “Out of Pit” Mineral Resources are external to the
4. The Argyle Mineral Reserve Estimate has an effective date of August 4, 2020.
optimized pit shell and are reported at a cut-off grade of
5. The Argyle Mineral Reserve Estimate is reported from Indicated Resource blocks at a Point Rousse Mineral Resources 2.00 g/t gold. They are considered to have reasonable
0.56 g/t cut-off within the optimized pit shell design developed by Dassault Systèmes
Out of Pit (OoP) prospects for eventual economic extraction using
Canada Inc.; base-case optimization parameters include: mining at $4.00 per tonne,
conventional underground mining methods based on a
combined processing and G&A at $29.00 per tonne, average pit slope angles of 48 Deposit Cut-off (g/t) Indicated Tonnes (t) Gold (g/t) Ounces
mining cost of $91 per tonne, processing and G&A cost of
degrees (north) and 35 degrees (south), daily mill throughput of 1,200 tonnes per day, Argyle 2.0 62,000 2.86 5,700
$29.00 per tonne, and a gold price of CAD$1,900/oz.
and average process recovery of 87%, and a gold price of CAD$1,900/oz Pine Cove 2.0 83,000 3.01 8,000 6. "Combined" Mineral Resources are the tonnage-weighted
(US$1,425/oz). Stog'er Tight 2.0 14,000 4.27 1,900 average summation of Open Pit and Out of Pit Mineral
6. The Pine Cove Mineral Reserve Estimate is based on the Mineral Resource Estimate
Resources.
prepared by Adiuvare Geology and Engineering Ltd. with effective date August 8, Combined Indicated 2.0 159,000 3.06 15,700
7. Mineral Resources were interpolated using Ordinary
2020 and internal reconciliation of stockpiled marginal and ROM with an Effective
Deposit Cut-off (g/t) Inferred Tonnes (t) Gold (g/t) Ounces Kriging methods applied to 1 metre downhole assay
Date of August 31, 2020.
composites capped at 15 and 30 g/t gold (Pine Cove and
7. The Pine Cove Mineral Reserve has an effective date of August 31, 2020. Argyle 2.0 56,000 3.89 7,000 Stog’er Tight) and 20 g/t gold (Argyle).
8. The Pine Cove Mineral Reserve Estimate is reported from Indicated Resource blocks Pine Cove 2.0 93,000 2.93 8,800 8. An average bulk density value of 2.77 g/cm3 was applied
at a 0.50 g/t cut-off as determined by ongoing mining at the Pine Cove Mine including Stog'er Tight 2.0 210,000 3.62 24,400 to all Mineral Resources.
mining costs of $3.50 per tonne mined, combined processing and G&A costs of $28.60
9. Mineral Resources may be materially affected by
per tonne milled, daily mill throughput of 1,200 tonnes per day, an average process Combined Inferred 2.0 359,000 3.48 40,200
environmental, permitting, legal, title, taxation,
recovery of 87%, and a gold price of CAD$1,900/oz (US$1,425/oz).
sociopolitical, marketing, or other relevant issues.
Combined Point Rousse Mineral Resources 10. Mineral Resource tonnages and troy ounces have been
Category Cut-off (g/t) Tonnes (t) Gold (g/t) Ounces rounded to the nearest 1,000 and 100, respectively; totals
may vary due to rounding.
Indicated 0.5/2.0 1,470,000 2.34 110,800
11. The following Mineral Resource Estimate Effective Dates
Inferred 0.5/2.0 515,000 3.33 55,100
apply: Argyle - August 4, 2020, Pine Cove - August 8,
2020, and Stog’er Tight - April 22, 2020.
31 From the ground up.TSX:ANX
CONTACT INFORMATION
Kevin Bullock, President & CEO
647-388-1842
KBullock@AnacondaMining.com
20 Adelaide St. East, Suite 915
Toronto, Ontario
M5C 2T6
www.anacondamining.com
32
From the ground up.You can also read