Updated Feasibility Study for the Goose Gold Mine at the 100% owned Back River Gold District in Nunavut, Canada - March 2021
←
→
Page content transcription
If your browser does not render page correctly, please read the page content below
Goose Gold Project, Back River, Nunavut, Canada

Updated Feasibility Study for the Goose Gold Mine at the
100% owned Back River Gold District in Nunavut, Canada
                                                               March 2021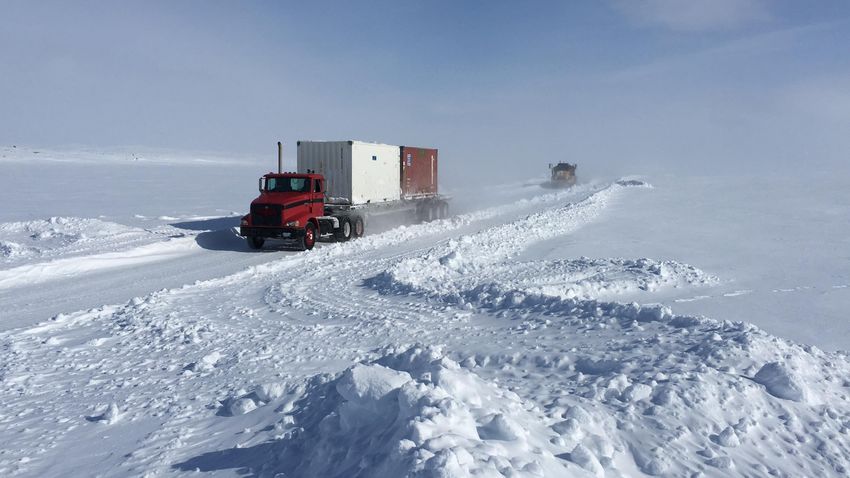
2

Forward Looking Information
Statements relating to our belief as to the results of development studies, timing of receipt of necessary authorizations and licenses,
the availability of project financing, the timing of the start of construction and the first gold pour, and the results of further
optimization studies to the UFS, the potential tonnage and grades and contents of deposits and the potential production from and
viability of Sabina’s properties are forward looking information within the meaning of securities legislation of certain Provinces in
Canada. Forward looking information are statements that are not historical facts and are generally, but not always identified by the
words “expects,” “plans,” “anticipates,” “believes,” “intends,” “estimates,” “projects,” “potential,” “opportunities,” and similar
expressions, or that events or conditions “will,” “would.” “may,” “could,” or should occur. The forward looking information is made of
the date of this presentation. This forward looking information is subject to a variety of risks and uncertainties which could cause
actual events or results to differ materially from those reflected in the forward looking information, including, without limitation: the
effects of general economic conditions; changing foreign exchange rates; risks associated with exploration and project development;
the calculation of mineral resources and reserves; risks related to fluctuations in metal prices; uncertainties related to raising sufficient
financing to fund the planned work in a timely manner and on acceptable terms; changes in planned work arising from weather,
logistical, technical or other factors; the possibility that results of work will not fulfill expectations and realize the perceived potential
of the Company’s properties; risk of accidents, equipment breakdowns and labour disputes; access to project funding or other
unanticipated difficulties or interruptions; the possibility of cost overruns or unanticipated expenses in the work program; title
matters; government regulation; obtaining and receiving necessary licenses and permits; the risk of environmental contamination or
damage resulting from Sabina’s operations and other risks and uncertainties including those described in Sabina’s annual information
form for the year ended December 31, 2019 available at www.sedar.com
Forward looking information is based on the beliefs, estimates and opinions of Sabina’s management on the date the statements are
made. Sabina undertakes no obligation to update the forward-looking information should management’s beliefs, estimates or
opinions, or other factors, change, except as required by applicable law
3

Creating value from 80 km Back River Gold District in Northern Canada
 Goose Mine – one of five 100% owned prospective properties of gold bearing iron formation in the belt

 Assets                             Partners                          Catalysts
 ▪ Large gold resources/reserves    ▪ Experienced management          ▪ Detail Engineering due H1, 2021
 ▪ High grade (6g/t Au open           and Board                       ▪ Project Debt Process being
   pits)                            ▪ Successful track record           refreshed
 ▪ District scale                   ▪ Supportive strategic and        ▪ Production Decision subject to
 ▪ Offers development flexibility     institutional shareholders        project financing due H1, 2021
 ▪ Mining friendly jurisdiction     ▪ Strong community support        ▪ Camp opening early March 2021
 ▪ Robust economics at US$1600      ▪ Landowners aligned              ▪ 2021 Exploration at Goose and
   gold price (After tax C$1.1B       shareholders                      to begin at George Property
   NPV & ~28% IRR )
 ▪ Hackett River Silver royalty

     Updated Feasibility study demonstrates high-confidence, de-risked
       project with longer mine life and increased production profile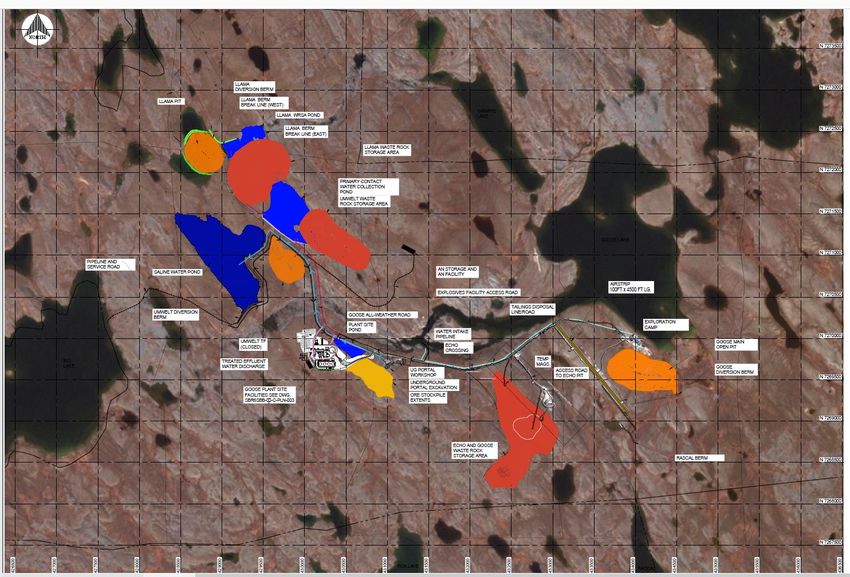
4

                                                                                                   Development Companies by size and grade
                                         14               ARTG
                                                                            NovaGold
                                                                            23MMoz at 2.1g/t

                                         12
                                                                                                                                                     One of the few fully permitted
                                                                        Median target resource
                                                                        grade since 2013 = 1.9 g/t
                                                                                                                                                    projects in a tier one jurisdiction
                                         10
Gold equivalent resource (Moz) - M&I+I

                                                                                FPC                                     SBB
                                                                 FF
                                                    TLG
                                          8                      PPTA

                                                               OLA
                                                               OIII                    ODV
                                                    RIO
                                          6                  BSX
                                                           LR
                                                  KORE    ORE
                                                           ITR                                                SKE
                                          4       KOR                   MOZ                        INV                          FURY
                                                          GSV   PRB                                                                           AOT                    Median target resource size since 2013 = 2.7 Moz
                                                   FVL   RVG
                                                                                             ORR
                                              CMM      TML
                                                         DEG   NHK                                                              BTR                                   BGL
                                          2       CAI                                                                                                                                                               SIL
                                              WVM       AGC    WGO                                 GWM                                                                      BSR
                                                        MGM                                              MAE GTR         BNAU
                                              MAI  KIN RGD          BME
                                                        G                                                                                            LIO      HIGH                  AUT
                                              LGD            YGT
                                                                                                                                                    RDS
                                          0
                                              0            1            2          3           4          5         6           7         8           9         10            11          12        13         14         15
                                                                                                                        Gold equivalent grade (g/t) - M&I+I
                                              RBC Capital Markets 02/23/21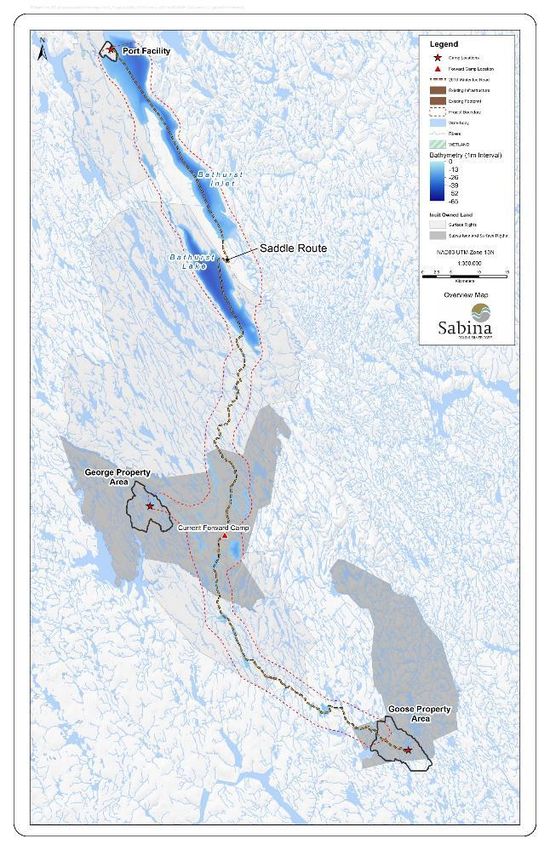
5

 Over 575,000 meters of drilling completed at Back River
  Reserve Tonnes                 Grade          Ounces               With a historic resource to reserve conversion rate of 73%, and all deposits
  Proven    8,008                5.54           1,426               open, we will be mining at Goose long past the 15 year mine life in this study
  Probable 10,684                6.29           2,162
  Resource         Tonnes Grade                 Ounces
  M&I              33,452 5.88                  6,321
  Inferred         13,794 6.44                  2,856
 Grade in g/t

▪ Updated resource estimate added:
   ▪ 988koz Au to M&I
   ▪ 1Moz Au to Inferred

▪ Reserve Estimate added 1M oz Au

 All in finding costs (since 2014)
      are C$24.95 per ounce
See slides #35 & 36for resource/reserve estimate QA/QP.
Mineral Resources are not Mineral Reserves and as such do not have demonstrated economic viability.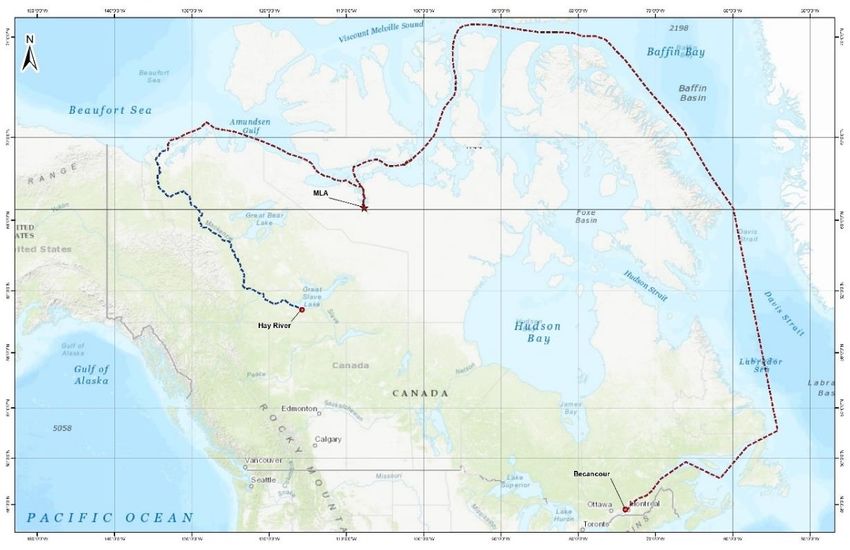
6

Back River – World Class Grade
Only Project with +5 g/t average grade with an Open Pit component
                                          OP                                                            10

                                     12                                                                 9
                                               OP
 Total Gold – All Categories (Moz)

                                                                                                        8
                                               UG
                                     10
                                                                                                        7

                                                                                                            Average Gold Grade (g/t)
                                                    OP
                                     8                                                                  6

                                                         UG
                                                                                                        5
                                                              UG
                                     6
                                                                                                        4
                                                                    OP
                                                                              UG    OP                  3
                                     4
                                                                                         UG
                                                                                                        2
                                                                                              UG   OP
                                     2
                                                                                                        1

                                                                                                        0
                                     0

Notes: Select development projects with gold reserves/resources greater than 1Moz
Source: Various Company Technical Reports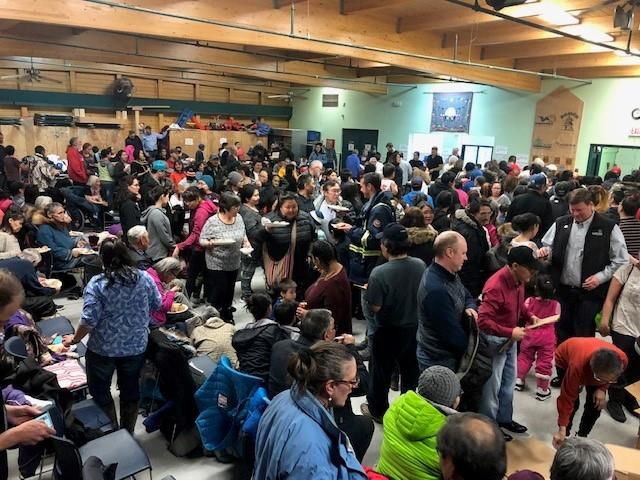
7

Key Project Enhancements
   This level of engineering significantly de-risks the Project, bringing a higher level of
certainty to capital and contingency estimates when compared to most feasibility studies
▪   An updated gold price of US$1,600/ounce and exchange rate of $C:US$ of 1.31:1.00
▪   56% improvement on capital efficiency compared to the IFS (NPV/Initial CAPEX)
▪   Higher confidence in CAPEX and changes to project scope to de-risk execution & operations
▪   1M of increase in reserve
▪   High-grade Umwelt underground earlier increases production profile (peak production of 312 koz Au in year 3)
▪   Process plant expansion from 3,000 tpd to 4,000 tpd at end of year two of production
▪   Echo open pit and underground, Goose Main underground, Llama underground added to mine plan
▪   No requirement for TSF, the most complicated and highest civil capital risk to the Project. Exhausted pits used for
    tailings storage
▪   Pre-production mining at Echo and Umwelt pits place 2.2 Mt and 372K oz stockpiled material, prior to
    commencement of milling operations (sufficient for two years of mill feed)
8

 Key Project Enhancements Continued
 ▪     OP vs UG – 53%/47% (tonnes)
 ▪     Significant earthworks completed: box-cut for underground exploration ramp, 4 km of roads, airstrip extension,
       and site prep for the process pad and accommodation complex
 ▪     Construction of Port and receipt of three sealifts successfully testing logistics and supply chain from the South
 ▪     Construction and operation of a 172km Winter Ice Road from the Port to the Goose Property, gaining valuable
       experience in the Project’s key infrastructure
 ▪     Significant infrastructure including fuel tanks, batch plant, construction crushers and construction/mobile
       equipment mobilized in 2019/2020 with two maintenance shops
 ▪     Basic engineering completed with detailed engineering substantially completed
 ▪     Constructability and operability review by third party Arctic construction team
 ▪     A prominent Original Equipment Manufacturer engaged to complete the process plant equipment design with a
       fixed price contract

See slides 35,36 & 37 for QP information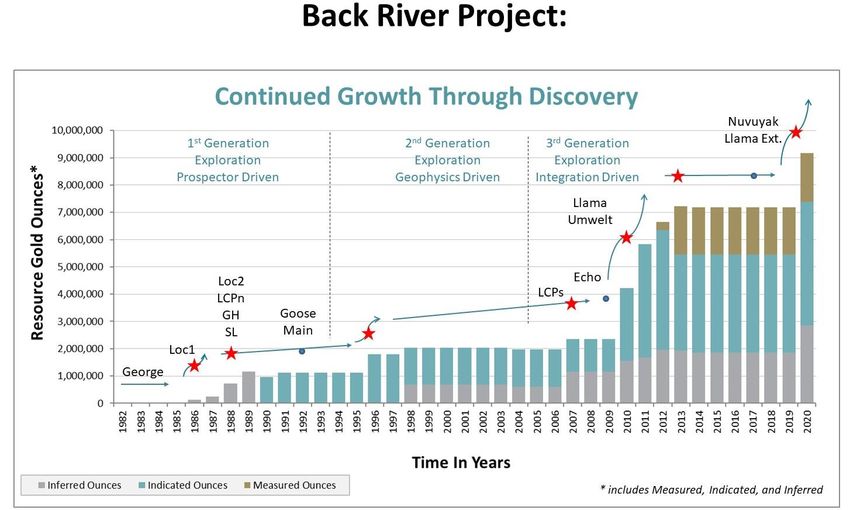
9

UFS delivers a Project with a high degree of confidence compared to others
▪   The Project is fully permitted with no costly changes needed to accommodate future permitting requirements;
▪   The cost of Social License has been incorporated (IBA & Royalties);
▪   Detailed engineering is substantially complete based upon material take off quantities versus estimates and
    factoring;
▪   Major logistics infrastructure and supply chain has been built and successfully tested;
▪   Substantial civil earthworks have been completed at Port and Goose Site;
▪   A third-party experienced Arctic contractor has provided a review on constructability and operability;
▪   Bonding amounts certain and agreed to by federal/Inuit Stakeholders and incorporated into the Project;
▪   Deliberate increase in CAPEX initiatives to provide lower operational/execution risk;
▪   Mineral Resource Estimates provide foundation for future reserves to extend mine life;
▪   Constructor has been involved in development of project schedule and resource loading;
▪   Framework for 3 year construction labour costs agreed to in principle;
▪   Additional capex has been allocated for operational readiness.
▪   Additional time for commissioning and ramp up has been added from IFS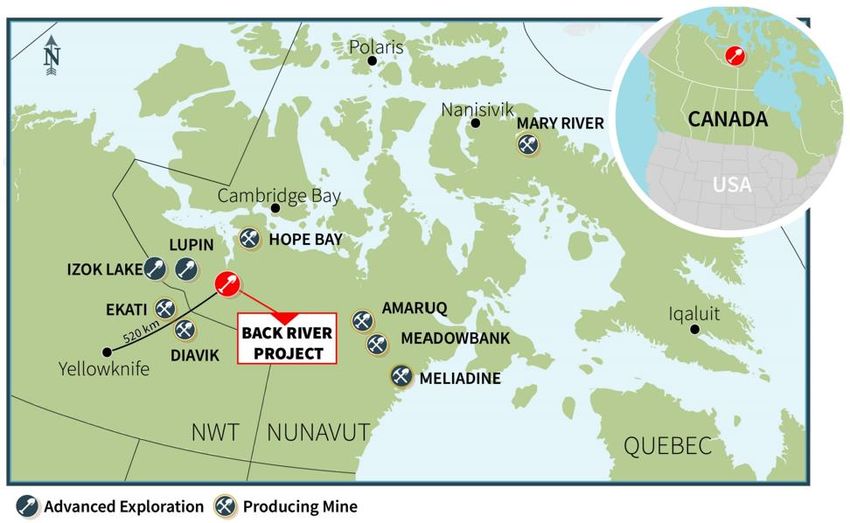
10

 UFS 2021 Highlights vs IFS 2015                                  See slide 37 for QP Information

                                         Unit        2015 IFS        2021 UFS
                                                                                                      Peak production Y3 of
 Gold Production LOM                      Moz           2.32           3.35                           312koz. LOM average
                                                                                                         recovery 93.4%
 Annual Gold Production                   Moz        250 (Y1-8)     287 (Y1-5)
 Annual Gold Production LOM               Moz           198            223                            CAPEX Increase due to
 Mine Life                                years         11.8            15                          change in Project scope to
                                                                                                    de-risk, cost escalation of
 Initial Capital Cost                      $M           415       610 (US$466)                        12% and Underground
 Sustaining Capital Cost                   $M           185       419 (US$320)                       development in Year -2
 Closure Cost                              $M            64             42
                                                                                                    Addition of four UG mining
 Operating Cost                            $/t          115            141                            zones and inclusive of
 Cash Costs                              US$/oz         534            679                                 closure costs
 All-In Cash Costs (AISC)                US$/oz         620            775
 Pre-Tax IRR                                %           28.2            33                          Removal of TSF reduces
                                                                                                        closure costs
 Pre-Tax NPV 5%                            $M           699            1.7B
 Post-Tax IRR                               %           24.2           27.7
 Post-Tax NPV 5%                           $M           480       1.1B (US$860)
 Payback/Break Even Gold Price        Years/US$ oz    2.9/795        2.3/955
All CAD$ Unless Otherwise Specified
11
Initial Sustaining LOM
Economics – Capital Cost CAPEX ($ million) ($ million) ($ million)
Mining1 56 348 404
On-Site Development 6 3 9
PRE-PRODUCTION CAPEX BREAKOUT
Ore Crushing and Handling 28 0 28
Owner’s Costs Mining/development
Contingency 11% 10%
Ore Crushing Process Plant 91 13 104
9% and Handling
5% On-Site Infrastructure (Goose) 97 5 102
EPCM
Process Plant
1%
15% Off-Site Infrastructure 1 0 1
Port 19 4 23
Tailings 5 0 5
Indirect Costs2 177 4 181
Indirect Costs
29%
On-Site
Infrastructure
EPCM 6 0 6
Tailings MLA/Off-site
16% Owner’s Costs 68 0 68
Infrastructure
1%
3%
Reclamation 0 42 42
Subtotal 554 419 973
Contingency 56 - 56
Total CAPEX 610 419 1,029
Notes: 1 Includes labour and mining equipment purchases only.
2 Includes preproduction mining explosives, fuel, maintenance spares, and consumables.
Numbers may not add due to rounding.12
Economics – Operating Costs
LOM OPEX
LOM G&A Open Pit Mining
OPEX 16% 14%
($ million)
Open Pit Mining 355 Freight &
Site/Offsite
Services
Underground Mining 714 17%
Underground
Processing 693 Mining
27%
Freight & Site/Offsite Services 450
G&A 415
Total OPEX 2,627 Processing
26%
Notes: 1 Average LOM open pit mining cost amounts to $4.16/t mined at a 10:1 strip ratio;
average LOM underground mining cost amounts to $81/t mined (including power and
logistics).13
Annual And Cumulative Cash Flows
Annual Cash Flow Cumulative Cash Flow
700 2250
600 2000
Annual (Canadian $ millions)
500 1750
400 1500
Annual (Canadian $ millions)
1250
300
1000
200
750
100
500
0
-3 -2 -1 1 2 3 4 5 6 7 8 9 10 11 12 13 14 15 16 17 250
-100
0
-200
-3 -2 -1 1 2 3 4 5 6 7 8 9 10 11 12 13 14 15 16 17
-250
-300
Project Year
-500
Operating costs Capital costs -750
Working capital & bonding Taxes -1000
Net revenue Post-tax cash flow, annual Project Year14
Sensitivities to Gold Price and FX/ Post-Tax
NPV 5% ($M) Au price (US$/oz)
IRR (%) 1,000 1,300 1,600 1,900 2,200
(379) 178 601 1,005 1,407
0.95
-6.8% 9.3% 18.4% 25.7% 32.2%
(263) 283 721 1,146 1,570
0.90
-2.4% 11.7% 20.7% 28.1% 34.6%
(132) 397 854 1,304 1,752
0.85
1.6% 14.2% 23.1% 30.6% 37.2%
2 523 1,005 1,481 1,958
0.80
CAD to 5.1% 16.8% 25.7% 33.3% 40.0%
USD 93 625 1,126 1,626 2,125
0.76
7.3% 18.8% 27.7% 35.4% 42.2%
261 821 1,367 1,912 2,455
0.70
11.2% 22.5% 31.6% 39.4% 46.4%
408 1,004 1,590 2,176 2,760
0.65
14.4% 25.7% 34.9% 42.9% 50.0%
576 1,215 1,851 2,484 3,117
0.60
17.9% 29.2% 38.6% 46.8% 53.9%15
Sensitivities to CAPEX & OPEX / Post-Tax
NPV 5% ($M) CAPEX
IRR (%) -15.0% -10.0% -5.0% 0.0% +5.0% +10.0% +15.0%
1,371 1,343 1,315 1,286 1,258 1,230 1,201
-15.0%
35.3% 33.5% 31.9% 30.5% 29.1% 27.8% 26.6%
1,318 1,290 1,261 1,233 1,205 1,176 1,148
-10.0%
34.3% 32.6% 31.0% 29.6% 28.2% 27.0% 25.8%
1,265 1,236 1,208 1,180 1,151 1,123 1,095
-5.0%
33.3% 31.6% 30.1% 28.7% 27.3% 26.1% 25.0%
1,211 1,183 1,155 1,126 1,098 1,070 1,041
OPEX 0.0%
32.3% 30.7% 29.1% 27.7% 26.5% 25.3% 24.1%
1,158 1,130 1,101 1,073 1,045 1,017 987
+5.0%
31.3% 29.7% 28.2% 26.8% 25.6% 24.4% 23.3%
1,105 1,076 1,048 1,020 992 963 934
+10.0%
30.3% 28.7% 27.2% 25.9% 24.7% 23.5% 22.4%
1,051 1,023 995 967 938 909 880
+15.0%
29.2% 27.7% 26.3% 25.0% 23.8% 22.6% 21.6%16
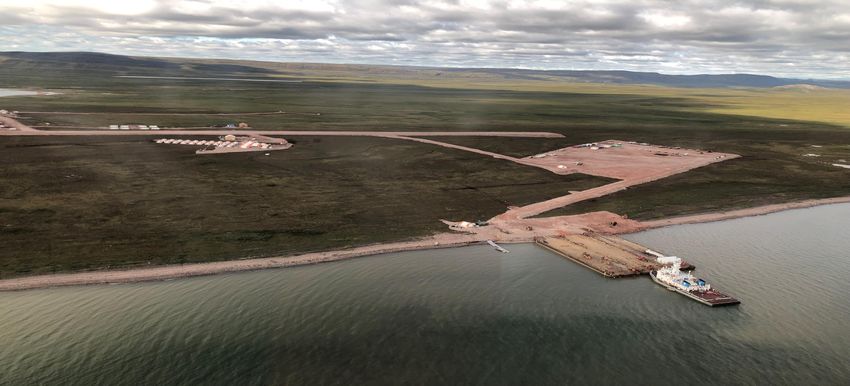
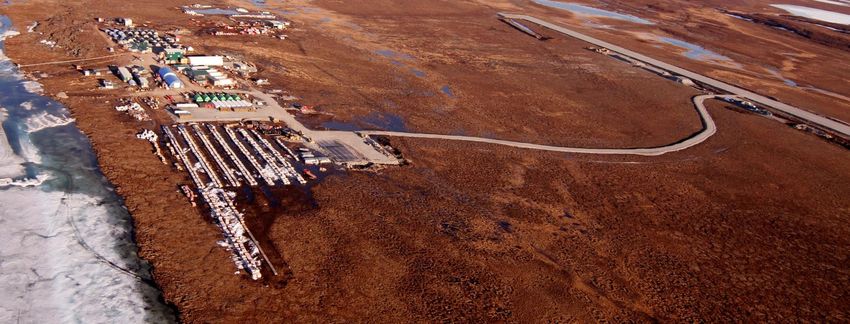
Logistics and Transportation- Port
▪ Freight shipped to Sabina Port
during summer months (July to
September)
▪ equipment and supplies stored
until winter then haul to site via
Winter Ice Road
Port ▪ Three sealifts received since
Goose Site
201817
16
Port & Marine Laydown Area – Completed 201818
KM 0 Winter Ice Road 172 km long from Port
Bathurst
Facility to Goose Property
Inlet
Project logistics - Haul equipment and supplies brought to Port via
summer sealift to Goose Property for construction and operations
Bathurst
Lake
Annual Process:
Forward Camp – 1st position
▪ Open Port camp
▪ Construct the Winter Ice Road from two headings (Port and Goose
Site) over 8 weeks
▪ Utilize “Forward Camps” – mobile camps that can be used to house
Forward Camp – 2nd position
crew along the route versus considerable daily travel back and forth
to Port
▪ Haul freight to Goose Property over 10 weeks
▪ First Winter Ice Road completed successfully in 2019
KM 17119 Winter Ice Road – “The Connector” Completed 2019
20
                    20

Goose Site Layout
21
Plant & Accommodation Complex Layout
Process Plant 3-D Model, Mineralized
Material Feed from Lower Right
Crushing and Storage 3-D Model
Mineralized Material Fed from Right to Left22
Processing – Tonnes, Grade Milled and Gold Produced
1,600 12.0
11.0
1,400
10.0
1,200 9.0
and Gold Produced (koz)
Tonnes Milled (ktonnes)
8.0
Grade Milled (g/t)
1,000
7.0
800 6.0
5.0
600
4.0
400 3.0
2.0
200
1.0
0 0.0
1 2 3 4 5 6 7 8 9 10 11 12 13 14 15
Tonnes Milled 935 1186 1460 1460 1460 1460 1460 1460 1460 1460 1460 1460 865 682 429
Gold Produced (kozs) 285 261 312 281 295 226 215 236 250 237 224 219 125 114 72
Grade Milled 10.18 7.37 7.2 6.45 6.76 5.16 4.9 5.35 5.67 5.37 5.06 4.95 4.82 5.54 5.54
Project YearMill Feed (Including Stockpile) by Quarter
Mill Feed
400,000 12.00
350,000
10.00
300,000
8.00
250,000
Tonnes
Au, g/t
200,000 6.00
150,000
4.00
100,000
2.00
50,000
- -
1 2 3 4 1 2 3 4 1 2 3 4 1 2 3 4 1 2 3 4 1 2 3 4 1 2 3 4 1 2 3 4 1 2 3 4 1 2 3 4 1 2 3 4 1 2 3 4 1 2 3 4 1 2 3 4 1 2 3 4 1 2 3 4 1 2 3 4 1 2 3 4 1 2 3 4
-3 -2 -1 1 2 3 4 5 6 7 8 9 10 11 12 13 14 15 16
Year - Quarter
High-Grade Tonnes Mid-Grade Tonnes Low-Grade Tonnes Mill Feed Target Tonnes Mill Feed Grade, g/t
2324
Permitting & Social License Achieved – UFS Project is Permitted
▪ All Major authorizations for construction and
operations received
▪ Finalized Agreements with landowner
Kitikmeot Inuit Association
▪ Will provide training, jobs, contracting
opportunities and royalty payments to
Kitikmeot Region
▪ Renewable 20- year land use lease
▪ Kitikmeot Inuit Association is an aligned
shareholder
▪ Regional wealth creation initiative
payments – creating jobs outside of the
mining industry – new precedent in
Nunavut
Widespread support from communities25 Opportunities for Further De-risking and Growth ▪ Stockpile of 2.2 Mt of mill feed and 372 koz Au ready prior to commissioning; ▪ High confidence in conversion of further resources into reserves at all deposits with a historical 73% conversion rate. ▪ All deposits in the UFS are open to depth with both new resources at Llama Extension and Nuvuyak showing significant expansion potential along trend. ▪ Sabina has advanced engagement with companies on alternative energy generation for reduced carbon footprint options; ▪ Additional time, resources and funds for testing, commissioning, start-up and ramp-up have been incorporated into the analysis; ▪ Expansion and development of the 2 M oz George Property as a second potential mine; and ▪ Strong additional discovery potential of new economic gold zones over the 80km Back River Gold District
26

Nunavut Canada – Over four decades of prosperity in mining

▪ Nunavut is well endowed with sizeable
  gold deposits

▪ Many historic and operating mines in the
  region

▪ Agnico Eagle – Meadowbank Mine, a good
  performing mine at ½ grade of Back River

▪ Agnico has two new mines in Nunavut and
  has just acquired TMAC/Hope Bay

▪ A safe jurisdiction with certainty of tenure
  and district scale opportunities
27
                                                                                                                         Back River Property

 Back River: A District Scale Gold Opportunity                                                            Port

                                                                                                   Bath                                 LEGEND
  100% OWNED BY SABINA
                                                                                                                                              Camp

 Multigenerational Mining opportunities:                                                                                                      Area of Interest

 ▪
                                                                                                                                              Claim
      5 claim blocks on the 80km belt
                                                                                                                                              Lease

 ▪    Most advanced is Goose – initial mine – 8km of iron                                                                               Inuit Owned Land
      formation                                                                                                                               Surface

 ▪    Second most advanced is George – 50 km from                                                                                             Subsurface and Surface

      Goose Mine                                            Indicated: 1.2 M oz @ 5.34 g/t
                                                            Inferred: 1.0 M oz @6.12 g/t
 ▪    Continue to generate brownfield & greenfield                                                               George Project
      targets.                                                                                                                              80 Km
 ▪    Growth to be generated internally
                                                                                                                           Boulder
                                                                                                                                        Boot

     Significant existing resources at George on 20km                                        M&I: 5.1 M oz at 6.02 g/t Au
                                                                                             Inferred: 1.8 M oz at 6.64 g/t
       of largely unexplored iron formation offering                                                                                    Goose Project
     opportunity for another mining complex on the                                                                                Del
     Back River district. As development continues at
           Goose, exploration will turn to George.
                                                                                                                                               0         12.5      25

See slides #27 & 28 for resource/reserve estimate QA/QP                                                                                               Kilometres
28
Few permitted advanced exploration projects in Canada’s North
George Property 50 km from first mine at Goose. Next area of development?
Northern Exploration Projects
Company Market
Atac Minerals - Orsis and Tiger Capitalization
Rockhaven Resources - Kaza Gold Mining Inc $320m
2
Gold Terra Resource - Yellowknife City Gold White Gold Corp $93m
White Gold - Golden Saddle/Arc 7
Nighthawk Gold $54m
Gold Mining Inc - Yellowknife Gold Project
Nighthawk Gold - Colomac 6 Gold Terra Resource $49m
Corp.
Sabina - George Project
Rockhaven $34m
Resources
Atac Resources $31m
0 1 2 3 4 5 6 7
5
4 Grade (g/t Au) Resource Ounces Gold (MOz)
Sabina’s George Project is more advanced, higher grade and
permitted for exploration. Minimal value being realized29
Back River is a Company Maker – What is Next?
Upcoming Milestones
▪ Completion of detailed
engineering 1H, 2021
▪ Debt Process being
refreshed using updated
feasibility metrics
▪ Preparing for financing
window to make a
production decision 2021
▪ Mobilizing for camp March
2021
▪ Exploration at George
(first since 2013)
Sabina is fortunate to own one of the best development projects in the sector.
Shovel ready, district scale, large, high grade and in Canada: positioned for a re-
rating once a production decision is made30
Sabina is Poised for a re-rating once a production decision is made
No Value ascribed for
▪ Multi-generational district owned 100%
by Sabina – imbedded growth
▪ Premier jurisdiction
▪ Remaining ounces in mineral resource
estimate & exploration upside
Sabina is here ▪ Compelling economics and achievable
mine plan
▪ enhancing economics and production
profile and reducing payback period
▪ Hackett River Royalty – option on silver
for the future
▪ Environmental and Social Licenses in
hand
Back River is a company maker and a coveted Project31
Capital Structure Major Shareholders Analyst Coverage
Share Price C$2.70 Zhaojin International ~9.9% BMO Andrew Mikitchook
TSX SBB Dundee Precious ~9% Canaccord Kevin Mackenzie
OTCQX SGSVF Metals Cantor Fitzgerald Matt O’Keefe
Market Cap C$870m Van Eck ~8% Cormark Brock Colterjohn
I&O ~326m Sun Valley Gold ~6% Echelon Ryan Walker
Fully Diluted ~340m Wheaton Precious ~4% Industrial Alliance George Topping
Cash (Q3, 2020) C$65m Metals National Bank Jonathan Egilo
Debt None Directors and ~1.1% Paradigm Lauren McConnell
Management RBC Wayne Lam
Sprott Brock Salier
Share Ownership Breakdown TD Arun Lumba
1.1 % Management 22.9% Strategic
Average 12-month target
price: ~C$4.00
41% Retail
35% Institutional32
Management & Board of Directors David Fennell
Nominating & Governance
Committee, HS&E Committee
Nominating & Governance
Bruce McLeod President & CEO James Morton Committee Chair, Audit
Vice-President, Finance & Committee
Elaine Bennett
CFO HS&E Committee Chair,
David Rae
Vice-President, Compensation Committee
Nicole Hoeller Communications & Walter Segsworth, Chair of Compensation Committee
the Board Chair, HS&E Committee
Corporate Secretary
Audit Committee,
Angus Campbell Vice-President, Exploration Anna Stylianides
Compensation Committee
Vice-President, Environment Nominating & Governance
Mathew Pickard Anna Tudela
& Sustainability Committee
Audit Committee Chair,
Anthony Walsh Nominating & Governance
Committee
Compensation Committee,
Leo Zhao Nominating & Governance
Combined exploration, mine Committee
development, permitting operations & D. Bruce McLeod President & CEO
capital markets experience in over 110
projects & companies33 APPENDIX
34

     Mineral Resource Estimate – December 2020
Mineral Resources are not Mineral Reserves and as such do not                                               Source: AMC, 2020.
                                                                                                            Notes:           CIM Definition Standards (2014) were used for
have demonstrated economic viability.                                                                       reporting the Mineral Resources.
Resource                                                        Grade (g/t Metal (koz                       The Qualified Person is Dinara Nussipakynova, P.Geo. of AMC
                                       Tonnes (kt)                                                          Mining Consultants (Canada) Ltd.
Classification                                                     Au)       Au)                            Measured and Indicated Mineral Resources are inclusive of Mineral
                                                                                                            Reserves.
Measured                                    9,707                  5.75     1,796                           Metal price: US$1,550 /troy oz for gold
                                                                                                            Exchange rate: 1.00 US$:1.31 C$.
Indicated                                  23,745                  5.93     4,525                           Process Recovery: Goose deposits is 93% and for George deposits
Measured and                                                                                                is 95%.
                                           33,452                     5.88                  6,321           Cut-off grade: for Goose and George deposits, open pit is 1.4 g/t Au.
Indicated                                                                                                   Goose deposits underground is 3.0 g/t Au. George deposits
                                                                                                            underground is 3.5 g/t Au.
Inferred                                   13,794                     6.44                  2,856           Goose Mineral Resources deposits are Goose Main, Umwelt, Echo,
 •    Geological and mineralization 3D wireframes were created by Sabina in Leapfrog Geo software,          Llama, Llama Extension and Nuvuyak.
      and were informed with diamond drilling intersected lithologies, alteration, sulphidation, gold       George Mineral Resources deposits are LCP North, LCP South,
      assays and structure, as well as surface mapping data. Gold domains range from two to 40 metres       Locale 1, Locale 2, GH, and Slave.
      in true thickness and occur predominantly within antiform fold hinges and limbs of oxide iron         Open pit Mineral Resources are constrained by an optimized pit shell
      formation. The number of gold domains across the property range from two at Echo to 24 at             using gold price and exchange stated above.
      Goose Main, reflecting the increase in structural complexity at the deposits.                         The George underground Mineral Resources were estimated within
 •    Ten block models were updated and two block models were created, all produced using                   mineral domains expanded to a minimum horizontal width of 2 m.
      DatamineTM Studio RM software. Block sizes within the block models vary by deposit ranging            Drilling results for Goose Main, Echo, Llama Extension and Nuvuyak
      between two and ten metres in length, width and height, and all models were sub-blocked by            are up to November 15, 2020.
      geology and mineralization. All models except the Echo deposit were rotated to align to deposit       Drilling results for Umwelt are up to October 16, 2020.
      specific mineralization.                                                                              Drilling results for Llama and all George deposits are up to
 •    Estimation was carried out predominantly by Ordinary Kriging (OK), with smaller or less populated     December 31, 2013.
      gold domains by Inverse Distance Squared (ID2). At the George Site, 2D Accumulation was utilized      The numbers may not add due to rounding.
      at the Locale 1, Locale 2, GH and Slave deposits prior to estimation. All parameters for estimation
      were informed by variography on composited intervals.
35
Mineral Reserve Estimates Jan 15, 2021
Contained
Diluted Tonnes Diluted Grade Au
Area Classification (‘000s) (Au g/t) (oz ‘000s)
Total Open Pit Proven 7,471 5.42 1,302
Probable 2,412 4.80 372
Total Underground Proven 537 7.21 124
Probable 8,272 6.73 1,790
Total Back River Proven 8,008 5.54 1,426
Property Probable 10,684 6.29 2,162
A gold price of US$1500/oz is assumed.
An exchange rate of CDN$1.31 to US$1.00 is assumed.
The numbers might not add due to rounding.
Diluted Au grades are shown/listed for both COG and Mineral Reserves.
Notes for open pit:
Dilution and recovery factors are applied as per open pit mining method.
A COG of 1.72 g/t was used on undiluted grade for the Umwelt Open Pit Mineral Reserve Estimate.
A COG of 1.74 g/t was used on undiluted grade for the Llama Open Pit Mineral Reserve Estimate.
A COG of 1.70 g/t was used on undiluted grade for the Goose Main Open Pit Mineral Reserve Estimate.
A COG of 1.60 g/t was used on undiluted grade for the Echo Open Pit Mineral Reserve Estimate
Notes for underground:
Dilution and recovery factors are applied as per underground mining method.
A COG of 3.9 g/t was used for the Umwelt underground Mineral Reserve Estimate.
A COG of 4.1 g/t was used for the Llama underground Mineral Reserve Estimate
A COG of 4.1 g/t was used for the Goose Main underground Mineral Reserve Estimate
A COG of 3.5 g/t was used for the Echo underground Mineral Reserve Estimate36
Updated Feasibility Study – QP/QA
Qualified person Company QP Responsibility/Role Authors and Qualified Persons Statement
Denis Thibodeau Sacré-Davey Executive Summary, Introduction, UG Mining,
The UFS was prepared under the direction of Sacré-Davey Engineering consultants
Engineering Infrastructure, Market Studies, CAPEX/OPEX, Other
Relevant Data, Interpretations, Recommendations,
and subject matter experts, all Qualified Persons (QP) under National Instrument 43-
References, Abbreviation 101. The QPs have reviewed and approved the content of this news release.
Jacinta Klabenes Mining Plus Underground Mining, Open pit Mining Methods, Consultants and QP are identified in the table below.
Canada Consulting Overall Production Schedule, Waste Rock Storage
Ltd Mr. Vincy Benjamin, P. Eng, PMP, and Director of Engineering for Sabina Gold & Silver
Maurice Mostert Mining Plus Underground Reserves, Open Pit Reserves Corp. is a Qualified Person within the meaning of NI 43-101 and has reviewed the
Canada Consulting technical content of this news release and has approved its dissemination.
Ltd
John Morton AMC Mining Property Description, Accessibility, History, Geology,
The Mineral Resources for the Back River Property were prepared and approved by
Shannon Consultants Deposits, Exploration, Drilling, Sample Preparation,
(Canada) Ltd Adjacent Properties
Ms. Dinara Nussipakynova P. Geo of AMC Mining Consultants (Canada) Ltd, who is
Dinara AMC Mining Mineral Resource Estimates, Data Verification independent of Sabina and a qualified person within the meaning of NI 43-101. Ms.
Nussipakynova Consultants Dinara Nussipakynova has approved the contents of this press release as it pertains
(Canada) Ltd to the estimation work and results.
Richard Cook Knight Piésold Ltd Environment, Water Management Planning, Tailings
Disposal, Closure Mr. James Maxwell P. Geo. and Director of Exploration for Sabina Gold & Silver Corp.
Amber Blackwell Knight Piésold Ltd Geochemistry is a Qualified Person under the terms of NI 43-101 and has reviewed the technical
Ben peacock Knight Piésold Ltd Geomechanical content in relation to geoscience of this press release for the Back River Property and
John Kurylo SRK Consulting Water Management Infrastructure, Tailings has approved its dissemination.
Deposition
Shervin Teymouri Sacré-Davey Market Studies and Contracts, Economic analysis Sabina Gold and Silver corporation is also grateful for the assistance from Subject
Engineering Matter Experts, PriceWaterHouse Cooper and Sacre-Davy Engineering.
Stacy Canenco Metallurgy, Recoveries, Process
Freudigmann Consulting CorpUFS Metrics
Category Unit 2015 IFS 2021 UFS Initial CAPEX C$M 415 610
Inventory Kt
Sustaining CAPEX C$M 185 377
Grade g/t 6.3 6.0
Contained koz Au 2,503 3,588 Sustaining CAPEX/Year C$M 16 25
Recovery % 93.0 93.4
Closure Cost C$M 64 41
Throughput tpd 2,882 3,670
Total Production Koz Au 2,319 3,351 Gold Price US$ 1,150 1,600
Discount Rate % 5% 5%
Average Annual Koz Au 198 223 (US$:CAD) 1 CAD = 0.80 0.76
Production LOM
NPV at build start pre-tax C$M
Yrs 1-5 avg annual Koz Au 275 287 (peak
production 312 Y3) NPV at build start post tax C$M 480 1,126
Cash Costs US$ 534 679
IRR at build start pre-tax C$M
AISC US$ 620 775
Mine Life Years 11.8 15 IRR at build start post tax % 24.2 27.7
NSR Royalties & C$M 121 354
Operating Margin % 57% 61%
Refining
UG Mining Cost C$/t mined 64 81 Annual Average FCF C$M 110 160
OP Mining Cost C$/t mined 3.35 4.16
LOM FCF C$M 782 2,026
Mining Cost C$/t ore mined 45 57
Processing Cost C$/t processed 37 37 Payback Years 2.9 2.3
Site/Off-site Services C$/t processed 15 25
Break Even post tax gold US$ 795 955
(incl freight)
price (NPV5%=0)
G&A C$/t processed 18 22
Operating cost C$/t processed 115 141
3738 Projected Life Of Mine Production Projected LOM Production Open pit ore to process kt 9,883 53% Underground ore to Process kt 8,815 47% ROM to Process – Total kt 18,698 100% Ore Grade ROM Grade to Process - O/P g/t Au 5.3 ROM Grade to Process - U/G g/t Au 6.8 ROM Grade to Process - Average g/t Au 6.0 Operating Metrics LOM Production - O/P koz Au 1,674 47% LOM Production - U/G koz Au 1,914 53% LOM Production - Total koz Au 3,588 100% Avg. Annual Production koz Au / year 223 Mine Life Years 15 O/P Strip Ratio 10:1 Mill Design Throughput tpd 3,000-4,000 Gold Recovery (LOM) % 93.4
39

                           Mined versus Milled Tonnage
                                                                                              Mined versus milled tonnage
       1800

       1600

       1400
Thousand tonnes per year

       1200

       1000

                  800

                  600

                  400

                  200

                           0
                                 -3       -2    -1          1    2            3           4   5            6          7       8         9          10         11        12   13   14   15   16   17
                           Project year        Total ore mined       Total tonnes processed       Total mined from open pit       Underground mill feed tonnes as mined
You can also read