Bomboré Gold Project Developing the Low Cost, High Margin Corporate Presentation February 2020 - Orezone Gold Corporation
←
→
Page content transcription
If your browser does not render page correctly, please read the page content below
Developing the Low Cost, High Margin
Bomboré Gold Project
        Corporate Presentation
            February 2020

              ORE:TSX.V
                1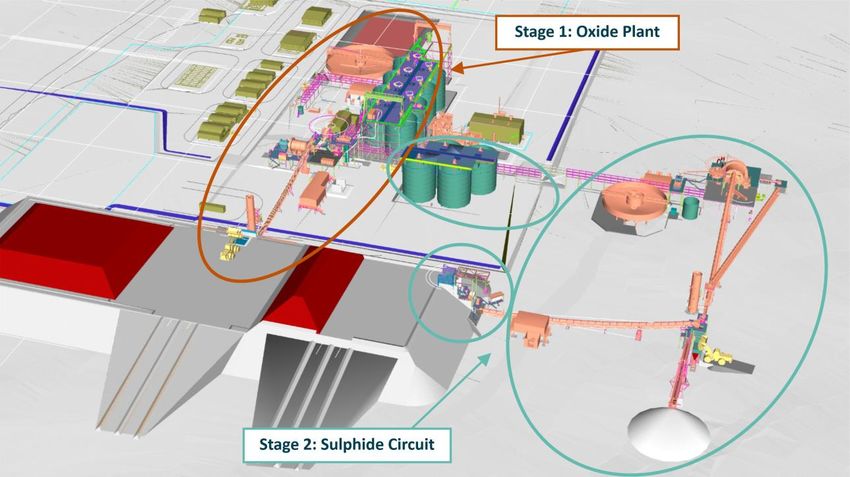
Forward Looking Statements
This presentation contains certain “forward-looking information” within the meaning of applicable Canadian securities laws and “forward-looking statement” within the meaning of applicable USA securities laws. Forward-
looking information and forward-looking statements (together, “forward-looking statements”) are frequently characterized by words such as “plan”, “expect”, “project”, “intend”, “believe”, “anticipate”, “estimate”, “potential”,
“possible” and other similar words, or statements that certain events or conditions “may”, “will”, “could”, or “should” occur.

All of the results of the Bomboré Gold Project 2019 FS as amended are forward-looking statements. These include statements regarding, among others, completion of the Phase I RAP in Q1-2020; approval of the updated ESIA by
early 2020; first gold pour in June 2021; oxide commercial production starting in Q4-2021; sulphide feed commencing in Q1-2024; and applicable construction timelines. In addition, forward-looking statements include statements
with respect to: pre-tax NPV5% of $513.5M and IRR of 61.9% of with a 1.5 year payback (IRR and NPV calculated from start of commercial production); after-tax NPV5% of $361.0M and IRR of 43.8% with a 2.5 year payback; mine
life of 13+ years with LOM gold production of 1.6M ounces and average annual production of 133.8k ounces in the first 10 year s; initial project construction costs estimate at $153.0M; LOM expansion capital costs of $63.2M;
LOM sustaining capital costs of $66.2M; and LOM cash costs of $681/oz with cash costs of $629/oz in the first 10 years; and LOM AISC of $730/oz with AISC of $672/oz in the first 10 years (AISC excludes Corporate G&A).
Furthermore, statements regarding mine plan and production; mineral processing; project infrastructure; project economics; initial project capital costs; development and timeline timetables; and project opportunities are
forward-looking statements.

All such forward-looking statements are based on certain assumptions and analyses made by management and qualified persons in light of their experience and perception of historical trends, current conditions and expected
future developments, as well as other factors management and the qualified persons believe are appropriate in the circumstances. The forward-looking statements are also based on metal price assumptions, exchange rate
assumptions, cash flow forecasts, and other assumptions used in the 2019 FS. Readers are cautioned that actual results may vary from those presented.

In addition, all forward-looking statements are subject to a variety of risks and uncertainties and other factors that could cause actual events or results to differ materially from those projected in the forward-looking statements
including, but not limited to, use of assumptions that may not prove to be correct, unexpected changes in laws, rules or regulations, or their enforcement by applicable authorities; the failure of parties to contracts to perform as
agreed; social or labour unrest; changes in commodity prices; unexpected failure or inadequacy of infrastructure, the possibility of project cost overruns or unanticipated costs and expenses, accidents and equipment
breakdowns, political risk, unanticipated changes in key management personnel and general economic, market or business conditions, the failure of exploration programs, including drilling programs, to deliver anticipated results
and the uncertainties relating to the availability and costs of financing needed in the future, and other factors described in the Company’s most recent annual information form and management discussion and analysis filed on
SEDAR on www.sedar.com. Readers are cautioned not to place undue reliance on forward-looking statements.

This presentation also contains references to estimates of Mineral Resources and Mineral Reserves. The estimation of Mineral Resources is inherently uncertain and involves subjective judgments about many relevant factors.
Mineral Resources that are not Mineral Reserves do not have demonstrated economic viability. The accuracy of any such estimates is a function of the quantity and quality of available data, and of the assumptions made and
judgments used in engineering and geological interpretation, which may prove to be unreliable and depend, to a certain extent, upon the analysis of drilling results and statistical inferences that may ultimately prove to be
inaccurate. Mineral Resource estimates may have to be re-estimated based on, among other things: (i) fluctuations in the price of gold; (ii) results of drilling; (iii) results of metallurgical testing, process and other studies; (iv)
changes to proposed mine plans; (v) the evaluation of mine plans subsequent to the date of any estimates; and (vi) the possib le failure to receive required permits, approvals and licenses.

Although the forward-looking statements contained in this presentation are based upon what management of the Company believes are reasonable assumptions, the Company cannot assure investors that actual results will be
consistent with these forward-looking statements. These forward-looking statements are made as of the date of this presentation and are expressly qualified in their entirety by this cautionary statement. Subject to applicable
securities laws, the Company does not assume any obligation to update or revise the forward-looking statements contained herein to reflect events or circumstances occurring after the date of this presentation.

Orezone has filed an independent National Instrument 43-101 technical report entitled “NI 43-101 Technical Report (Amended) Feasibility Study of the Bomboré Gold Project, Burkina Faso”. A copy of the technical report is
available on SEDAR (www.sedar.com), the Company’s website (www.orezone.com) and the results were summarized in Orezone’s June 26, 2019 News Release.

Pascal Marquis, Geo., Senior Vice President of Exploration, Patrick Downey, P.Eng, President & Chief Executive Officer and Ian Chang, P.Eng, Vice President of Projects are the Company’s qualified persons under NI 43-101, who
have reviewed and verified the technical information in this presentation.                                                                                                        2                                                         2
Investment Highlights

 Located in a leading gold development country with 13 producing gold mines

 Permitted, advanced development project with robust economics at USD $1,300/oz Au

 Staged development – focused on a project scale that Orezone can finance and build

 Strong management team and board with extensive experience in mine development and
 operations in West Africa

 Committed to corporate stewardship and strong relationship with communities

 Sophisticated and supportive shareholders including RCF who own 19.99%

                                                                  3                   3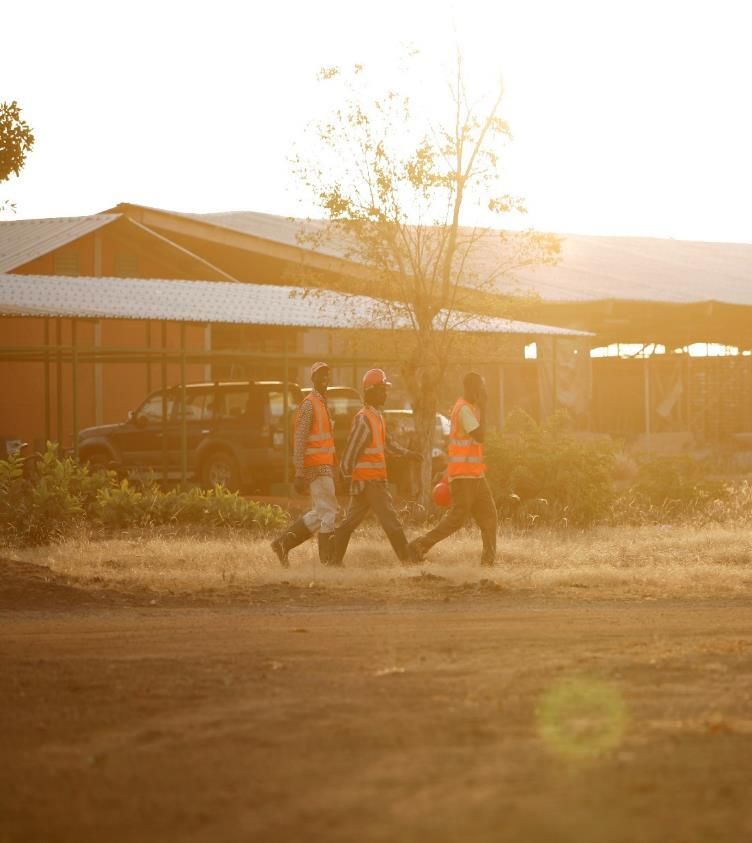
Burkina Faso: An Established Gold District

 Supportive mining jurisdiction
 • 13 gold mines in production
 • 1 gold mine in construction
 ~10Moz gold within 15km of Bomboré*
 • West African Resources: Sanbrado
 • B2 Gold: Toega
 • New high-grade gold discoveries
     in this emerging district
 Bomboré is ideally located
 • 90 minute drive from the capital
 • Ease of security and logistics

 *From most recent B2 and WAF public disclosure   4   4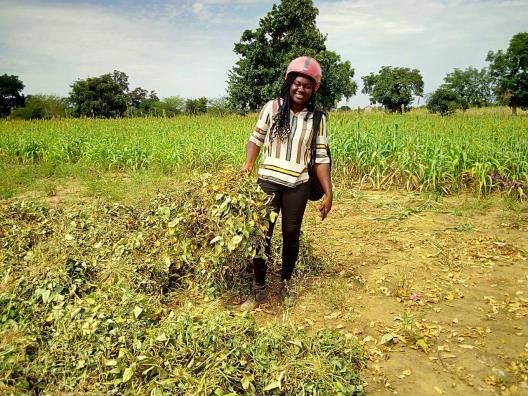
Bomboré Location & Local Infrastructure
Located 85 km (90 min) from the capital
city along a major paved highway
Secure location within proximity to main
local and international military training
facility
5 km from town of Mogtédo with a
population of 15,000; easy access to
skilled local workforce, housing and
logistics
Excellent infrastructure with majority of
support facilities in place: camp, offices Access Road Bomboré Camp
and warehouse facilities
5 5
West Africa Gold Production 2010 vs 2019
                 Production Growth from 2010 to 2018 By Region                                                                      2010 and 2018 Ounces by Region

     80%
               69%        66%                                                                                                       Asia

     60%                             54%                                                                     Central & South America
                                                50%

                                                                                                                         North America
     40%
                                                           28%
                                                                                                                   Independent States
     20%
                                                                      11%        11%
                                                                                                                                Oceania

       0%                                                                                                                   West Africa

                                                                                                                           South Africa
     -20%

                                                                                                                                 Europe
     -40%
                                                                                            -38%                                           0           5          10          15     20   25

     -60%                                                                                                                                      2010 Ounces      2018 Ounces

                                     Since 2010, West Africa is the fastest growing jurisdiction for gold production
                                                                                                                                                           6
Source: World Gold Council. West Africa includes: Ghana, Mali, Burkina Faso, Ivory Coast, Guinea, Senegal and Nigeria https://www.gold.org/goldhub/data/historical-mine-production
                                                                                                                                                                                               6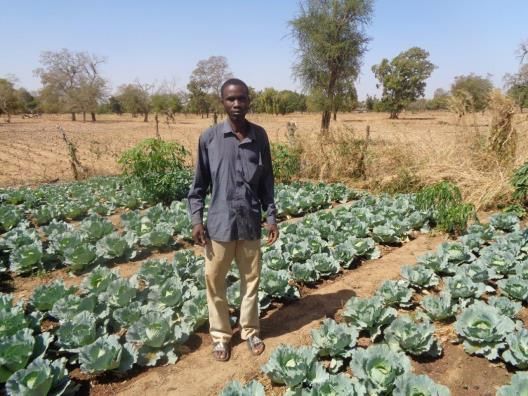
Capital Intensity & AISC vs Peers
                         Capital Intensity USD$/oz                                                                                        AISC USD$/oz
$300.00
                                                                                                                                                                                  $1,234
                                                                                                 $244/oz

$250.00                                                                                $222/oz
                                                                                                                                                              $991

$200.00
                                                                           $165/oz                                   $730                 $756
               Average: $154/oz
                                              $138/oz $138/oz
$150.00
                               $120/oz $125/oz

$100.00
                $79/oz
                                                             Continental
                                  Orezone

                                                                                                   Pure Gold
 $50.00
                    Belo Sun

                                                  Lundin

                                                                              Sabina

                                                                                         Falco
                                            WAF

  $0.00
                                                                                                                   Orezone           West Africa            Americas              Africa
                   Open Pit                                Underground
  Based on most recently available public company filings. Capital Intensity is calculated by                  Data from public company disclosure. Based on 2018 reported actual AISC on an
  taking Project Capex (Orezone oxide and sulphide) in USD/P+P oz of gold.                                     asset-level basis. Orezone reports LOM AISC.

                The technical simplicity of projects in West Africa result in lower capital intensity than in other regions
           Orezone has done extensive benchmarking of project costs and Bomboré is consistent with its West African peers
                                                                                                                                                        7                                      7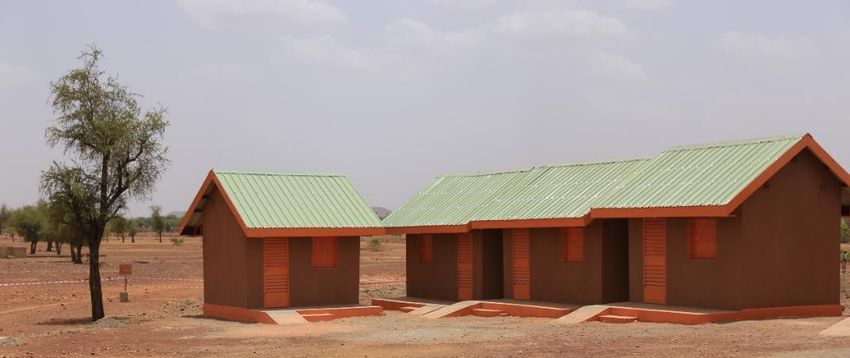
Sulphide Expansion:
2019 Feasibility Study Focus
  Identified P17S high-grade sulphide zone

  Several additional high-grade sulphide zones
  contained within main ore body

  Staged sulphide expansion with production
  commencing in Year 3 of oxide operations

  Sulphide expansion funded from oxide cashflows

  Significantly improves the overall gold production
  profile and project economics

                                                       8   8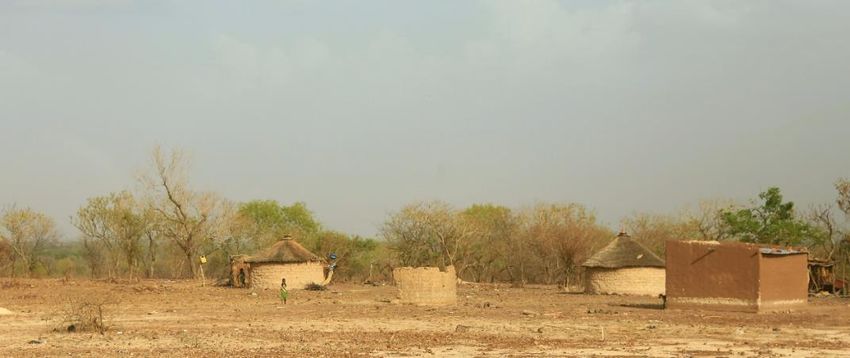
2019 Feasibility Study Highlights
   After-tax NPV5% of $361.0M(1), IRR of 43.8%                                                                                                                Description               2019 FS
                                                                                                                                         Base Case Gold Price (US$/oz)                   1,300
   • 2.5-year payback                                                                                                                    Mine Life (years)                                13.3
   Mine life of 13+ years with:                                                                                                          Total Waste Tonnes Mined (Mt)                   164.4
                                                                                                                                         Total Ore Tonnes Mined (Mt)                      70.1
   • LOM gold production of 1.6M ounces                                                                                                  Strip Ratio                                      2.34
   • Average annual production of 133.8k oz in the first 10 years                                                                                              Production
                                                                                                                                         Processing Annual Throughput (Mt)                 5.2
   Initial oxide construction cost: $153.0M                                                                                              Total Gold Ounces Recovered (ounces)           1,599,569
                                                                                                                                         Average Annual Gold Production (ounces)         117,760
   Sulphide expansion capital cost: $63.2M                                                                                                                     Operating Costs
   • Commences in Year 2 of oxide production                                                                                             Unit Operating Costs ($ per tonne processed)    15.53
                                                                                                                                         Cash Costs ($/ounce)                             681
   • Funded from oxide cash-flow                                                                                                         AISC ($/ounce)                                   730
   AISC(2) of $672/oz for the first 10 years                                                                                                                   Capital Costs            2019 FS
                                                                                                                                         Initial Construction Costs ($M)                 153.0
   • In-line with other West African gold producers                                                                                      Expansion Capital Costs ($M)                     63.2
                                                                                                                                         Sustaining Capital Costs ($M)                    66.2
   First gold pour targeted for H2-2021
                                                                                                                                         Closure Costs ($M)                               17.9
All figures in USD unless otherwise stated. USD$1,300/oz gold price used. All numbers are on a 100% project basis.                                             Financials 3,4
1.       Discounted to the planned start of commercial production of October 1, 2021
2.       AISC excludes Corporate G&A
                                                                                                                                         Pre-tax NPV(5%)(millions)                       513.5
3.       Represents total project cash flows net of government royalties and taxes. The Government of Burkina Faso benefits from a 10%   Pre-tax IRR                                     61.9%
         free-carried interest, sales royalties (4% NSR between $1,000 and $1,300 Au), Local Development Mining Fund tax (1% NSR),
         corporate income tax (27.5% tax rate), fuel taxes, VAT and withholding taxes on services.                                       Post-tax NPV(5%)(millions)                      361.0
4.       Exchange rate assumptions: XOF:USD = 550; USD:EURO = 1.19; XOF:EURO = 655.957; Fuel price delivered to site: Diesel =
         $1.05/litre; Heavy-Fuel Oil = $0.62/litre.                                                                                      Post-tax IRR                     9              43.8%      9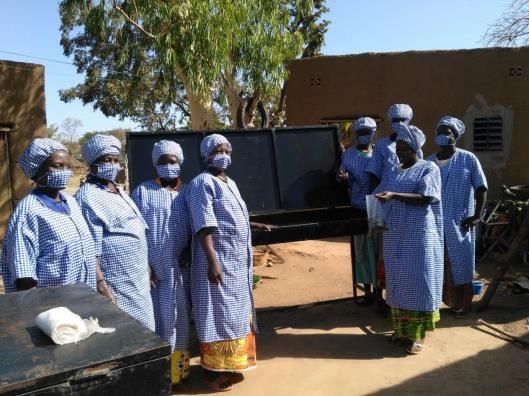
Combined Processing Plant
                                                                              Oxide plant capacity of 5.2Mtpa
                                                                              • Oxide feed reduced to 3Mtpa upon
                                                                                commissioning of the sulphide
                                                                                circuit

                                                                              Sulphide circuit capacity of
                                                                              2.2Mtpa
                                                                              Both the oxide and sulphide
                                                                              circuits are completely
                                                                              independent
                                                                              Leach circuit design allows for
                                                                              additional tanks
                                                                              ADR plant has excess capacity

        Oxide and Sulphide circuits are independent providing additional operational flexibility
                                                                                10 of the oxide plant
  The construction of the sulphide expansion will not disrupt the normal operations                             10
2019 FS - After-Tax Free Cash Flow
200 After-Tax Free Cash Flow 600
Millions
(at USD $1,300/oz Au)
After-Tax Cumulative Cash Flow (Millions)
150 (based on 2019 FS)
400
After-Tax Free Cash Flow (Millions)
100
200
50
0 0
Pre-Prod. Year 1 Year 2 Year 3 Year 4 Year 5 Year 6 Year 7 Year 8 Year 9 Year 10 Year 11 Year 12 Year 13 Year 14
-50
-200
Phase II
-100 Sulphide
Expansion
-400
-150
-200 -600
After-tax Free Cash Flow remains positive during the construction of Phase II Expansion
11 11Evolving Geological Interpretation
12Evolving Geological Interpretation – High-Grade Hits
Maga
Historical drilling identified several high-grade intercepts
Higher-grade intercepts did not connect when modelled
CFU
using the steeply dipping main shear footwall
P8P9
interpretation
P11
The discovery of the high-grade P17S zone prompted a
reassessment of the continuity of these higher-grade hits
P17N
Siga
• Higher-grade plunging folds at 22 degrees vs 55 degree dip
P17
P16 • Drilling between 2017-2019 confirmed this new interpretation
P17S
P13 Resource modelling incorporating this new interpretation
is well-advanced
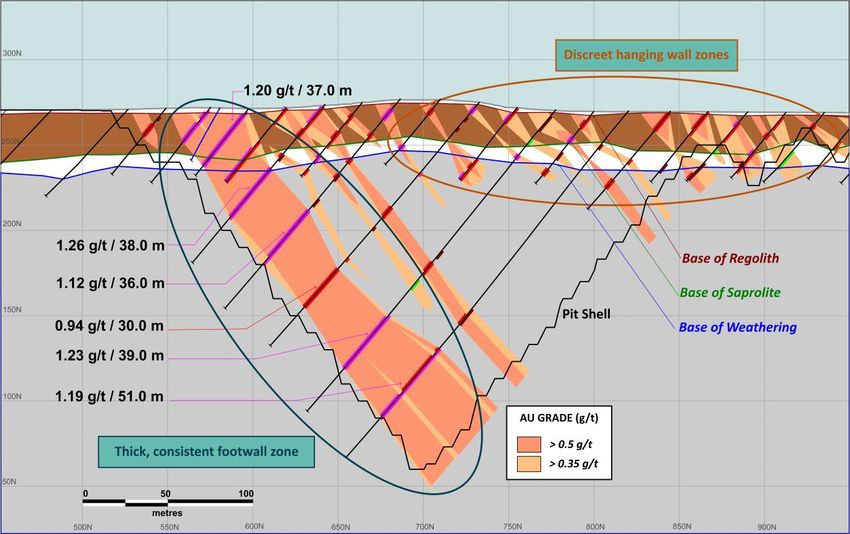
13 13Evolving Geological Interpretation – Hanging wall
Siga South Deposit – Section 10600N New geological interpretation of
the hanging wall folded zones is
expected to improve their
continuity and the metal
inventory
The footwall zone is well-defined
and understood
• Along the western side of a +13 km
shear-zone
• Significant portion of Bomboré’s
resources are within the footwall
zone
• Interpretation in this area remains
essentially unchanged
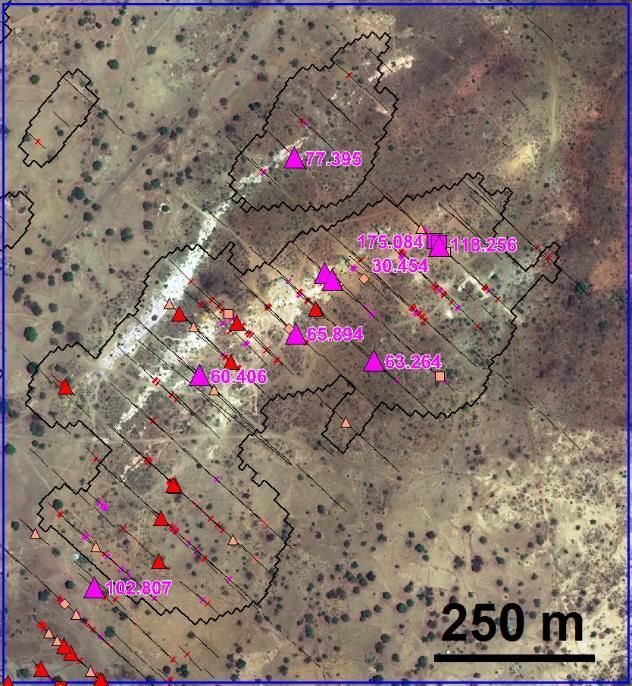
14 14Evolving Geological Interpretation,
High-Grade Plunging W
A high-grade plunging W shaped fold was first identified at P17S in 2017
Artisanal miners were extracting high-grade at Maga, CFU, P8/P9 and Siga East
P17S 1 1 2
Maga
2
CFU
3
P8/P9 4
3
4
Siga E
15 152018 Drill Results - CFU and P11
Hole From To Length Grade
CFU high-grade follow-up (m) (m) (m) (g/t Au)
oxide drilling targets BBC4580 30 35 5 3.2
Incl. 1 10.7
Maga BBC4615 20 22 2 6.4
Incl. 1 10.4
BBC4620 30 33 3 4.19
CFU
Incl. 1 11.9
P8P9 BBC4647 3 6 3 5.4
Incl. 1 12.7
P11 BBC4678 48 56 8 2.2
Incl. 1 10.2
P17N
Siga W-E BBC4679 24 30 6 2.6
Incl. 1 12.2
Siga S
P17 BBC4695 2 7 5 7.8
Incl. 1 36.4
P16 BBC4696 19 23 4 3.6
P17S Incl. 1 12.4
BBC4716 3 8 5 10.27
Incl.16 1 45.8 16P16 Down-Plunge Potential
P16 mineralized zone plunging North, open at depth, potential HG ore shoots
6m @ 5.0 gpt
12m @ 2.5 gpt
9m @7.6 gpt
13.5m @ 2.9 gpt
6m @ 7.6 gpt
12m @ 15.3 gpt
Multigram and
6m @ 4.7 gpt
5m @ 5 gpt multimeter drill intercepts
15m @ 5.9 gpt
9m @ 2.7 gpt following a fold nose –
16.5m @ 9.1 gpt
15.5m @ 3 gpt None of which are
5m @ 16.5 gpt
19m @ 5.6 gpt included within the
23m @ 5.1 gpt current resources
The new geological interpretation along with the high-grade drill results from 2017-2019
will be incorporated into a new resource estimate in 202017 172019 Maga Drilling
The 2019 RC and diamond drilling programme was designed
to test and validate the refined geological interpretation
All holes in the ~2,000 m programme intersected the
high-grade plunging gold mineralization
2019 Highlight Drill Results
From To Length Grade
Hole #
(m) (m) (m) (g/t) Au
BBD1034 122.80 131.70 8.90 3.21
incl. 127.70 128.70 1.00 16.25
BBC4995 8.00 16.00 8.00 3.04
incl. 9.00 12.00 3.00 5.71
BBC4996 27.00 45.00 18.00 3.68
incl. 34.00 42.00 8.00 7.31
BBC4997 35.00 39.00 4.00 3.74
incl. 35.00 36.00 1.00 13.35
BBC4999 22.00 33.00 11.00 1.89
incl. 29.00 33.00 4.00 4.53
BBC5000 38.00 50.00 12.00 3.09
incl. 39.00 45.00 6.00 5.16
True width for the 2019 Maga area drilling is approximately 90% of the drill length. 18 18Enhancement Opportunities
New drilling and resource modeling is expected to:
1. Extend mine life
2. Add higher grade ounces within existing pits
3. Increase M&I resource in near-surface oxides
4. Improve existing production profile – more reserve ounces in same annual range
Resource Modeling of Higher-Grade Plunging Folds, Regional Exploration to Replace
1 Improve Metallurgical Recoveries, Reduce Mining Dilution 2 Low Grade Stockpiles
180 1.02 1.03 1.01 110%
0.97 0.96
0.91 0.89 0.88
160 0.85 0.85 85.8% 85.8% 78.7% 90%
Recovered Gold (k oz)
140 92.3% 92.3% 91.2% 88.7% 88.7% 87.2% 85.0% 86.0% 85.4% 85.3%
120 0.78 0.62 83.9% 70%
80.1%
0.50
100
0.40 0.37 50%
80 149.7
138.6 144.2 139.5
60 125.8 126.3 121.8 121.6 30%
112.1
40 158.6 88.5
70.3 10%
53.6
20 36.6 12.3
0 -10%
Pre-prod. Year 1 Year 2 Year 3 Year 4 Year 5 Year 6 Year 7 Year 8 Year 9 Year 10 Year 11 Year 12 Year 13 Year 14
Recovered gold (koz) Recovery rate (%) Head grade (Au g/t)
19 19Security
20 20International views of Burkina Faso
French USA, Canada and Australia
The areas of higher risk remain in the border regions where smuggling is prominent and government presence is sparse
Countries further from Burkina with less presence in country have a more conservative travel advisory
The Bomboré project is in the safer region on both maps
21 21Regions of Terrorism Activity
France, Burkina Faso, Mali, Niger, Chad and Mauritania agree to a joint
command structure to tackle insurgency
France commits an additional 220 troops in addition to the 4,500 troops already in the Sahel
Bomboré
Bomboré
Bomboré
April 2019 December 2019
No evidence of territorial expansion
Terrorist activity is constrained to the north and east regions
where vegetation provides cover or where an escape route across regional boundaries is possible
22 22Security Advantages of Bomboré
85 km from the capital of Ouagadougou
2 paved road options - both main service roads
Asphalt on both routes in good condition - very low likelihood of IED
Active military presence on both routes
Few critical infrastructures
Active occupied military shooting range - used by French and local BF forces
Cell coverage for the entire trip to site
Sparse vegetation around the project
The project is not located in a region that has historically been subject to banditry,
smuggling nor illegal artisanal miners
Many factors work in Bomboré’s favor to make it one of the safest mining operations in Burkina Faso
23 23“RAP”
Resettlement Action Plan
24RAP – Construction Overview & Update
RAP Phase 1 is progressing well with
construction to be completed in
Q1-2020 and final relocation in
Q2-2020
• ~1,100 houses in construction RAP Opening Ceremony, May 2019
Attended by Burkina Faso’s Prime Minister and
• Community infrastructure including over 3,000 locals
schools, clinics, churches and mosques
being constructed in seven villages
All locally based contractors
All access roads to villages in place
25 25Phase 1 - RAP
Natinga Construction Koksin Completed Dwellings Koksin Completed Dwellings
Current Houses RAP Sample Houses
26 26Phase 1 - RAP
RAP Construction
Latrines School
RAP Construction Clinic
Mosque
27 27CSR
28 28Livelihood Restoration Programs
Programs
• Market gardens developed - agro-economist hired - additional gardens being developed
• Speciality cash crops being developed - spices, shea butter
• Chicken farming commenced - self funding and very successful to date
• Reclamation including tree and shrub plantations developed - part of ongoing reclamation and
closure
29 29Orezone Community Initiatives
Provision of seeds for crops Maternity ambulances Ambulance
Spice growing Agricultural reservoir Land reclamation
30 30Orezone Community Initiatives
Harvesting Sesame Harvesting Fodder Soap Manufacturing
Producing Spices Market Garden Planting Trees
31 31Summary
32Orezone: A Refocused Story
Since 2017, Orezone’s new management has delivered on all its objectives
Changed the Development Strategy to a Staged Approach
Focused on Project Scale Orezone can Finance and Build
Delivered a Robust Oxide only Feasibility Study
RCF joined as a Supportive Shareholder
Delivered an Updated Feasibility Study with Sulphide Expansion
Continue to Review Enhancement and Expansion Opportunities
Commence Project Development for 2021 Start-Up
33 33Capital Structure & Research Coverage
12-Month Share Price & Volume
Capital Structure (as at Jan. 30, 2020) 1400000 $1.00
1200000 $0.80
Shares Issued 250,972,806 1000000
800000 $0.60
Warrants 18,797,950 600000 $0.40
400000
$0.20
Options 16,376,838 200000
0 $0.00
Shares Fully Diluted 286,147,594
Cash (as at Jan. 30, 2020)(no debt)(unaudited) USD~$23.5M USD
Volume Close
Market Cap (as at Jan. 30, 2020 close on TSX.V) CAD~$120M
Major Shareholders Equity Research Coverage
• RCF 19.99% Brokerage Analyst Phone
• Insiders are substantial holders of ORE Canaccord Kevin MacKenzie 604-643-7357
• Van Eck
• Sun Valley Cormark Securities Tyron Breytenbach 416-943-6747
• Mason Hill Paradigm Capital Don Blyth 416-360-3461
• American Century PI Financial Chris Thompson 604-718-7549
• Coris Bank
Analyst average target-price is CAD$1.41
Orezone has a strong, supportive and sophisticated shareholder base including RCF who are a 19.99% shareholder
34 34Summary
Project financing discussions well-advanced
• Debt advisors are Cutfield Freeman
• Completed CAD$20.3M equity bought-deal in Jan. 2020
• RCF exercised its full pro rata right and owns 19.99% of ORE
Development schedule progressing well
• FEED completed
• RAP Phase 1 construction ongoing and on-track for
completion in Q1-2020 with final relocation in Q2-2020
Geological reinterpretation
• Resource update scheduled for H1-2020 and will
incorporate high-grade results from 2017-2019 drilling
Rainy Season
Project optimizations identified
• Orezone continues to evaluate opportunities to improve
Bomboré through exploration, resource conversion,
grade control and metallurgical improvements
35 35Appendix
36Management
Patrick Downey – President, CEO & Director Nick Parisot – Security Manager
• Engineer with +30 years resource industry experience • Over 10 years experience providing security in Africa and high risk locations
• Previously President, CEO & Director of Elgin Mining, Aura Minerals and Viceroy Exploration • Non-commissioned Officer, Section Commander Worldwide – French Marines
before its acquisition by Yamana Corps, Airborne Regiment and 6th RPIMa Light Infantry section commander
• Formerly a director of Claude Resources, Victoria Gold and Dalradian
Peter Tam – CFO Ian Chang – VP, Projects
• CPA and CFA, +25 years experience in senior-level finance roles
• Mechanical Engineer, +33 years experience
• Previously VP Finance of Nevsun, CFO of Elgin Mining, VP Finance of Aura Minerals and
• Previously Chief Development Officer for Lion One Metals and prior to that was VP,
Treasurer for Thompson Creek Metals
Project Development for Pretium Resources and managed the feasibility study,
EPCM of the CDN$1 billion Brucejack project
Pascal Marquis – Senior VP, Exploration • Worked as Project Director and Head of Project Management for Fluor Canada and
• Geologist with +30 years experience with major and junior companies – extensive was responsible for the EPCM contract for Vale’s
experience in Africa
• Leading role in the exploration and development of Essakane
Mark Humphery – Project Director
• Has worked with Orezone since 2002
• Mechanical Engineer, +25 years experience
• Previously General Manager, Projects and Senior Construction Manager at Alufer
Louis Archambeault – VP Corp. Dev. & Strategy Mining’s Bel Air Bauxite mine in Guinea
• Over 15 years capital markets and finance experience
• Worked in Burkina Faso in senior engineering, project implementation and
• Previously was Director of Corp. Development for Goldcorp construction roles
• Was with CIBC Mining Investment Banking for 6 years
Ryan Goodman – VP Legal and Administration André Baya – General Manager, Orezone Bomboré SA
• Over 16 years experience working with mining companies specializing in financings, • Over 20 years experience managing companies in 6 different African counties
M&A and corporate governance Previously worked with Sundance Resources, Cominco, AMC and Roxgold
• Previously VP Legal Affairs of Aura Minerals
Orezone has assembled a world-class management team
37 37Directors
Michael Halvorson - Chairman Charles Oliver - Director
• Over 50 years experience in the securities industry • Over 30 years experience as an award-winning fund manager
• President of Halcorp Capital, a private investment corporation, since 1980 • Previously with Sprott Asset Management as the Lead Portfolio Manager
• Past director of Viceroy Exploration, Western Silver, Novagold Resources, of the Gold and Precious Metals Fund and prior to that, Mr. Oliver was at
Esperanza Silver, Pediment Exploration and Fission Energy AGF Funds where he was Senior Vice President and Lead Portfolio
Manager
Ronald Batt - Director • Current board member of Cabral Gold and previously was on the Integra
• 35 years experience as a Chartered Professional Accountant and retired Senior Gold board until its acquisition by Eldorado Gold and with Klondex Mines
Partner with Ernst & Young until its acquisition by Hecla Mining
• Extensive experience in cross border tax issues, international structures, mergers
and acquisitions and other corporate reorganizations Marco Locascio - Director
Stephen Axcell - Director • CEO of Adia Resources Inc.
• 38 years experience as an engineer in mining operations management, project • Former portfolio manager and analyst of 11 years at Mason Hills Advisors
management execution, process plant design and construction management focusing on precious metals equities
• Previously Senior VP for Jacobs and before that worked with Debswana Diamond
Company in Botswana and has experience in greenfields and brownfields projects Kate Harcourt - Director
throughout Asia, Africa, USA, Canada, South America, Europe and the Middle East
• Sustainability professional with over 30 years experience, principally in
Joseph Conway - Director mining with extensive project and permitting experience in Africa
• Geologist with over 30 years mining and financial experience • Worked with numerous mining companies on behalf of Equator Principles
• Previously Primero Mining’s Executive Vice Chairman and CEO prior to its signatory financial institutions and has consulted on assignments for the
acquisition by First Majestic Silver Corp. International Finance Corporation
• Prior to Primero, Mr. Conway was President & CEO of IAMGOLD Corporation • Currently is a non-executive director of Condor Gold plc and Roxgold Inc.
Orezone’s board is strategically composed with experts in the fields that are relevant to
Bomboré successfully reaching commercial production
38 38For more information,
please contact Vanessa Pickering,
Manager, Investor Relations:
info@orezone.com
Tel: 778-945-3974
39You can also read