IMPROVING AUSTRALIA'S LIGHT VEHICLE FUEL EFFICIENCY - Briefing Paper February 2014
←
→
Page content transcription
If your browser does not render page correctly, please read the page content below
IMPROVING
AUSTRALIA’S
LIGHT VEHICLE
FUEL EFFICIENCY

Briefing Paper
February 2014
                  1
Executive summary
Improving the fuel efficiency of Australia’s light         >> The financial benefit to light vehicle owners of
vehicle fleet can deliver substantial environmental           introducing best practice standards is significant. If
and broader economic benefits.                                efforts in the European Union are targeted with a 4
                                                              year lag, by 2020 an average driver could pay up to
This briefing paper builds on the significant amount
                                                              $170 per year less for fuel than they do today, and
of work already undertaken on this issue over the
                                                              within 10 years they would pay up to $410 less than
past decade by government, industry, consumer
                                                              they pay today, even factoring in rising fuel prices.
groups and others.
                                                           >> While improving fuel efficiency means higher
Despite these efforts, Australia lags behind most
                                                              upfront costs for car buyers, with a conservative
other developed economies in introducing regulated
                                                              estimate of $2,500 per vehicle for a 50% efficiency
vehicle fuel efficiency standards, commonly referred
                                                              gain in 2024, our analysis indicates that average
to as CO2 emission standards because of the direct
                                                              car owners would recover these additional costs
correlation between reducing fuel use and reducing
                                                              within 3 years through fuel savings, well within
CO2 emissions.
                                                              the average length of vehicle ownership of about 5
International experience shows that in order to               years. This results in net annual savings of $352 for
capture the broad range of benefits from improved             average drivers over this 5 year ownership period.
fuel efficiency, a suite of measures needs to be
                                                           >> The broader economic benefits are also tangible.
developed and implemented in collaboration with all
                                                              Within 10 years, we could save up to $7.9 billion
stakeholders.
                                                              per year across our economy through reduced fuel
Best practice light vehicle CO2 emission standards            use.
and relevant complementary measures must be
                                                           >> Further, fuel efficiency helps to enhance Australia’s
designed with a focus on maximising a range of
                                                              fuel security, with fuel demand reducing under best
positive outcomes - financial savings for vehicle
                                                              practice standards by between 40 and 66 million
owners, improved energy security, and least cost
                                                              barrels per annum in 2024, equivalent to 30%-50%
emissions reductions. Best Practice standards could
                                                              of all automotive fuel used in Australia in 2012.
see the fuel efficiency of Australia’s new light vehicle
fleet improved by over 50% within 10 years.                >> Of all the opportunities identified in ClimateWorks’
                                                              Low Carbon Growth Plan for Australia, reducing
ClimateWorks Australia is calling on the Federal
                                                              emissions from cars and light commercial vehicles
Government within the next two years to work
                                                              through improved fuel efficiency presents the
with industry and consumer groups to design and
                                                              lowest cost opportunity to reduce emissions across
introduce best practice light vehicle CO2 emission
                                                              our economy, and could deliver reductions of 4 Mt
standards and supporting complementary measures
                                                              CO2e in 2020 and 8.7 Mt CO2e in 2024, equivalent to
that maximise the economic and environmental
                                                              taking 2.2 million cars off the road in 2024.
benefits available.
                                                           >> A partnership approach is required to ensure
This Briefing Paper highlights that:
                                                              a robust solution is developed that delivers
>> Australian new light vehicles have improved                the optimal benefits to consumers and the
   in efficiency by 20% since 2002. However, at               environment, and current inertia can be overcome.
   an average of 199 gCO2 /km our cars and light
   commercial vehicles are still far less efficient than
   those in most developed economies.
>> Three-quarters of all new cars sold globally
   each year are regulated under some form of
   CO2 emissions standard, and without standards
   in place, Australia will fall further behind other
   developed economies.

    2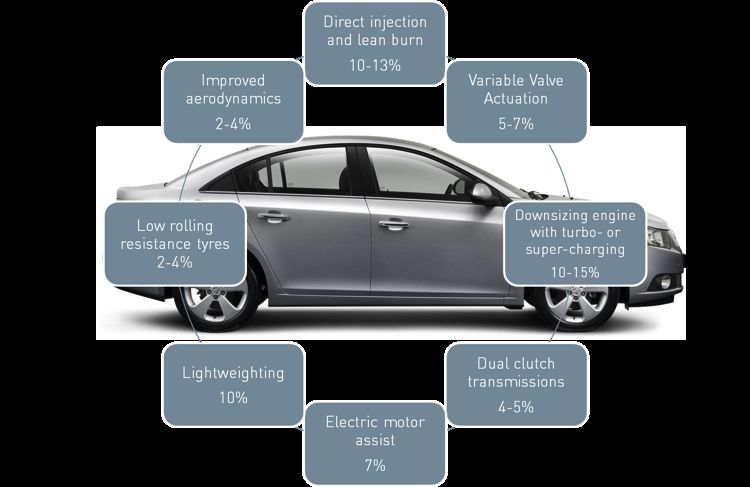
Improving Australia’s vehicle
    fuel efficiency
    How adopting light vehicle CO2 emission standards can
    cut fuel use and save households and businesses money

          There is a direct correlation between improving fuel efficiency and reducing carbon (CO2) emissions.
          Australia currently lags behind most of the developed world in introducing light vehicle CO2 emissions
          standards, with 3/4 of all new cars sold globally covered by standards.

OUR CURRENT/PROJECTED PERFORMANCE & OPPORTUNITY

Without standards in                                                                        Best practice              Best practice

                                  AUSTRALIA
                                                                                          target for 2020            target for 2024
place, Australia will
fall further behind                         207                 175                               130                      95

other developed
economies, at
substantial cost                  USA                 190                                               121

                                  EUROPE
to consumers.
Introducing standards that                                                                  135                            95
adopt international best

                                  CHINA
practice will address this gap.

130 gCO2/km emissions level                                    176                                            117

   2011
   2020 business-as-usual         LEAST EFFICIENT                                                                    MOST EFFICIENT

      Our modelling shows that introducing best practice targets for 2020 (130gCO2/km) and 2024 (95gCO2/km)
      would deliver significant benefits across the Australian economy. Achieving this standard is technologically
      feasible and cost effective.

THE BENEFITS ACHIEVED IN 10 YEARS

$7.9 billion p.a                       Take $850 per year                 Reduce CO2e                    Eliminate up to
fuel savings across                    off the average                    emissions                      66 million barrels
Australian economy                     driver’s fuel bill                 by 8.7 Mt                      of imported oil
                                       and achieve minimal                equivalent to taking           equivalent to 50% of all
                                       annual net savings of $350         2.2 million cars off           automotive fuel used
                                                                          the road                       in Australia in 2012

      Each year we delay the implementation of best practice standards is another year we miss out on these
      benefits and the task to catch up becomes harder. The time to act is now.

THE ROADMAP: HOW WE GET THERE

  Work with industry and consumer groups            Introduce complementary
                                                                                                 Develop partnership approach
  to design and implement best practice             measures to drive consumer
                                                                                                 to overcome inertia and
  standards that maximises consumer and             demand for the most efficient
                                                                                                 ensure effective outcomes
  environmental benefit                             vehicles

                                                                                                                                    3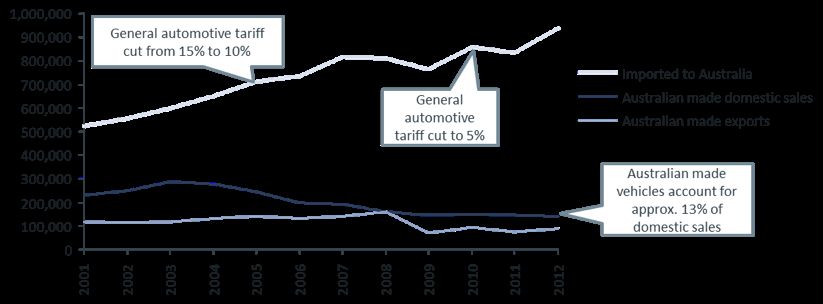
Australia’s transport emissions are                         The Low Carbon Growth Plan for
continuing to grow, with passenger                          Australia showed that cars and light
and light commercial vehicles                               commercial vehicles can deliver the
contributing the largest overall                            lowest cost emissions reductions
share                                                       across the Australian economy
The transport sector accounts for 17% (92 MtCO2e)           The Low Carbon Growth Plan for Australia
of Australia’s emissions, with Passenger and Light          (ClimateWorks Australia, 2010), identified that the
Commercial vehicles contributing 62% of the sector’s        transport sector could contribute the most financially
emissions (DIICCSRTE, 2013).                                attractive opportunity identified across the economy
                                                            through improving the fuel efficiency of conventional
The transport sector is one of the fastest growing
                                                            internal combustion engine (ICE) light vehicles; the
sources of emissions within Australia, increasing by
                                                            cars, sports utility vehicles (SUVs), utes and vans
47.5% since 1990 (DIICCSRTE, 2013).
                                                            most commonly seen on our roads.
The sector’s emissions are projected to rise by a
                                                            As part of this previous analysis, a range of policy
further 6% to 2020, to reach 97 MtCO2e (DCCEE,
                                                            approaches were compared, which showed that
2010). This continued increase in emissions is driven
                                                            mandatory fuel efficiency standards (also known
primarily by population and income growth for
                                                            as CO2 emission standards because of the direct
passenger travel and economic growth for freight
                                                            correlation between improved fuel efficiency and
transport (DCCEE, 2010).
                                                            reduced CO2 emissions) had the largest impact on
                                                            reducing emissions, even after taking account of the
Exhibit 1 - Australia’s transport emissions 2012 and 2020
                                                            increase in kilometres driven when fuel savings are
(MtCO2e)
                                                            achieved (known as the ‘rebound effect’).

                                                             Mandatory standards set the average acceptable
                                                             emissions across the new vehicle fleet. Each
                                                             vehicle manufacturer would be required to
                                                             meet these standards, averaged across the mix
                                                             of vehicles they sell in the Australian market.
                                                             This ensures that the same variety of vehicles
                                                             Australians currently enjoy would still be available,
                                                             but overall they would be more fuel efficient.

Source: DIICCSRTE (2013); DCCEE (2010)

     4
Exhibit 2 – Opportunities to reduce emissions in Australia in 2020

     Cost to an investor
     A$/tCO2e

      200
                  Car and light commercial vehicle efficiency improvement
      150
                    Large articulated truck efficiency improvement
      100
                       Hybrid cars
       50

        0
            0                        50                           100                              150                 200               250
      -50                                                                  Emissions reduction potential
                                                                                        MtCO2e per year

     -100                                                               Electric cars

     -150

     -200

     -250
                                                       Power            Transport       Forestry
                                                       Industry         Buildings       Agriculture
     -300

     -350

     -400

Source: Adapted from Low Carbon Growth Plan for Australia: Impact of the carbon price package, ClimateWorks, 2011

Exhibit 3 – Comparison of policy measures to reduce emisisons in cars and light commercial vehicles

                            GHG emissions reduction
 Policy measure             MtCO2e per annum

                                                                                                   6.8         5.5           Note: These projections for
                                                                                                                             emission reductions from
  Mandatory fuel
  efficiency                                                                                                                 fuel efficiency standards
  standards                                                                                                                  were based on standards
                                                      -1.7                  0.3                                              being implemented in
  Encourage demand                                                                                 1.5         2.4           2010, and a 2020 target of
                                                                            1.5
  for low emission                                                                                                           140 gCO2 /km.
  vehicles
                                                      -0.7

                                                      2.4                   0.1                    0.1         2.6
  Fuel tax
                                     0.0

  Early retirement                   0.7              -0.2                  0.0                    0.0         0.5

                                 Lifespan         Kilometres              Car                  Fuel        Net emissions
                                                    driven              category            efficiency       reduction

Source: Low Carbon Growth Plan for Australia, ClimateWorks, 2010

                                                                                                                                                       5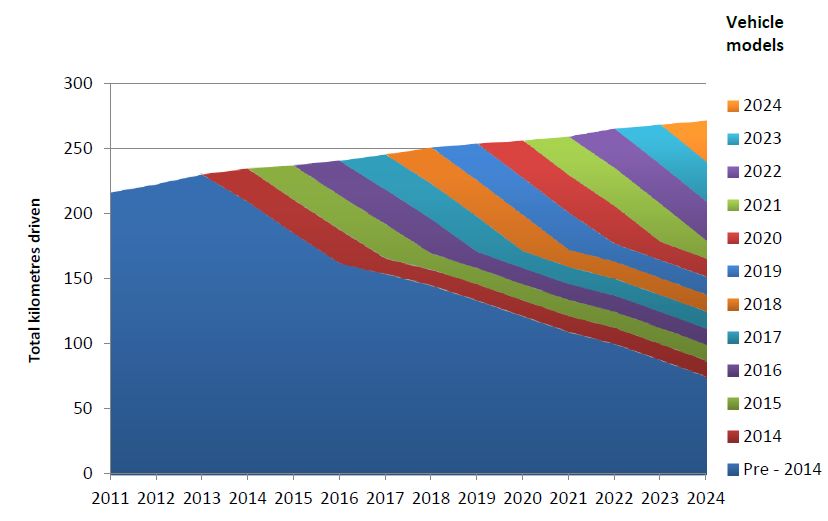
Australia has the 11th largest new                              Whilst fuel efficiency from
car market globally, with over                                  Australia’s new light vehicle fleet
1 million new vehicles sold annually                            has been improving, we continue to
Over 1 million new vehicles were sold in Australia in           lag behind most of the developed
2012 (NTC, 2013), making ours the 11th largest vehicle
market globally (Bandivadekar, 2013).
                                                                world, providing an opportunity for
                                                                significant efficiency gains
Over the last decade, there has been a 40% increase
in the total number of cars sold in Australia (from             Reducing emissions in vehicles is typically achieved
approximately 750,000 in 2001 to over 1,000,000                 through technology improvements that also reduce
in 2012). These new sales are comprised of                      fuel use. The less petrol, diesel or natural gas
approximately 80% passenger vehicles (e.g. cars,                consumed per kilometre driven, the less emissions
people movers and SUVs), and 20% light commercial               produced, while also delivering a decrease in vehicle
vehicles (e.g. utes and vans) (NTC, 2013).                      operating costs. There is in fact a direct correlation
                                                                between a reduction in fuel use and a reduction in
As seen in Exhibit 4, over this same period there has           emissions and ‘fuel efficiency standards’ are often
been an overall decline in sales from local vehicle             also referred to as ‘vehicle CO2 emissions standards’.
manufacturers, driven by the high Australian dollar
(which has both reduced export demand and made                  Between 2002 and 2012, average CO2 emissions for
imported vehicles cheaper), reduced import tariffs              new passenger and light commercial vehicles in
(which has increased the range of brands and models             Australia reduced by over 20% (NTC, 2013). In 2012
available), and a shift in consumer preferences                 alone, average CO2 emissions reduced by almost 4%,
towards smaller vehicles and SUVs (sports utility               to reach 199 gCO2 /km (NTC, 2013). Breaking this
vehicles), which has also benefited the import market.          down further, the NTC (2013) reports that passenger
                                                                vehicles averaged 190 gCO2/km (a 4% improvement
These factors have resulted in a significant increase           on 2011), while light commercial vehicles averaged
in imported vehicles and a decline in local vehicle             238 gCO2/km (a 2.7% improvement on 2011).
manufacturing, culminating in recent announcements
from Ford, General Motors Holden and Toyota to                  This progress, which has occurred without any
cease manufacturing vehicles in Australia post 2017.            Australian regulatory driver, has been driven by
                                                                improved vehicle technology, an increase in the share
                                                                of more efficient imported vehicles, and shifting
                                                                consumer preferences towards smaller vehicles and
                                                                compact SUVs (Rare, 2012).
                                                                Without standards in place, business as usual (BAU)
                                                                projections for Australia’s light vehicle fleet (including
                                                                both passenger and light commercial vehicles)
                                                                estimate average emissions of approximately 175
                                                                gCO2/km in 2020, and 165 gCO2/km in 2024 (Rare,
                                                                2013).

Exhibit 4 – Breakdown of domestic sales and exports 2001-2012

Source: DoI, 2012

     6
Exhibit 5 – Australian fleet average emissions 2012 and 2020 On a like for like comparison (excluding the varous
credits available in the US system and normalization
of the testing methods), this equates to US cars
being up to 30% more fuel efficient than the average
Australian car by 2020, and even further ahead by
2025.
The United States expects an annual rate of
improvement of 4.6% over the period 2012–2020 for
passenger vehicles (and 4.4% for LCVs), and 5.1%
per annum from 2020-2025 for passenger vehicles
(and 5.5% for LCVs) with current standards in place,
leading to an overall gain of 47% for passenger
vehicles and LCVs out to 2025.
The EU, which has had strong standards in place
Source: NTC, 2013 for a number of years, is aiming to achieve a
passenger vehicle target of 95 gCO2/km by 2020 and
approximately 73 gCO2/km by 2025 (standards for
Exhibit 6 compares the historic and business as usual
2025 are currently being debated in the EU) – over
(BAU) performance of Australia’s light vehicle fleet,
40% more fuel efficient than the average car sold in
comprising passenger vehicles (approximately 80% of
Australia by 2020, and even further ahead by 2025.
new light vehicle sales) and light commercial vehicles
(approximately 20% of new light vehicle sales) In Europe, new passenger vehicle standards target
a 3.8% improvement per annum from 2011-2020
Despite these efficiency gains, Australia still lags
(and 2.2% for LCVs), and a further 5.1% annual
behind a number of other developed nations in terms
improvement between 2020-2025 (and 5.2% for LCVs),
of the average fuel efficiency (and therefore the CO2
for an overall gain of 46% (and 37% for LCVs).
emissions performance) of the vehicles we drive,
and the required regulatory structure to drive further China is currently considering an ambitous 6.2% per
efficiency improvements. annum improvement in passenger vehicles between
2015-2020, to improve their overall perfromance
In fact, three quarters of all new cars sold globally
by 27% over this 5 year period (and is yet to set
each year are regulated under some form of CO2
standards out to 2025).
emissions standard (ICCT, 2012). For example, the
US has committed to achieving the equivalent of It also demonstrates that for Australia, there is
121 gCO2/km by 2020 and 93 gCO2/km by 2025 for potential to achieve significant efficiency gains above
passenger vehicles. BAU through the adoption of technologies that are
already available in international markets.
Exhibit 6 - Historic and projected performance of average emissions of Australian light vehicle fleet
280
Grams CO2 per Kilometer normalized to NEDC Test Cycle
260
240
Passenger Vehicles
220
200
Light Commercial
180 Vehicles
160
Passenger & Light
140 Commercial Vehicles
combined
120
Passenger & Light
100 Commercial Vehicles
Combined BAU
80
60
2000 2002 2004 2006 2008 2010 2012 2014 2016 2018 2020 2022 2024
Source: NTC, 2013 and Rare, 2013
7Exhibit 7 - International comparison of average emissions of vehicle fleets targets to 2025, normalised to New European
Driving Cycle (NEDC)
280
Solid lines: historical performance US-LDV
260 Dashed lines: enacted targets Canada-LDV
Grams CO2 per Kilometer normalized to NEDC Test Cycle
Dotted lines: proposed targets or targets under study
240 EU
Japan
220
China
200
S. Korea
180 Australia
Mexico 2016: 169
India
160
Mexico-LDV
S. Korea 2015: 153
140
120 China 2020[1] : 117
India 2021: 113 US 2025[2] :109
Japan 2020: 105
100 Canada 2025:109
EU 2020: 95
80
60
40
20
0
2000 2005 2010 2015 2020 2025
[1] China's target reflects gasoline vehicles only. The target may be higher after new energy vehicles are considered.
[2] US , Canada, and Mexico light-duty vehicles include light-commercial vehicles.
[3] Supporting data can be found at: http://www.theicct.org/info-tools/global-passenger-vehicle-standards.
Source: International Council on Clean Transportation, 2013
The time is right for Australia to vehicle sales (see Appendix A for various elements of
standard design).
match international efforts and
Emissions are calculated using a range of vehicle
further encourage the adoption of test cycles (i.e. vehicle running patterns to mimic
the latest technologies actual driver behaviour), and policy design may
include exemptions for manufacturers who sell small
Light vehicle fuel efficiency standards have been
volumes, and credits for certain very low emissions
proposed in Australia previously, but due to a number
vehicle technologies, such as electric vehicles. If a
of factors have stalled in their introduction.
manufacturer does not achieve the standard, they may
The current Government has the opportunity be penalised.
to introduce best practice standards, which if
It is important to note that consumers influence
designed well in collaboration with industry and
the average CO2 for a manufacturer, based on their
consumer stakeholders, and supported with suitable
vehicle purchase choice, and hence the need for
complementary measures, present a significant
complementary measures to inform consumer
opportunity to reduce emissions from the transport
decision making. ClimateWorks Australia and Rare
sector whilst providing broader benefits for vehicle
Consulting (a division of pitt&sherry) collaborated
owners and the economy..
to model the costs and benefits of various scenarios
Rather than rely on higher fuel prices to encourage for emissions standards based on international best
new vehicle buyers to choose more fuel-efficient practice.
vehicles (with evidence suggesting a high degree
Our analysis shows that if Australia were to adopt
of price inelasticity, therefore requiring significant
new light vehicle emission standards up to the best
fuel price increases to drive a shift in consumer
practice passenger vehicle standards adopted in the
preferences), most countries have used a combination
EU, with a four year delay - 130 gCO2/km in 2020,
of regulatory standards, voluntary targets, financial
and 95 gCO2/km in 2024, we could potentially achieve
incentives and consumer information to achieve fuel
significant savings on emissions and fuel use.
efficiency improvements.
The degree of these savings will depend on the
Whilst fuel efficiency standards vary in their ambition and
emission level targeted over and above BAU. Details
design by country, in general they set average CO2
on the approriate target, whether they are combined
emission levels (in gCO2/km or equivalent) which a
for the entire fleet or separated based on vehicle
manufacturer must meet across its annual fleet of new
8Exhibit 8 - Potential Australian light vehicle emission standard range compared to EU passenger vehicle targets
Grams CO2 per Kilometer normalized to NEDC Test Cycle 200
180
160 Australia - Passenger &
Light Commercial Vehicle
combined BAU
Range of potential
efficiency gains
140 available between BAU
and Best Practice Australia - Best Practice
Scenario
120
5 yr lag EU - Passenger Vehicle
Target
100
80
4 yr lag
60
2012 2013 2014 2015 2016 2017 2018 2019 2020 2021 2022 2023 2024 2025
Source: Rare, 2013 and ClimateWorks analysis
Exhibit 9 – Breakdown of required performance of vehicle segments under Best Practice scenario in 2024
180
Passenger Vehicles
160 Light Commercial Vehicles
Overall target achieved
140
Grams CO2 per km (NEDC)
120
100
95 EU 2020 Passenger Vehicle target
80
73 EU 2025 proposed Passenger
60 Vehicle target
40 Note: Assumes no change in the
percentage make up of the fleet between
20 Passenger Vehicles (80%) and Light
Commercial Vehicles (20%) to 2024
0
Equal improvement LCVs continue improving LCVs improving at US
across vehicle segments at current rate (2.7% p.a) targeted rate (~5% p.a)
Source: Rare, 2013 and ClimateWorks analysis
segmets (passenger and LCVs), and other such 2. The potential to adopt vehicle technologies that
technical issues, should be worked through by have already been developed and commercialised in
Government with relevant industry and consumer other markets; and
groups to ensure an effective outcome that delivers
the broadest benefits to the Australian economy and 3.The changing preferences of Australian buyers
environment. (adopting more small, diesel and European vehicles).
Achieving the targets up to those in the Best Practice Overall, such a best practice scenario would require
Scenario, which covers both passenger vehicles and up to a 52% improvement in the perfromance of
light commercial vehicles, is considered realistic Australia’s light vehicle fleet to 2024. Breaking the
because it acknowledges three important issues in required performance of the passenger vehicle
relation to the difference between the Australian and and light commercial vehicle segments of the fleet
other markets: out under such a scenario reveals that there are a
variety of ranges for improvement between these two
1. An easier starting point (low hanging fruit) in the segments out to 2024, as shown in Exhibit 9.
Australian fleet;
9This analysis assumes the new vehicle fleet is comprised Best practice standards can deliver
of a constant mix of passenger vehicles (80%) and LCVs
(20%), based on today’s current mix ratios. a range of economy-wide benefits
As can be seen, if an equal rate of annual Our research found that emission standards can
improvement is assumed across passenger vehicles provide benefits to consumers and the broader
and LCVs to achieve a target of 95 gCO2/km by 2024, economy by reducing emissions, providing financial
this would require passengers vehicles to average 91 savings for businesses and households, and
gCO2/km, and LCVs to average 114 gCO2/km. increasing energy security.
For passenger vehicles, this level is still well above However, there are also costs associated with
the 73 gCO2/km proposed for the EU in 2025, whilst implementing standards such as program
for LCVs it is significantly below present day levels administration, reduced taxation revenue through
and may restrict the types of LCVs that can be offered, decreased fuel use, and additional upfront costs for
which is not desirable. more efficient vehicles.
Alternatively, if LCVs were to continue to achieve their The International Energy Agency estimates that
current 2.7% p.a. rate of improvement, this would within the EU, achieving a 50% improvement in fuel
mean that passenger vehicles would need to average efficiency will cost in the range of $2,500 per vehicle
76 gCO2/km by 2024, which is in line with the level by 2020 in today’s dollars, with costs decreasing
targeted in the EU. further over time (IEA, 2012).
The final scenario shows that if LCVs were to improve Other assessments estimate that the additional
at the rate targeted in the US (~5% p.a.), this would vehicle technology required to achieve the EU’s 2020
mean they achieve a 2024 level of 129 gCO2/km, target, compared to the average 2010 manufactured
requiring passenger vehicles to average 87 gCO2/km, car, is approximately $1,500-$1,660 (€1,000-€1,100)
still above the 73gCO2/km targeted in the EU. (Ricardo-AEA, 2013).
Being a technology taker and with a large proportion In the EU and other leading markets, technological
of our fleet sourced from markets with standards innovation and commercialisation is required in order
already in place, Australia can expect to achieve to achieve new standards in these countries, and
more rapid rates of improvement than markets such this has been factored into the $2,500 additional cost
as the EU and US, and our Best Practice Scenario estimate.
reflects this, delivering these benefits to Australian In the interests of taking a conservative approach
consumers in a realistic timeframe. to estimating potential financial benefits in
our modelling, we have applied this cost to the
implementation of our Best Practice Scenario in
the Australian market in 2024 – even though we
can expect that the actual costs will be lower, given
that these technologies will be fully commercialised
approximately four years prior to the time they are
applied to the Australian market.
10Further, a decline in the upfront cost of new vehicles In 2020 a vehicle owner travelling average kilometers
over this period has not being factored in, even could be paying $170 less per year for fuel than they
though new vehicle purchase costs have declined by do today, and as much as $410 less per year for fuel
11% over the past decade, driven by an increase in the in 2024, even driving the same distances and with
number of imported vehicles available in the market, increasing fuel prices.
and increased competitiveness (DIISRTE, 2011).
Exhibit 11 shows that for an average vehicle owner
As shown in Exhibit 10, our analysis found that best driving 14,000 km/yr fuel savings over the 5 year
practice efficiency gains can provide significant ownership period would total $4,263, which means
fuel cost savings to consumers compared to a BAU that even our conservative estimate of additional
scenario. Under our Best Practice Scenario versus upfront costs would still be recouped within 3 years,
BAU, for a vehicle driving average kilometres (14,000 well within the 10 year average age of a vehicle (ABS,
km/yr) (ABS, 2012), annual fuel savings of $500 per 2013) and the 5 year average ownership period. This
year could be achieved in 2020, and over $8521 per results in a minimum savings of $1,763 over this 5
year in 2024. year period, or $352 minimum net annual savings.
Exhibit 10 – Annual fuel costs and savings: Best Practice Scenarion compared to BAU for an average vehicle (14,000km/yr)
4,000
Fuel cost BAU Fuel cost with Best Practice standards Fuel savings BAU vs Best Practice standards
3,500
3,000
2,500
Fuel cost / savings ($)
2,000
1,500
1,000
500
0
-500
-1,000
-1,500
Today 2020 2024
Source: Rare, 2013 and ClimateWorks analysis
Exhibit 11 – 5 year fuel costs and savings: Best Practice Scenario compared to BAU for an average vehicle (14,000km/yr)
$10,437 $4,263
$1,763 Minimum 5 year net savings
Conservative incremental
$2,500 upfront cost to achieve 50%
$6,174 fuel efficiency ~ $2,500
Additional conservative
upfront cost for Best Practice
vehicle recouped from fuel
savings within 3 years
BAU 5 yr Best Practice 5 yr Fuel Savings
Fuel Costs 5 yr Fuel Costs
Source: Rare, 2013 and ClimateWorks analysis
1
Assumes fuel price of $2.10/litre in 2024
11As shown in Exhibit 12, the fuel savings could be This results in a minimum savings of $1,154 over this
even greater for fleet owners with higher annual 3 year period, or $384 minimum net annual savings.
kilometres (for example 20,000 km/yr), with fuel
Given that upfront costs could be significantly less
savings of over $710 per year in 2020 and $1,2181 in
than the $2,500 conservative estimate adopted, due
2024 compared with BAU.
to the 4 year lag in adoption of technologies from
Exhibit 13 shows that for a fleet vehicle owner driving overseas markets and the trend in decreasing costs
20,000 km/yr fuel savings over the 3 year ownership for vehicles, it is expected that savings would be
period would total $3,654, which means that even greater over both the ownership periods analysed
our conservative estimate of additional upfront costs above than the minimum presented.
would still be recouped within 2 years, within the 3
year average ownership period.
Exhibit 12 – Annual fuel costs and savings: Best Practice Scenario compared to BAU for a fleet vehicle (20,000km/yr)
4,000
Fuel cost BAU Fuel cost with Best Practice standards Fuel savings BAU vs Best Practice standards
3,500
3,000
2,500
Fuel cost / savings ($)
2,000
1,500
1,000
500
0
-500
-1,000
-1,500
Today 2020 2024
Source: Rare, 2013 and ClimateWorks analysis
Exhibit 13 – 3 year fuel costs and savings: Best Practice Scenario compared to BAU for a fleet vehicle (20,000km/yr)
$8,946 $3,654
$1,154 Minimum 3 year net savings
Conservative incremental
$2,500
upfront cost to achieve 50%
$5,292 fuel efficiency ~ $2,500
Additional conservative
upfront cost for Best Practice
vehicle recouped from fuel
savings within 2 years
BAU 3 yr Best Practice 3 yr Fuel Savings
Fuel Costs 3 yr Fuel Costs
Source: Rare, 2013 and ClimateWorks analysis
12With best practice standards in There are several key risks that
place, in 2024 average drivers could Australia faces if it does not take
recoup the additional upfront costs advantage of this opportunity
within 3 years, and be paying 25%
Energy security
less per year for fuel than they do
Australia’s oil self-sufficiency has been declining
today, even in the face of increasing rapidly over the past decade and is expected to
fuel prices continue to decline over the next 20 years, increasing
reliance on imported oil for transport fuels.
Comparing these savings to projected average
household electricty bills in 2020, our analysis shows Projections suggest that Australia’s annual demand
that with best practice standards, the fuel savings for transport energy could rise by as much as 35%
achieved for an average driver (14,000 km/yr) could by 2030 to 470 million barrels of oil equivalent (ACIL
offset one third of the average household electricity Tasman, 2008). This prediction coincides with a
bill2. projected fall in Australian crude oil production to
less than 85 million barrels of oil equivalent by 2030,
This shows that there are significant financial savings as seen in Exhibit 14.
available that can help relieve cost of living pressures
for Australian consumers, and also increase business Exhibit 14 – Transport sector oil demand compared to supply
competitiveness. (millions barrels oil equivalent)
Assuming a 2% growth in new vehicle sales, the
additional upfront costs of new vehicles purchased
in 2024 will total approximately $3.2 billion. This is
in comparison to the potential annual fuel savings of
over $1 billion for these vehicles, showing again that
economy wide this upfront investment could be paid
off from fuel savings in less than 3 years.
Our analysis shows that avoided fuel use (which will
will ultimately depend on the fuel mix), could total
around 3.7 billion litres of fuel (worth $7.9 billion)
every year by 2024 from implementation of these
best practice standards.
Given the short pay back period on these efficiency
upgrades, and as fuel prices continue to rise,
without best practice vehicle emissions standards in
place, Australian light vehicle owners will continue
Source: ACIL Tasman, 2008, ACIL Tasman et al 2009
to spend substantially more on fuel than they could
be, adding to cost of living pressures.
As vehicle ownership in emerging economies
continues to explode over the next decade and
beyond, this will have implications for the cost and
availability of transport fuels in the global market,
and for Australia’s ongoing energy security.
However by 2024, the impact of best practice
emissions standards could reduce oil imports by
between 40 and 66 million barrels per annum,
equivalent to between 30-50% of Australia’s 2012
domestic demand for automotive fuels (BREE, 2012).
Lock-in of higher levels of emissions
The average age of vehicles on Australian roads is
10 years (ABS, 2013), which is higher than the global
2
2020 annual household electricty costs of $1,416 based on an average. Exhibit 15 shows that in 2024, 30% of all cars
average household demand of 5.9MWh (ClimateWorks team and light commercial vehicle kilometres will be from
analysis) and forecast retail electricity price of $240/MWh vehicles built prior to 2014. As a result, new vehicles
(SKM MMA 2012)
13introduced after 2013 would account for over 30% of By setting a 2020 target, this will encourage the
all kilometres drivenby 2016 and over 70% in 2024. gradual improvement (beyond BAU) of average fleet
emissions in the lead up to 2020, as demonstrated
This means that any delay in improving vehicle
in international markets which have implemented
emissions standards will lead to a level of emissions
standards. As the lowest cost opportunity to reduce
lock-in – where a larger proportion of vehicles on
emissions available in Australia, missing this
our roads will be less efficient than they would be
potential would increase the cost of ‘catching up’
with standards in place – reducing the potential by
through other emissions reduction opportunities in
which vehicle emission standards can contribute to
the future.
Australia’s 2020 emission reduction target.
Exhibit 15 - Proportion of new light vehicles by total vehicle kilometres driven (2011-2024)
Post 2013 vehicles
account for 30% of
total kms driven
Post 2013 vehicles
account for 70% of
total kms driven
Source: Rare, 2013
14The technology already exists In addition to technology improvements to traditional
internal combustion engines, savings could also be
to achieve significant efficiency achieved through a range of alternative fuels (e.g.
improvements in the vehicles we biofuels) and technologies (e.g. electric or hybrid
vehicles) that can also reduce emissions from the
drive light vehicle sector.
There are a range of current and emerging
Widespread penetration of these fuels and
technologies that can be, and some which already
technologies will depend on a variety of factors,
have been, implemented to improve vehicle efficiency.
including the time required to optimise production
The majority of these technologies have been
scales, build fleet operator confidence, and cost.
developed in response to existing and forthcoming
legislative requirements in international markets.
For Australia, this means that we can adopt these
technologies at lower cost and faster rates, and
importers can sell more efficient vehicles into our
market that they already manufacture for other
markets. In many cases, less efficient versions of
these cars are already sold in Australia.
Exhibit 16 – Available technology to improve vehicle emissions
Source: DIT, 2011
15A range of complementary For the transport sector, the rebound effect
comes into play where savings from reduced
measures are available to improve fuel consumption are utilised to travel additional
light vehicle fuel efficiency kilometres.
Overseas experience shows that, while mandatory Complementary measures are required in addition
fuel efficiency standards are key to achieving to standards to ensure that the rebound effect
emissions reductions in passenger and light can be minimised if not eliminated. In particular,
commercial vehicles, they can be enhanced with a economic signals that provide clear financial
range of complementary measures. incentives to vehicle owners have been found to work
in international markets (ICCT, 2012). These include
These may include information measures and
road access pricing and fuel and vehicle fees.
incentives to build consumer awareness and
drive demand and other measures to minimise All countries that have enacted standards have
the ‘rebound effect’. The ‘rebound effect’ refers supported them with complementary measures.
to the phenomenon where energy savings from A range of example complementary measures are
increased efficiency can result in rebounding energy discussed below.
consumption.
Table 1 - Range and examples of complementary measures introduced in other countries
Complementary Measure Example
Consumer education The UK Fuel Economy Label shows car buyers the running
costs and fuel efficiency of new cars, clearly demonstrating that
Labelling, promoting eco-driving, low
choosing a car with lower CO2 emissions means lower running
emissions vehicle demonstrations, car
costs (UKLCVP, 2013).
share etc.
Fuel Quality Australia may require a tightening of petrol standards as many
A review of Australian fuel quality European vehicles require 10 ppm sulphur content to meet air
standards with a view to mandating fuels quality standards. Without harmonisation of fuel quality standards
compatible with the Euro 5/6 emissions there may be some impediment for importing fuel-efficient
standards. vehicles or transferring engine technology. Further investigation
is required.
Road access pricing Congestion plays a significant role in increasing vehicle carbon
Users charged based on distance emissions, while also contributing to health costs. Road access
travelled on certain roadways to reduce pricing strategies could significantly reduce (or even eliminate)
the number of ‘low value’ kilometers congestion on urban freeways (and reduce congestion elsewhere),
driven. which would provide an additional benefit in reducing vehicle
carbon emissions. Such measures have been implemented in
Singapore and in parts of the EU and US, at the city and national
scale.
Fuel and vehicle fees Annual registration fees based on CO2 emissions have been
Fees encourage consumers to buy the adopted in France, Germany and the UK. The US has had a ‘gas-
most efficient models available and drive guzzler’ tax on cars with a fuel economy rating below 22.5 mpg
automakers to go beyond compliance of (280 gCO2 /km)since 1991. Research has found that these fuel fees
the minimum mandated levels. Alone have significantly more impact on fuel economy than purchase-
they do not guarantee improvement, and registration fees (ICCT, 2012) The UK has found that progressive
consumers can discount fuel savings CO2 taxation of company cars has been very powerful in driving
when purchasing a vehicle. ‘Feebates’, consumer choice (UKLCVP, 2013) Linking fuel and vehicle fees
which combine fees on high-emitting to emissions rather than attributes such as weight allows for
vehicles with rebates for buyers of low- application across a range of technologies (ICCT, 2012)
emissions vehicles, can address this
market failure (ICCT, 2012)
16Appendix 1 – Elements of best practice standard design
Element Suggested design for discussion
Coverage of standards There are pros and cons of having a single standard for all light vehicles versus
separate standards for passenger cars and light commercial vehicles. A single
standard allows manufacturers more flexibility in meeting targets by changing
their model mix, it avoids the complexity of separate standards, and minimises
leakage of passenger models into a less stringent light commercial vehicle
standard. This approach may advantage manufacturers who only sell passenger
cars, but this bias could be offset through the application of attribute weightings
(e.g. mass, footprint).
Attribute based targets Vehicle footprint (size) is the preferred attribute for its greater fairness and its
recognition of light weighting opportunities as opposed to vehicle mass (weight)
which may unintentionally incentivise a shift to larger vehicles.
Test cycle New vehicles are tested in laboratory conditions using a representative test cycle
that aims to simulate real-world driving. Different countries use different cycles.
It is suggested that the New European Driving Cycle should continue to be used
as the fuel consumption test drive cycle. This test cycle is also supported by key
countries where many of Australia’s new vehicles originate (e.g. European Union
and China).
Banking Permitting the transfer of credits between years encourages early effort and
allows manufacturers to meet their targets if their sales mix does not meet the
target (due to consumer preferences).
Trading Transfer between manufacturers of large brands enables advanced technologies
to be provided by the manufacturer with least cost (e.g. Toyota hybrid drivetrain
development).
Super credits Multiplication factors for electric vehicles and alternative fuels are not
recommended beyond a short transition period because these can undermine
the total emissions benefit achievable. They may also unnaturally favour more
expensive technologies and increase the cost of meeting standards.
Penalties Penalties should be high enough so that manufacturers invest in improving
fuel economy rather than pay a fine, but reasonable enough to not make the
Australian market an unattractive place to sell vehicles.
Target setting At least a 10-year outlook is necessary. This is consistent with longer term targets
established in other markets (United States) and provides a lead time for model
planning and technology transfer.
Eco-innovations These are non-engine technologies that can still contribute to fuel savings
(e.g. low-resistance tyres, gear shift messages). Their effect can be difficult to
measure and can have a higher administrative cost. It may be better to support
case studies that show the impact of additional fuel saving features to encourage
purchase of vehicles that adopt these technologies.
Exemptions for low In the European Union, manufacturers registering fewer than 22,000 new vehicles
volumes a year can apply for an exemption. A lower threshold is required for Australia
because the European threshold would exempt all but the top 15 car brands in
Australia.
17References ABS (Australian Bureau of Statistics) (2012). Survey of Motor Vehicle Use, Australia, 12 months ended 30 June 2012, Catalogue no. 9208.0. Retrieved February 3, 2014, from http://www.abs.gov.au/ausstats/abs@.nsf/mf/9208.0 ABS (Australian Bureau of Statistics) (2013). Motor vehicle census, Australia, 31 January 2013, Catalogue no. 9309.0. Retrieved February 3, 2014, from http://www.abs.gov.au/ausstats/abs@.nsf/mf/9309.0 ACIL Tasman. (2008). Liquid fuels vulnerability assessment – a review of liquid fuels vulnerability. Retrieved May 10, 2013, from www.ret.gov.au/energy/Documents/Energy-Security/nesa/ LiquidFuelsVulnerabilityAssessmentReport2011.pdf ACIL Tasman, EnergyQuest, Purvin & Gertz and Rare Consulting. (2009). Australia’s future transport fuel supply options – economic implications of alternative regional supply and demand scenarios. Report prepared for Queensland Energy Resources. Bandivadekar, A. (2013). The Issues that Keep Global Auto Executives (and Policymakers) Awake at Night. Retrieved May 10, 2013, from http://thecarsoftomorrow.com.au/wp-content/uploads/2013/03/Anup-Bandivadekar.pdf BREE, (Bureau of Resources and Energy Economics ), (2012). Australian Petroleum Statistics, December 2012. Retrived Janaury 21, 2014, from http://www.bree.gov.au/documents/publications/aps/2012/ AustralianPetroleumStatistics-197-Dec2012-V04.pdf ClimateWorks Australia, (2010). Low Carbon Growth Plan for Australia. Melbourne, Victoria. DCCEE (The Department of Climate Change and Energy Efficiency), (2010). Transport Emissions Projections 2010. Retrieved May 10, 2013, from www.climatechange.gov.au/publications/projections/~/media/publications/ projections/transport-emissions-projections-2010.pdf DIICCSRTE (The Department of Industry, Innovation, Climate Change, Science, Research and Tertiary Education), (2013). Quarterly Update of Australia’s National Greenhouse Gas Inventory: December 2012. Retrieved May 10, 2013, from www.climatechange.gov.au/~/media/climate-change/emissions/2012-12/ NGGIQuarteryDecQ2012.pdf DIT (The Department of Infrastructure and Transport) (2011), Light vehicle CO2 emissions standards for Australia, Key Issues, Discussion Paper, 2011. Retrieved May 10, 2013, from http://www.infrastructure.gov.au/roads/ environment/co2_emissions/files/Light_Vehicle_CO2_Standards_Discussion_Paper.pdf ICCT (International Council on Clean Transportation) and ClimateWorks Foundation, (2012). Policies that work: How vehicle fuel standards and fuel fees can cut CO2 emissions and boost the economy. Retrieved May 10, 2013, from http://www.climateworks.org/download/?id=3d3a5fe6-7184-40cf-a0fb-ca7e5663d977 ICCT, (2013). Global passenger vehicle standards. Retrieved February 3, 2014, from http://www.theicct.org/info- tools/global-passenger-vehicle-standards NTC (National Transport Commission), (2013). Carbon Dioxide Emissions from New Australian Vehicles: 2012 Information Paper. Retrieved May 10, 2013, from www.ntc.gov.au/filemedia/Reports/ C02EmissionsNewAustVeh2012InfoPa.pdf Rare Consulting, (2012), Light vehicle emission standards in Australia - The case for action. Prepared for ClimateWorks Australia. Ricardo-AEA, (2013). An economic assessment of low carbon vehicles. Retrieved February 3, 2014, from http://www.ricardo-aea.com/cms/assets/MediaRelease/Economic-Assessment-Vehicles-FINAL2.pdf UKLCVP (UK Low Carbon Vehicle Partnership). (2013). Retrieved May 10, 2013, from www.lowcvp.org.uk/ SKM MMA, 2012, Modelling the Renewable Energy Target: Report for the Climate Change Authority. Retrieved May 10, 2013, from http://climatechangeauthority.gov.au/sites/climatechangeauthority.gov.au/files/121217%20 RET%20Review%20SKM%20MMA%20Report%20Final.pdf 18
Glossary
BAU    Business as usual
CAFE   Corporate Average Fuel Economy
EU     European Union
ICCT   International Council on Clean Transportation
LCV    Light Commercial Vehicle
NEDC New European Driving Cycle
SUV    Sports utility vehicle
US     United States of America

                                                       19
This report was authored by Meg Argyriou and Scott Ferraro, with
project support by Shane Gladigau and technical input from
Pitt & Sherry (incorporating Rare Consulting).
ClimateWorks Australia kindly acknowledges those
who have reviewed and provided input to this report.
www.climateworksaustralia.org/vehicle-emissions-standards
©ClimateWorks Australia 2014
ClimateWorks Australia is an independent non-profit organisation whose
mission is to facilitate substantial emissions reductions in the next
five years in Australia by working with government, business, industry
groups and the community via a collaborative research and action-based
approach. Level 1, 31 Flinders Lane
Melbourne VIC 3000
ClimateWorks Australia is hosted by Monash University in partnership PHONE +61 3 9902 0741
with The Myer Foundation. EMAIL info@climateworksaustralia.org
WEB www.climateworksaustralia.orgYou can also read