White Paper White Paper EU Fleet consumption regulation undermines climate protection - Büro Ö quadrat
←
→
Page content transcription
If your browser does not render page correctly, please read the page content below
White Paper

     White Paper
     EU Fleet consumption regulation undermines
     climate protection

     Dieter Seifried
     Dr. Sebastian Albert-Seifried

     Freiburg, June 2019

© Büro Ö-quadrat GmbH, Turnseestraße 44, 79102 Freiburg, www.oe2.de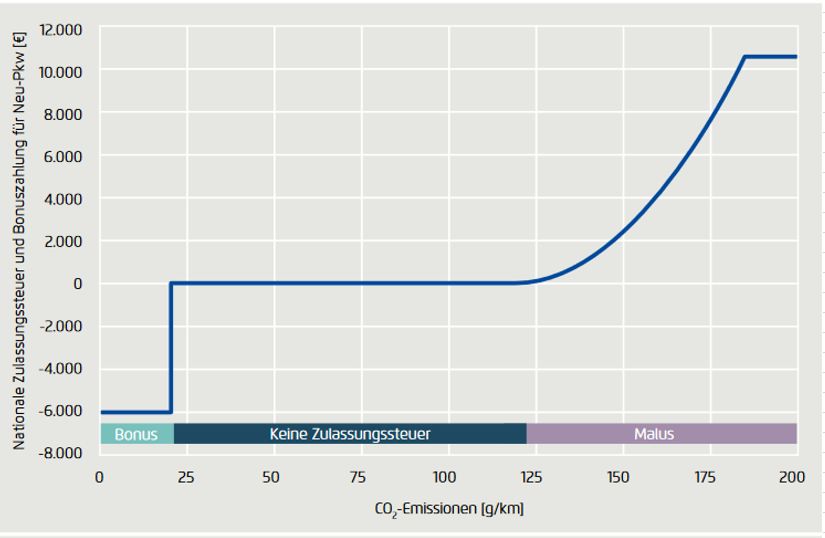
2

White Paper EU Fleet consumption regulation

1.    Introduction                                  3

2.    EU fleet consumption control – how it works 3

3.    Zero-emission cars and Super credits          4

4.    Why Plug-in Hybrids and Battery Electric
      vehicles are no “zero emission vehicles”?     5

5.    CO2 emissions from electricity consumed by
      EVs                                           7

6.    Average fleet consumption of new cars in
      Germany is rising                             9

7.    Germany will not reach CO2 Emission
      commitment under the Paris Agreement         10

8.    High compensation payments expected in
      Germany´s non-ETS sector                     12

9.    Recommendation on supplementary measures
                                             16

10. Amendment of the EU fleet consumption
    regulation                                     16

11. Conclusion                                     18

12. References                                     19
3
White Paper EU Fleet consumption regulation
1. Introduction
The decision of EU-Commission, EU-Parliament and Member States on the 17th De-
cember 2018 to further cut the fleet average CO2 emissions from new cars by 37.5
percent beyond 2021 level is presented as a big success for the climate. But due to the
generous credit and super-credit system for electric and plug-in hybrid electric cars and
the spurious measurement method, this system allows car manufacturers to produce
heavy plug-in hybrid electric cars with high fuel consumption under normal use to be
counted as low-emission cars in the fleet calculations. This fault in the EU fleet con-
sumption control mechanism has far-reaching consequences for the climate and the
German tax payers. Without further regulations in the energy and transport sector, the
real emissions will only decrease very slowly.
In this paper, we show that the fleet consumption regulation is far from reaching the
necessary emission reduction in the transport sector. Instead of the 54% expected re-
duction in the average specific CO2 emission of the new German car fleet by 2030 as
compared to the existing level, the real emissions will only decrease by about 10%.
Furthermore, the regulation will allow car manufacturers to continue selling heavy cars
that are deteriorating to the environment. Additionally, it will lead to high financial costs
for the German tax payers, because the government will have to compensate the deficit
in the Non-ETS sector through the purchase of CO2 allowances from other EU countries.
Depending on the price development of the CO2 certificates, we estimated an expendi-
ture of between 4.9 and 9.8 billion Euro for the expected 5 million Plug-in Hybrid cars,
which we projected to be sold in the German market in order to reach the EU target of
59 gCO2/km in the year 2030.
In the end of the paper, we recommend to revise the fleet consumption regulation and
briefly describe some additional measures/instruments, which combined with a revised
fleet consumption regulation could achieve the climate protection goals in the transport
sector.
2. EU fleet consumption control – how it works
The “EU legislation sets mandatory emission reduction targets for new cars. This
legislation is the cornerstone of the EU's strategy to improve the fuel economy of cars
sold on the European market.”1 The EU legislation started in 2010 with a 2015 target of
1
https://ec.europa.eu/clima/policies/transport/vehicles/cars_en4
White Paper EU Fleet consumption regulation
130 gCO2/km. In 2014, the CO2 target for the year 2020/21 was set to 95 gCO2/km. 2
However, there is a one-year phase-in period, requiring only 95% of new car sales to
comply with the target in 2020 and 100 % from 2021 onwards. In November 2017, the
Commission presented a legislative proposal setting new CO2 emission standards for
cars and vans for the period after 2020 and on 17th December 2018 the EU set the
target for 2030: a 37.5 % reduction compared to the 2021 value was fixed for passenger
cars and a reduction of 31% for light commercial vehicles 3. An interim target for 2025, a
15% reduction for passenger cars compared to 2021 was agreed upon.
It has to be noted that the CO2 emission limits are set according to the mass of the
vehicle, using a limit value curve. The curve is set in such a way that the target values
are achieved for the average of all car fleets in the EU. Heavier cars are allowed to have
higher emissions than lighter cars. For every 100 kg additional vehicle weight of the
manufacturer´s car fleet, the additional emission of 3.33 gCO 2/km is allowed.4 Only the
fleet average of every car manufacturer is regulated, so manufacturers are still able to
produce vehicles with emissions above the limit value curve, as long as these are bal-
anced by vehicles below the curve.
3. Zero-emission cars and Super credits
To give the car manufacturers additional incentives to produce vehicles with extremely
low emissions, battery-electric vehicles (BEVs) and fuel cell vehicles (FCVs) are
counted as zero emission cars. Additionally, cars with emissions below 50 gCO2/km5
are counted as low-emission vehicles. Cars in both categories can get super credits
within the regulation. In the years between 2020 and 2023, the zero-emission cars and
the low-emission cars will be counted with an additional weighting factor. This factor is
as follows:
• 2 vehicles in 2020
• 1.67 in 2021
• 1.33 in 2022
• 1 from 2023 onwards.
2
REGULATION (EU) No 333/2014
3
The decision paper has to be formally accepted by the parliament and from the Council and will come into
force as soon as it is published in the official register of the EU.
4
International Council on Clean Transportation, January 2014: EU CO2 Emission Standards for Passenger
Cars and Light-Commercial Vehicles
5
“Low-emission vehicle” is defined as a passenger car or a light commercial vehicle with tailpipe emissions
from zero up to 50 gCO2/km. (https://ec.europa.eu/clima/policies/transport/vehicles/cars_en)5
White Paper EU Fleet consumption regulation
The allowance of the super credits is however capped at 7.5 gCO 2/km per manufac-
turer.6
4. Why Plug-in Hybrids and Battery Electric vehicles are
no “zero emission” or low-emission vehicles?
Plug-in Hybrid Electric Vehicle (PHEV)
Firstly, we will give an example of a brand new PHEV:
Mercedes E 300 de
power (diesel) 143 kW
power electric 90 kW
diesel consumption 1,6 litre/100 km
electricity consumption 17,9 kWh/100 km
CO2-emission 41 g/km
velocity 250 km/h
capacity of accu 13,5 kWh
range 54 km
Source: Mercedes Benz Konfigurator 7
As mentioned above, PHEVs that pass the test procedure with CO 2 emissions below
50 g/km8 are counted as low-emission vehicles in the calculation of the car fleet emis-
sion. But how does the measurement and calculation procedure work9?
Step 1: The car drives the test procedure with full battery until the battery is depleted.
In the case of the example above, the range is 54 km. The CO2 emission from
the electricity used is not accounted for.
Step 2: The car drives the test procedure with its diesel or gasoline engine over a
distance of 25 km. In the example above the measured consumption is 1.3
litre of diesel.
6
There is a third incentive, called eco-innovations, to foster “innovative technologies” of which the benefits
are not adequately captured by the test cycle.
7
https://www.mercedes-benz.de/passengercars/content-pool/tool-pages/car-configurator.html/motoriza-
tion?rccVehicleModelId=2130421
8
Before 1.9.2018 the CO2 emission was measured according to the New European Driving Cycle (NEDC).
Since then, the new Worldwide Harmonised Light Vehicles Test Procedure (WLTP) is used.
9
Amtsblatt der Europäischen Union vom 26.5.20126
White Paper EU Fleet consumption regulation
Step 3: The total fossil fuel consumption of the car is calculated for a distance of 100
km.
The consumption is 1.3 litre/(54 km +25 km)*100 km=1.6 litre/100 km
Step 4: Based on the diesel consumption the CO 2 emissions are calculated: 1.6 litre
of diesel/100 km * 2.64 kgCO2/litre diesel = 4.2 kgCO2/100km = 42 gCO2/km
Result: The car receives the status of a low-emission car as the emissions are lower
than the threshold of 50 gCO2/km.
In reality the heavy PHEVs are mainly used as business cars and are typically driven
long distances with diesel or gasoline. In this case, the PHEV will not use less fuel as
compared to a conventional car and the additional weight of the car (in this case 200 kg
from the battery and additional electric motor) will counteract any gains from regenera-
tive braking.10
The actual diesel consumption of the same car type (Mercedes E 300 d) without electric
motor is about 7,9 litre/100 km in real everyday use11. This is equivalent to 209 gCO2/km
that far exceeds any fleet emission targets. Moreover, even if the car is used only in
electric mode, it can cause high CO2 emissions. In electric mode, the car with the battery
capacity of 13.5 kWh can reach a distance of 54 km. As a result, the consumption will
be 25 kWh/100 km. When considering the CO2 emissions caused by the electricity de-
mand with the merit-order method, the emission will be between 200 and 221gCO 2/km
(the basis of calculation is presented in the next section).
In summary, the real emission of the PHEV is much higher than the target values in
202112 or 2030. However, in the calculation of the EU fleet consumption, it is counted
with “low emissions”13 and within a certain period, it can even receive the super credit.
10
“In practice, the actual consumption of a plug-in hybrid car will vary widely from user to user. On long-dis-
tance journeys, the electric driving mode will be of little importance and therefore consumption will be at
the level of a conventional combustion engine." (translation by author) (Source VDA,
https://www.vda.de/de/themen/umwelt-und-klima/WLTP-realitaetsnaehere-Ergebnisse-beim-Kraftstoffver-
brauch/WLTP-Wie-werden-Plug-in-Hybride-und-Elektroautos-gemessen.html)
11
Average of 16 users; Source: www.spritmonitor.de , Feb, 2019, diesel, car with 150 to 250 kW power,
built between 2016 and 2019.
12
The target fleet emissions for 2021 are 102,8 gCO2/km for Daimler and 97,7 gCO2/km for Volkswagen
(Source PAConsulting 2018)
13
In our study we calculated with an average value of 40gCO2/km7
White Paper EU Fleet consumption regulation
PHEVs and BEVs can help car manufacturers to avoid pen-
alties
To understand how the automobile industry will respond to the ambitious new car fleet
consumption targets, it is helpful to look at the expected fines from the perspective of
an automobile company, which is likely to miss the target values.
The EU's CO2 reduction targets for fleet consumption (95 gCO2/km by 2021) and a
further 37.5% reduction for 2030 compared to 2021 14 can only be met by the car manu-
facturers through a strong increase in BEVs and PHEVs.15 If the average CO2 emissions
of a manufacturer's fleet exceed its limit value, the manufacturer has to pay an excess
emission premium for each car registered. This penalty amounts to €95 per gram
which exceeds the target value.
This regulation can cause heavy additional expenditures for the car manufacturer. Let
us calculate the marginal fines for the sale of one additional Audi Q7 with 162 gCO2/km
under the likely assumption that Volkswagen would not reach the fleet emission tar-
get.16. This car would cause the manufacturer a penalty of € 6,109 17. In contrast, if the
car manufacturer can sell this car as a PHEV with emissions of 48 gCO2/km in the year
2021, it will be counted as a low-emission vehicle and further qualifies for the 1.67 super
credit. Not only is the fine averted but the PHEV helps to compensate the emissions
and therefore fines from other cars. This bonus amounts to fleet consumption target
minus low-emission value multiplied by the super credit factor and the excess emission
penalty i.e. (97,7-48) gCO2*1.67*€95/gCO2 and this is equivalent to € 7.88518. Com-
pared with the penalty the car manufacturer would have to pay for the conventional car
of the same type, the PHEV saves the company about € 14.000 in averted fines.
5. CO2 emissions from electricity consumed by EVs
As discussed above, some electric cars are counted as zero emission cars and qualify
for super credits. But how does this regulation affect climate emissions? The additional
electricity demand for the use of an electric car in Germany will be produced by the next
14
Based on the average of all cars sold in Europe.
15
Authors view, but also view of car manufacturer (for example VW. Source: Handelsblatt, 20.12.2018)
16
Based on official figures measured with New European Driving Cycle (NEDC), which are much too low
compared to real consumption (see www.spritmonitor.de) and Transport&Environment 2018.
17
The penalty is calculated as following: the standard emissions of this car is 162 gCO 2, which is 64 gCO2
higher than the 97,7 gCO2 target of the Volkswagen trust. If the car comes to market in 2021, the com-
pany has to pay €95/gCO2.
18
The target fleet consumption values are fixed for each manufacturer. These values might however change
in the future if the average tonnage of the vehicles of this manufacturer changes.8
White Paper EU Fleet consumption regulation
power plant in line in the merit-order. For the foreseeable future, this will be coal- or
gas-fired power plants.
In theory, new renewable electricity generation capacity could be installed to cover the
future demand for electrifying the transport sector. However, in Germany there is no
legal regulation, directive nor political statement that requires, that the additional elec-
tricity demand from the transport sector should be covered by renewable energies.
It is hard to determine exactly which type of fossil fuel power plant will cover the addi-
tional demand of the electric car because the demand will be covered by the interaction
of all fossil fuel power plants over time, depending on the time of day when the electric
cars are charged, the total demand and the production of the renewable power plants.
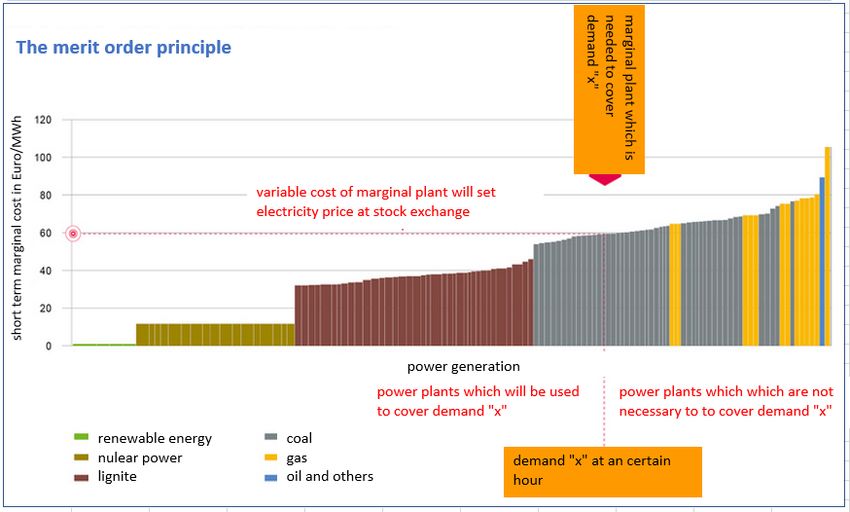
As shown in Figure 1, the additional electricity demand is covered by the power plant
with the next lowest variable power production costs, which is on the right of demand
“x”.19
Figure 1: The merit order principle (Source: Öko-Institut 2011)
To estimate the marginal emission factor of the additional electricity production, we cal-
culated two scenarios:
Scenario A assumes that the additional electricity production comes from 40 % lignite,
40 % coal and 20% gas-fired power plants. In scenario B we calculate with a 1/3 mix of
the fossil fuel power plants. As a result, we estimate that the additional CO2 emissions
ranging between 884 and 802 gCO2/kWh (Table 1).
19
Öko-Institut (2011): p. 309
White Paper EU Fleet consumption regulation
efficiency factor CO2-emission-
related to factor related to Emission- Emission-
CO2-emissions electricity electricity factor factor
fuel related to fuel demand demand Scenario A Scenario B scenario A scenario B
g/kWh % g CO2/kWh g CO2/kWh g CO2/kWh
lignite 407 35 1151 40% 33,3% 460 384
coal 337 39 863 40% 33,3% 345 288
gas 201 51 391 20% 33,3% 78 130
884 802
Table 1: CO2 emission from electricity production (Source: UBA 201720, assumptions and cal-
culation by Büro Ö-quadrat)
The average electricity consumption over 100 km of a full electric car as provided by
the manufacturers21 are between 14 kWh for a small car22 and 20 kWh for a mid-sized
car. This will lead to emissions between 112 gCO2/km and 177 gCO2/km respectively.
In reality, the electricity consumption might be even higher than the listed values.
6. Average fleet consumption of new cars in Germany is
rising
After a period of declining fleet consumption from 152g in 2010 to 128g in 2017 the
average fleet consumption for new cars increased again in 2018. This was due to the
diesel scandal that led to a subsequent decline in the share of diesel cars and the high
demand for SUVs, off-road vehicles and sports cars. In October 2018, the average was
3.3g higher than in the same month of the year before and reached 131g on average. 23
At the beginning of 2019, it is obvious that the German car manufacturers will not reach
their fleet emission targets with only efficiency gains. Our calculations show that the
95gCO2/km emission target for 2021 can only be reached with a 19% share of zero-
emission electric cars, assuming efficiency gain of 2% per year for conventional cars.24
As a reference, the total number of BEVs and PHEVs licenced in Germany at the end
of 2018 was 98,000, thereof 44,000 PHEVs25.
20
UBA 2018: Entwicklung der spezifischen Kohlendioxid-Emissionen des deutschen Strommix in den Jah-
ren 1990-2017, Berlin, May 2018
21
Measured with NEDC. Based on WLTP the emissions will be 25 % higher
22
VCD Umweltliste, October 2018
23
Kraftfahrt-Bundesamt November 2018
24
In our scenarios we did not include Mild Hybrid cars nor cars powered by natural gas.
25
Kraftfahrt-Bundesamt, January 201910
White Paper EU Fleet consumption regulation
CO2-emission of newly registered cars in Germany
and percentage of diesel engine
134 50
percentage of Diesel engine
132
45
130
g CO2/km
128 40
126 35
124
30
122
120 25
Jul 17
Jul 18
Jun 17
Jun 18
Apr 17
Mrz 17
Mai 17
Okt 17
Nov 17
Apr 18
Mrz 18
Mai 18
Okt 18
Aug 17
Sep 17
Dez 17
Feb 18
Jan 18
Aug 18
Sep 18
emission according NEFZ percentage of diesel cars
Figure 2: CO2 emissions of newly registered cars in Germany (Data Source: Kraftfahrt-Bun-
desamt, monthly bulletin)
7. Germany will not reach CO2 Emission commitment un-
der the Paris Agreement
It might be the problem of car manufacturers that they will have to pay for not reaching
their target. However, this will also affect the German government and society as a
whole. In May 2018, the European Parliament and the EU council set binding annual
greenhouse gas emission reduction target in the non-ETS sector for member states
from 2021 to 2030.26 The aim was to meet the Union´s commitments to reduce green-
house gas emissions by at least 30% compared to 2005 under the Paris Agreement.
Each member state needs to limit its greenhouse gas emissions at least to its self-
imposed target and for Germany the reduction target is 38% compared to 2005.
Each member state has to ensure that its greenhouse gas emissions in each year be-
tween 2021 and 2030 do not exceed the limit defined by a linear trajectory, starting from
the average of its greenhouse gas emissions in 2016, 2017 and 2018.27 If a member
state cannot fulfil its emission budget, it has to purchase emission certificates from other
26
The emissions for the transportation sector are calculated based on the overall gasoline and diesel con-
sumption in the member states. These figures are therefore independent from the emissions of test pro-
cedures.
27
The linear trajectory of a member state shall start either at five-twelfths of the distance from 2019 to 2020
or in 2020, whichever results in a lower allocation for that member state11
White Paper EU Fleet consumption regulation
members of the Union. Nevertheless, some flexibility is built in to ensure an efficient
process.28
In the period from 2005 to 2018, there was hardly any emission reduction in the Non-
ETS sector of Germany. While the building sector has reduced its emissions by 16 %,
greenhouse gas emissions in the agriculture and transport sector have risen. To fulfil
its obligation, the Non-ETS sector has to reduce the emissions by 14 million tons CO2eq
per year, which corresponds to 3.0% reduction every year. As the transportation sector
accounts for the highest emissions within the Non-ETS sector and there is no potential
to exceed the target for the building and agriculture sector, the transport sector has to
cover the reduction by itself.
Historical data
expected deficit
emission budget
Figure 3: Historical data and expected deficit in the German Non-ETS sector. Source: Agora
201829
Driven by the EU fleet consumption regulation, the car manufacturers will bring the
claimed ‘zero emission and low-emission vehicles’ into the market. But as shown above,
the large and heavy PHEVs will not reduce the emissions in the Non-ETS sector and
their electricity demand will result in additional generation from fossil fuel power plants
and therefore will have an impact in the ETS-sector through a higher electricity demand.
Through credits and super-credits for PHEVs, the CO2 emissions can be reduced on
28
Similar to borrowing and banking of emission allocations (article 5) REGULATION (EU) 2018/842 OF
THE EUROPEAN PARLIAMENT AND OF THE COUNCIL of 30 May 2018
29
Agora Energiewende, Agora Verkehrswende (2018), p. 1712
White Paper EU Fleet consumption regulation
paper, but they will not actually reduce CO2 emissions. On the other hand, the automo-
bile manufacturers are enabled to further expand their product range of heavy vehicles
with high CO2 emissions. The consequence is costly to the tax payers as the non-ETS
sector reduction set by the EU Climate Change Guidelines and the Climate Action Reg-
ulation of 2018 will fall far short and compensation payments will be unavoidable.
8. High compensation payments expected in Germany´s
non-ETS sector
Using the model of Büro Ö-quadrat, we analysed the number of PHEVs and BEVs that
will be necessary to reach the 2025 and 2030 fleet emission targets. To determine the
fraction of electric cars and their impact on the CO 2 emission of the transportation sec-
tor, we made several assumptions:
a) The efficiency of new diesel and gasoline cars will rise by 2% per year from
2018 until 2025 and by 1% from 2026 to 2030. The same assumption was
made for the fossil fraction of PHEVs. The consumer preferences towards
heavier and high power cars e.g. SUVs are omitted.
b) The efficiency of electric cars will rise by 1% 30 per year from 2018 until 2025
and by 0,5% from 2026 to 2030. The same assumption was made for the
electricity consumption of PHEVs.
c) With the technical advancement of BEVs, the ratio between PHEV and BEV
will change. Until 2021, the share of PHEV among electric vehicles
(PHEV+BEV) will increase from the current 40% to 50%. From 2021 to 2025,
the share of PHEV among electric cars will decrease again linearly to 40%.
Until 2030, this share will drop further to 30%.
d) The share of diesel cars among conventional cars will drop from 33,8% in
2018 to 30% in 2021, where it will remain until 2030.
e) PHEVs are counted as low-emission cars with average emissions of
40gCO2/km.
While these simplification and uncertainties do not allow precise predictions; the results
provide a basis for an initial discussion. It is noted that the focus is not on the absolute
values but rather the magnitude as compared to the current situation. Under the above
assumptions, 19% of all newly registered cars in the year 2021 have to be zero-emis-
sion cars or low-emission cars to fulfil the fleet consumption targets. The share of these
cars was less than 2% in 2018, which means a substantial increase in the sale of zero-
emission cars and low-emission cars is needed by 2021. This is unlikely to happen and
therefore, it is very likely that Germany will have to pay for the non-conformance with
30
In respect to the already high efficiency of electric motors13 White Paper EU Fleet consumption regulation the non-ETS sectoral emission targets. In this calculation, the super credits for the zero emission vehicles and the low-emission vehicles are already included. Without the su- per credits, the number of zero emission cars would have to be even higher in 2021. In 2030, 51,2% of all newly registered cars have to be zero emission or low-emission cars to fulfil the EU fleet emission target for new cars. Figure 4: Development of the share of newly registered cars in Germany (Source Büro Ö-quad- rat) Based on the development trend and other assumptions presented above, the car mar- ket will reach a CO2 reduction of 54% in 2030 relative to 2018. Figure 5 shows the CO2 emissions calculated with the EU car fleet regulation (grey solid line). Without the super credits, the average fleet emission would be higher during the period 2020 to 2022 (grey dash line). However, this reduction is merely theoretical. In reality, we have to include the emissions of electricity generation from fossil power plants in 2030 (17 Mio. t CO2 related to 20.2 TWh) for the electric cars and the PHEV31 and the emissions from fossil fuel use in PHEVs. If we assume that PHEVs are driven 70% in combustion mode and 30% in electric mode32, the emissions of PHEVs (from diesel and gasoline) will sum up to 5 Mio t CO2 in 2030. Overall, the average emission of the new car fleet will only be reduced by less than 10% until 2030. 31 Based on electricity consumption measured under NECD, and an emission factor of 843 gCO 2/kWh (aver- age of scenario A and B). 32 Manufacturers will mainly offer PHEV with an electric range of around 50 km, meeting the requirements of count as zero-emission vehicles while minimizing costs. All longer journeys will therefore be driven pre- dominantly by combustion engine. In Öko-Institut et al. the authors calculate with a share of 75 % com- bustion mode, but no references are documented (p. 57).
14

White Paper EU Fleet consumption regulation

Figure 5: Average CO2 emission of newly registered cars in Germany according to the EU car
fleet regulations (theoretical) versus real emissions (Source: own calculation Büro Ö-quadrat)

Finally, we calculated the cost of the faulty EU regulation on PHEVs for the tax payers.
Based on our study, 5 million PHEVs will be sold and registered until 2030. These cars
will in average emit about 1,63 tons of CO2 per year33 through driving with the combus-
tion engine. Over an average lifetime of 12 years with a CO 2 certificate price of
€100/tonCO2,34 this will sum up to €1,955/car over lifetime of the car and €9.8 billion for
the total number of PHEVs that will be brought into market until 2030. Although the
future price of CO2 certificates in the non-ETS sector is uncertain up to now but even at
only €50/tonCO2, the cost for the tax payers will amount to €4.9 billion. These figures
only include the additional costs caused by PHEVs, it does not account for the total cost
that results from the non-conformance of the whole transport sector with the EU non-
ETS sectoral emission targets. Furthermore, the emissions related to the electricity use
of the PHEVs are not included here. These emissions will be counted in the ETS sector,
where they will not influence the quantity of the certificate allowances but will lead to
higher prices for the CO2-certificats.

33
   Assumptions: Average distance with fossil mode is 9800 km per year (70% of 14000 km). Real CO 2 emis-
   sions of 166g/km, average lifetime of cars 12 years
34
   Agora Energiewende, Agora Verkehrswende (2018): p. 28
15

White Paper EU Fleet consumption regulation

There are, however, aspects in the transportation sector, which we have not accounted
for in our study. For the major part, these aspects would lead to higher emissions, which
makes our result a rather optimistic scenario.

     1) This result only describes the development of the emissions of the new car
         fleet. The emissions of the existing car fleet are expected to decrease much
         slower.
     2) This model does not include the growth of the transport sector. The car fleet in
         Germany is still growing; in the period 2010 to 2017, the average growth rate
         was 1,4 % per year. The total distance driven by all cars increased with the
         same growth rate.35 Self-driving cars are also expected to increase the comfort
         of driving and therefore the average distance driven.
     3) This study does not account for the current trend towards larger, heavier and
         more powerful vehicles. If this trend continues, the real emissions of the new
         car fleet will drop even slower or not at all.
     4) After the “Dieselgate” scandal, the sales of diesel engines plummeted (see
         Figure 2) and the demand shifted to gasoline cars, which will emit more CO2
         compared to an equivalent diesel car. The official German statistic shows that
         between 2010 and 2016, the average consumption of all gasoline cars de-
         creased from 7,9 to 7,7 litre/100 km; whilst the average consumption of diesel
         cars remained unchanged at 6,8 litre/100 km36. If the share of diesel car drops
         further, the average fleet emissions can be expected to increase further.
     5) In the past the car manufacturers have achieved a very large part of the effi-
         ciency gains by exploiting the loophole in the testing procedure. This has wid-
         ened the gap between test results and real-world performance from 9% in
         2010 to 42% in 2017, equivalent to 21gCO2/km of fake savings.37 One reason
         of the discrepancy stemmed from the fact that PHEVs are counted as zero
         emission cars as illustrated previously.
     6) “In addition, the industry consistently fits technology to cars that will deflate
         emissions far more in the lab than on the road, such as short-range plug-in
         hybrids, stop-start and cylinder deactivation.”38

35
   DIW: Verkehr in Zahlen 2017/2018, table 309.xlsx
36
   DIW: Verkehr in Zahlen 2017/2018, table 309.xlsx
37
   Transport and environment, April 2018: CO2 EMISSIONS FROM CARS: the facts
38
   Transport and environment, April 2018, page 3
16
White Paper EU Fleet consumption regulation
9. Recommendation on supplementary measures
There is no silver bullet for a successful transformation of the transport sector and to
shift the market to low emission cars. As we have presented above, the EU fleet con-
sumption regulation alone will only achieve a very small reduction in real CO 2 emissions
and must therefore be amended or supplemented by further measures. Our recommen-
dation on the most influential measures is outlined as follows.
10. Amendment of the EU fleet consumption regulation
• PHEVs should not be counted as low emission vehicles and instead, they should
be included into the average fleet consumption calculation with their real emis-
sions.
• Super credits should be avoided as they distort the emission calculations.
• The introduction of BEVs has to be accompanied by accelerating the installation
of new renewable energy capacities.
• A mandatory fleet consumption target should be put on conventional cars without
any compensation possibilities. On the other hand, the target values should be not
as ambitious as in the EU-car-fleet regulation.
• To boost the introduction of zero-emission cars, a flexible quota system would be
a better option.
Carbon tax on gasoline, diesel and aviation fuel
Without a rising CO2-oriented tax, the efficiency progress will be counteracted by addi-
tional demand and additional emissions. A growing number of Member States are using
this instrument to cut emissions from the transport sector, for example, Sweden has
successfully reduced the emissions in the transport sector by 20 % since 2005 with a
CO2 tax39. France has plans to increase the CO2 tax from €45/ton CO2eq to €86 /ton
CO2eq in 2022. However, considering the current social unrest, we believe that such tax
has to be introduced with care and convincing arguments.40
39
Agora Energiewende, Agora Verkehrswende (2018): p. 44, figure 11
40 Agora Verkehrswende (2018): p. 4417 White Paper EU Fleet consumption regulation Taxation on private and commercial cars Only 35% of all new passenger cars and light commercial vehicles sold in Germany are private cars. The rest was bought by companies with tax reduction. This leads to a high demand for high power and expensive cars. Additionally, a new tax regulation in force in 2019 will make it more attractive to buy PHEVs and BEVs41. This regulation will es- pecially foster heavy PHEVs, which will lead to the adverse effects revealed by our study. A good example on how to bring more efficient cars on the road is the French feebate42 system. The registration tax for new vehicles in France is based on the CO 2 emissions of the car (Figure 6). From 2018 onwards, vehicles that emit more than 119 gCO2/km pay a penalty starting at 50€ and increases exponentially up to a maximum of 10,500€ for vehicles emitting more than 184 gCO2/km. Low-carbon vehicle owners with less than 21 gCO2/km benefit from licensing bonus payments i.e. individuals and companies re- ceive a bonus amounting to 27% of the vehicle purchase price with a maximum bonus of 6,000€. Vehicles with CO2 emissions between 21 and 119 g/ km pay no registration tax.43 Figure 6: Vehicle registration tax in France in 2018 (Source: Agora Verkehrswende, 2018) 41 Employees who use a company battery-electric car or a plug-in hybrid vehicle for private purposes only have to pay tax on the pecuniary advantage at a monthly rate of 0.5 percent of the gross list price instead of 1 percent as before. 42 Combination of “fee” and “rebate”. Term is used for instruments which combine the two forces. 43 Agora Verkehrswende 2018, p. 26
18

  White Paper EU Fleet consumption regulation

  Modification of the commuter allowance

  The current calculations of the commuter allowance for employees and self-employed
  people promote commuting over long distances and thus contribute to increased traffic-
  related noise, air pollution and greenhouse gas emissions. In Germany, 68% of com-
  muters use cars for work travel. As a result, the federal government is losing consider-
  able tax revenues, for instance, the commuter allowance summed up to €5.1 billion in
  2012. Against this background, consideration should be made to reform the commuter
  allowance according to ecological criteria. Nevertheless, socio-political aspects of such
  changes must be carefully considered.

  Slow down

  Germany remains the only major industrial country without speed limit on part of its
  motorways and a speed limit of 100 km/h on country roads, which is usually not con-
  trolled. The introduction of a speed limit on motorways and lower speed limits on other
  roads (including city streets) does not only have the immediate effect of lower emission
  but also drive the market towards smaller and more efficient cars. The lower speed limit
  would also increase the electric driving range of electric vehicles. This measure would
  also help to make public transport more competitive as compared to individual transport
  and would reduce the number of accidents.

11.     Conclusion

  The EU fleet consumption regulation is far from reaching the necessary emission re-
  duction in the transport sector in Germany. The 54% reduction target in the average
  CO2 emission from new cars until 2030 might sound ambitious but due to the loopholes
  in the system, real CO2 emissions will only decrease by less than 10%. The regulation
  will allow car manufacturers to continue selling heavy and environmentally unfriendly
  cars. Additionally, it will lead to high financial costs for the German tax payers because
  the government will have to compensate the deficit in the non-ETS sector through the
  purchase of CO2 allowances from other EU countries.

  We presented the necessary change in the EU fleet regulation scheme for passenger
  cars and light commercial vehicles. However, these changes have to be accompanied
  by a climate friendly transport policy that aims to reduce vehicle-kilometres travelled
  and motivate people to change to a transport mode with lower emissions. This can be
  achieved through more investment into public transport, investment into safer and better
  bicycle lanes, attractive pedestrian walkways, fewer and more expensive car parks in
19

  White Paper EU Fleet consumption regulation

  the city and a city toll.44 And last but not least, we need better educational campaigns
  that start in kindergarten and schools.

12.        References

  Agora Verkehrswende (2018): CO2-Minderung bei Pkw – die Rolle der Steuerpolitik.
  Ein europäischer Vergleich.

  Agora Verkehrswende (2018a): Klimaschutz im Verkehr: Maßnahmen zur Erreichung
  des Sektorziels 2030

  Agora Energiewende, Agora Verkehrswende (2018): Die Kosten von unterlassenem
  Klimaschutz für den Bundeshaushalt. Die Klimaschutz-Verpflichtungen Deutschlands
  bei Verkehr, Gebäuden und Landwirtschaft nach der EU-Effort-Sharing-Entscheidung
  und der EU-Climate-Action-Verordnung.

  Amtsblatt der Europäischen Union vom 26.5.2012: Regelung Nr. 101 der Wirtschafts-
  kommission der Vereinten Nationen für Europa (UN/ECE)

  DIW: Verkehr in Zahlen 2017/2018

  International Council on Clean Transportation, January 2014 EU CO2 Emission Stand-
  ards for Passenger Cars and Light-Commercial Vehicles

  Kraftfahrt-Bundesamt November 2018

  Öko-Institut (2011): Autos unter Strom, Berlin, September 2011

  Öko-Institut, Institut für Verkehrsforschung im DLR, Institut für Energie- und Umweltfor-
  schung Heidelberg, Infras AG: Endbericht Renewbility III, Optionen einer Dekarbonisie-
  rung des Verkehrssektors. November 2016

  PAConsulting (2018) DRIVING INTO A LOW EMISSIONS FUTURE – LOOKING BE-
  YOND 2021.

  REGULATION (EU) No 333/2014 OF THE EUROPEAN PARLIAMENT AND OF
  THE COUNCIL of 11 March 2014

  44   A briefly overview is given in Agora Verkehrswende 2018a
20

White Paper EU Fleet consumption regulation

REGULATION (EU) 2018/842 OF THE EUROPEAN PARLIAMENT AND OF THE
COUNCIL of 30 May 2018

Transport&Environment, (2018): CO2-Emissions from cars: the facts. April 2018

UBA 2018: Entwicklung der spezifischen Kohlendioxid-Emissionen des deutschen
Strommix in den Jahren 1990-2017, Berlin, Mai 2018

VCD Umweltliste, Oktober 2018
You can also read