2018 Recreational Boating Participation Research - June 2018 Richard Griffiths Jonathan Dodd Yazad Karkaria - Maritime NZ
←
→
Page content transcription
If your browser does not render page correctly, please read the page content below
2018 Recreational Boating
  Participation Research
            June 2018

         Richard Griffiths

         Jonathan Dodd

         Yazad Karkaria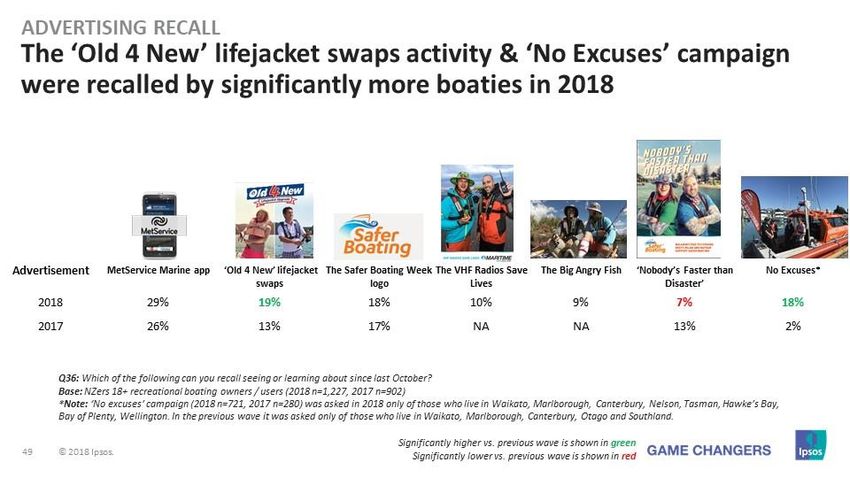
2018 Recreational Boating Participation Research

    Table of Contents

    Table of Contents ...............................................................................................................................2
    Introduction .......................................................................................................................................3
    Background ........................................................................................................................................3
    Conclusions and Recommendations ...................................................................................................5
       Keep Promoting Lifejacket Usage ....................................................................................................5
       Keep Promoting On-Board Communication Devices and Related Education ....................................5
       Keep Promoting Alcohol-Free Boating .............................................................................................6
    Recreational Boating ..........................................................................................................................7
       Population Overview.......................................................................................................................7
       Type of Recreational Vessel Owned / Used ................................................................................... 10
    Attitudes to Boating Safety ..............................................................................................................21
       Overall Boating Behaviour ............................................................................................................. 21
       Emergency Communications ......................................................................................................... 24
       Weather Forecast ......................................................................................................................... 27
       Alcohol Use ................................................................................................................................... 27
       Lifejacket Behaviour...................................................................................................................... 28
    Increasing Behavioural Change ........................................................................................................32
       Underlying Theory ........................................................................................................................ 32
    Increasing Behavioural Change ........................................................................................................34
       Identifying MAPS Factors to Address ............................................................................................. 34
    Safety Messages Awareness ............................................................................................................37
    Summary and Key Insights ...............................................................................................................39

    When referencing this work please use the following citation:
    2018 Recreational Boating Participation Research, June 2018, Richard Griffiths, Jonathan Dodd and
    Yazad Karkaria, Ipsos, Auckland.

2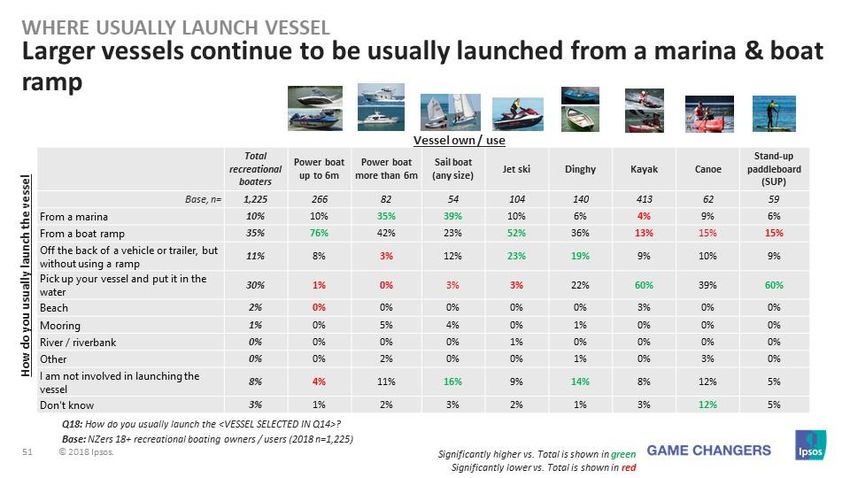
2018 Recreational Boating Participation Research

    Introduction
    This Executive Summary presents the results of the 2018 Recreational Boating Survey which was
    conducted amongst the general adult public (a nationally representative sample of New Zealand
    adults, aged 18 years and over) regarding their boating habits. This research was conducted by Ipsos
    New Zealand on behalf of the Safer Boating Forum, led by Maritime New Zealand (Maritime NZ).
    The purpose of the survey is to examine the extent to which the New Zealand adult population
    currently participates in recreational boating activities, with a focus on safety-related attitudes and
    behaviours, and awareness of Maritime NZ’s recent recreational boating safety campaigns and
    related activities.

    Background
    In 2013 Maritime NZ commissioned Research NZ to conduct a telephone survey on recreational
    boating to estimate the ownership of recreational vessels, the general public’s involvement in
    recreational boating, and their attitudes towards recreational boating safety behaviours. This
    information helped build a profile of the recreational boating community, including the types of
    boats being used, the number of boats, and how often they were used. The research was run again in
    2014 with the results from each year being combined in order to achieve a sufficient sample size.
    In 2016 Research NZ was commissioned to run a larger telephone survey regarding New Zealanders’
    recreational boating attitudes and behaviours. Between March and April 2016, Research NZ surveyed
    1,500 New Zealanders aged 18 and over. The purpose of the survey was to examine the extent to
    which New Zealand’s adult population currently participate in recreational boating activities, with a
    focus on their safety-related attitudes and behaviours and their awareness of Maritime NZ’s recent
    recreational boating safety campaign. Only households with landline phones were surveyed as part
    of this research.

    Change of methodologies / research providers
    In 2016 Ipsos New Zealand was commissioned to undertake the Recreational Boating Survey in 2017.
    The survey was conducted online amongst a nationally representative sample of the adult
    population, reflecting the declining use of landline phones in New Zealand and the now well-
    established methodology of online surveying. Respondents were recruited from an online research
    panel (SSI https://www.surveysampling.com) and were emailed a link to the online questionnaire to
    complete1. The online (2017) and telephone (2016) questionnaires were kept as similar as possible to
    reduce any possible biases caused by the different data collection methods, but the ability to show
    visuals and ask more complex questions within the online environment will inevitably have led to
    some difference in response. Ipsos conducted the 2017 online survey from 24th April to 8th May 2017.
    Ipsos repeated the online Recreational Boating Survey in 2018 with data collection from 23rd April to
    8th May 2018. While the most recent survey repeated the questions asked during the previous year,
    it added new questions about the amount boaties spent on fuel and types of fuel, the frequency of
    boating trips compared to 2017, and reasons as to why their vessel usage changed or stayed about

    1
      The 2016 results referred to above are available to access on the Maritime NZ website for further reference
    (https://www.maritimenz.govt.nz/recreational/safety-campaigns/recreational-research.asp#research_2016).

3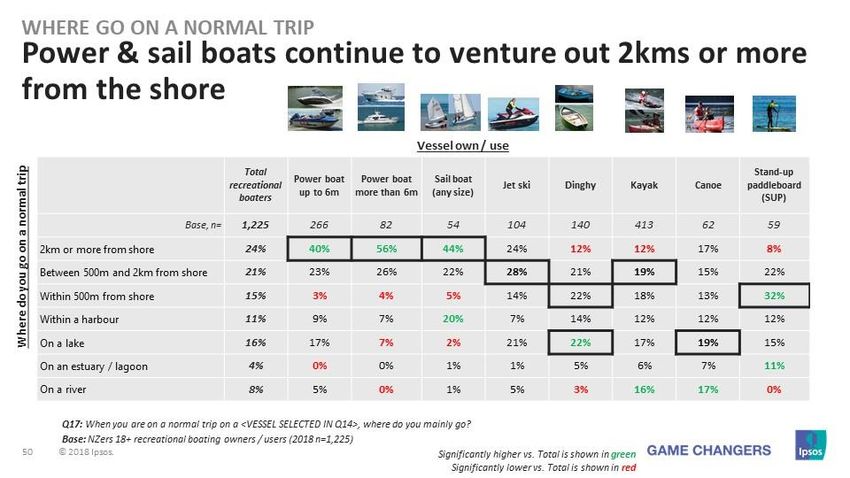
2018 Recreational Boating Participation Research

    the same. Additionally, respondents were asked to recall only a small number of national Safer
    Boating campaign or activities compared to the previous year.
    This reduction in the number of Safer Boating initiatives reflects the reduction of Maritime NZ’s
    amount of national advertising in the previous 12 months. Recall levels of local initiatives were low
    due to the sample being representative at a national level.
    The last key point of difference between the 2017 and 2018 waves of data collection is that ‘booster’
    samples were gathered in the Auckland, Waikato, Canterbury, and Wellington / Wairarapa regions.
    While this reflects these areas’ status as the top-four boating regions in the country, the increased
    number of respondents from these particular areas also seeks to provide regional councils with an
    even more robust picture of recreational boating in these locations. In both waves of Ipsos data
    collection, data was slightly weighted to align to New Zealand population statistics.
    For the 2018 survey, results based on the total sample of the general adult population interviewed
    (n=3,101) are subject to a maximum margin of error of ± 1.76 percent (at the 95 percent confidence
    level).

    Impact of the summer season to the results
    Significantly, the different types of summers experienced since 2016 must be considered when
    making direct comparisons between 2016 to 2018. While the 2016 survey was conducted after one
    of the country’s hottest summers on record, the 2017 survey was conducted following one of the
    worst summers New Zealand has had. Last year’s report noted that cold and windy weather was
    common along with decreases in sales of sunscreen and ice cream, indicators of cooler summer
    weather.
    In its Seasonal Climate Summary issued in March 2018, NIWA’s National Climate Centre stated that
    the 2017–18 summer was the hottest summer on record in New Zealand. Temperatures were
    reportedly well above average across all regions (>1.20°C above the summer average) and 54
    locations across the country recorded their hottest summer on record. Interestingly, rainfall levels
    were highly variable from month to month and the impacts of ex-tropical cyclones Fehi and Gita in
    February 2018 were especially significant with that month being the wettest month of the 2018
    summer. More specifically, Fehi affected the West Coast, Dunedin, Nelson, some parts of
    Christchurch, the western Auckland region, the Opotiki District (Bay of Plenty) and the Far North
    District (Northland region). Gita on the other hand led to a state of emergency being declared in
    Christchurch, the Selwyn District, the Grey District, the Buller District, the New Plymouth District and
    the Nelson-Tasman region. Some parts of the Auckland and Wellington regions (particularly
    Paraparaumu) were also notably affected by Gita.

4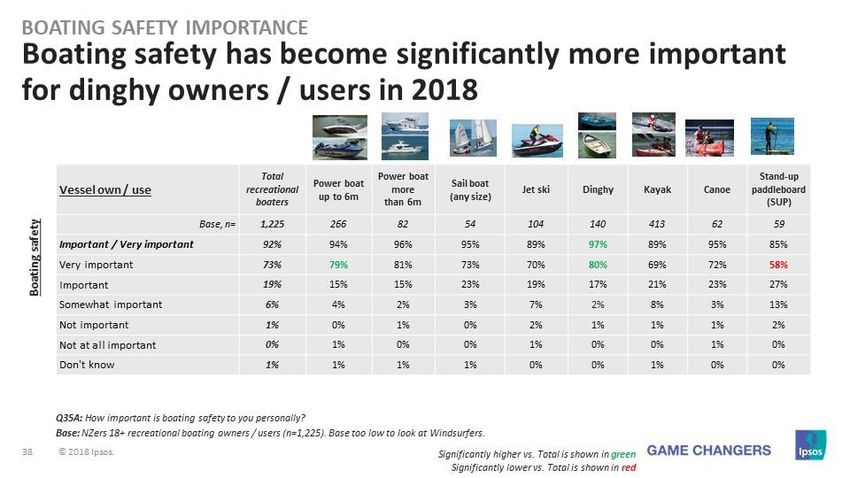
2018 Recreational Boating Participation Research
Conclusions and Recommendations
The four key risk factors identified and targeted by the Safer Boating Forum are:
1) Failure to wear lifejackets in small craft;
2) Not being able to communicate when an accident happens;
3) Failing to check forecasts to avoid boating in bad weather and sea conditions (and)
4) Avoiding alcohol consumption, as it is likely to impair judgement and may be a factor in
accidents and fatalities.
The 2018 research indicates that while some significant improvements have clearly been made by
recreational boaties in some of these key areas, there is still room to further improve risk-related
behaviour on the water.
Keep Promoting Lifejacket Usage
Lifejackets are still reportedly the most prevalent form of safety device taken on boating trips. For
example, the majority of recreational boat owners / users say that they wear a lifejacket the entire
time they are on the water ‘every time’ or ‘most of the time’. Similarly, a majority of boaties also say
they ensure there are enough lifejackets for all their passengers ‘every time’ they go out on a normal
excursion.
This report however also shows that the number of adult passengers wearing a lifejacket the entire
time they are on the water has also been gradually decreasing in recent years. Further, since 2017 to
2018 approximately a fifth of boaties report that they wear a lifejacket either ‘never’, ‘not very often’
or only ‘some of the time’. The fact this is both a key risk factor and this number has not changed
over the last two years is of concern.
Lifejacket Behaviour Change Priorities:
Continue to promote the message that lifejackets should be worn by all passengers of all
ages at all times and that there should be no complacency regarding this behaviour by
skippers and passengers alike.
Continue to promote the message that large groups of passengers need to be provided with
a lifejacket as soon as they join a boating party and that skippers should always have spare
lifejackets on board to cater for additional or unexpected guests.
Keep Promoting On-Board Communication Devices and Related Education
The 2018 results indicate that boaties are taking signalling more seriously and have listened to the
message that they should have at least two ways to call or signal for help. For instance, there has
been a significant increase in the number of people having at least two ways to either call or signal
for help if needed ‘every time’. While the use of Personal Locator Beacons (‘PLBs’) have also
continued to increase, Emergency Position Indicating Radio Beacon (‘E-PIRB’) usage has significantly
decreased. This could reflect the rising popularity of PLBs which are less expensive and smaller than
in the past. However, like last year the issue of boaties not being aware whether the beacons being
used have been registered continues to be an ongoing issue and this number has slightly increased
from last year.
Communication Behaviour Change Priorities:
Continue to reinforce the message and practice that boaties carry at least two forms of
communication that work when wet.
5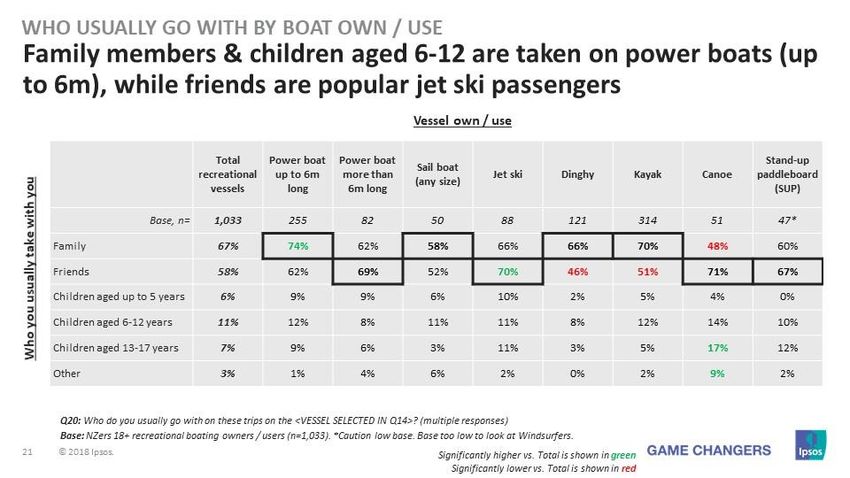
2018 Recreational Boating Participation Research
The need to improve knowledge around the legality and process associated with distress
beacon registration is arguably even more pressing than it was 12 months ago and requires
ongoing education amongst the boating community at the national level.
Continue to promote online training for communication devices. These second and third
priorities fit with the NZ Safer Boating Forum’s current Strategic Plan (2015-18) intended
impact for programme implementation which states “Education and training course uptake is
increased nationally”.
Keep Increasing Marine or Mountain Weather Forecast Usage
Compared to 2017 it is also evident that significantly more boaties are checking either the marine or
mountains forecast before every boating excursion. The current study shows a significant increase in
relation to this behaviour. Additionally, an equal number have maintained their weather checking
‘most of the time’ across the last two years. This indicates the act of checking these types of
forecasts is possibly becoming more habitual amongst a wider range of boat owners / users.
Although these statistics pertaining to weather forecast are very encouraging, it is evident that even
more boaties could still change their behaviour where this key risk factor is concerned.
Behaviour Change Priorities for Weather Checking:
Weather as an issue has the potential to have high ‘talkability’ or be a popular topic of
conversation. This notion could be potentially employed as a base to further inspire all
boaties to always check the weather whilst on land and at sea and make it a social, group-
based activity via the sharing of phones and/or other communication devices.
Keep promoting MetService weather apps to boaties.
Keep Promoting Alcohol-Free Boating
Significantly more boaties reported they are avoiding alcohol before or during their boating trips
‘every time’ in 2018 compared to the previous year. The statement and result for ‘It's OK to drink
alcohol for the type of boating I usually do’ which was asked as part of the Physical factors
underpinning the MAPS model of behavioural change however suggests a different perspective
regarding alcohol consumption on vessels. The MAPS model contends there are four MAPS areas
where behaviour is able to be influenced: a) Motivational Factors; b) Ability Factors; c) Physical
Factors, and d) Social Factors. This model is discussed later in the Executive Summary (see page 34).
Behaviour Change Priorities for Reducing Alcohol Consumption:
Continue to promote avoidance of alcohol amongst all age groups of recreational boat
owners/ users.
6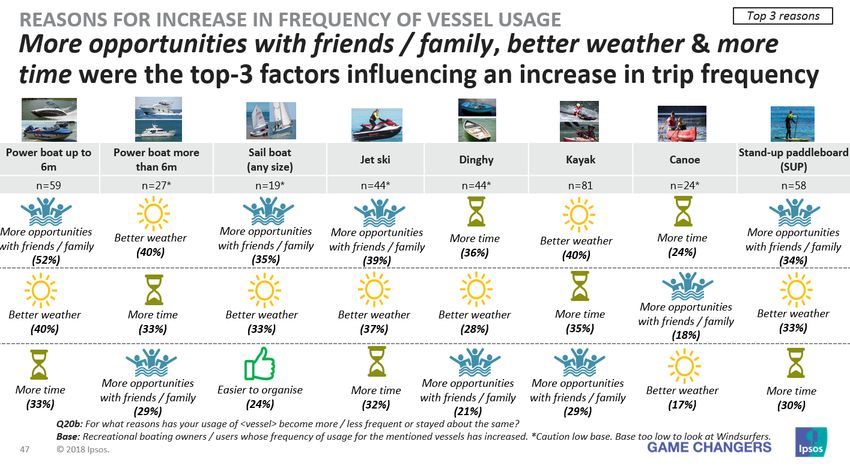
2018 Recreational Boating Participation Research

    Recreational Boating
    Population Overview
    Of the 3,101 people surveyed, 42% identified themselves as being involved in recreational boating.
    Based on this, and the Statistics NZ population as of May 2018 (aged 20 years and over), this
    represents approximately 1,515,864 adult New Zealanders who are involved in recreational boating2.

    Note: The 2017 and 2018 surveys were both conducted following the summer period.

    ‘Involved’ is defined as either owning a recreational vessel, in charge of or skippering a recreational
    vessel (but do not own), or spending time on a recreational vessel (but do not own or skipper it). The
    definition of recreational vessels ranges from small vessels (windsurfers / kayaks) to larger vessels
    (power boats / sail boats more than 6 metres [20 feet] long).

    2
      Data which is available on the Stats NZ website was used to calculate the number of New Zealanders who are involved in
    recreational boating. Note: given the age bands that are provided by Stats NZ, it was only possible to calculate population
    figures for those aged 20+ years.

7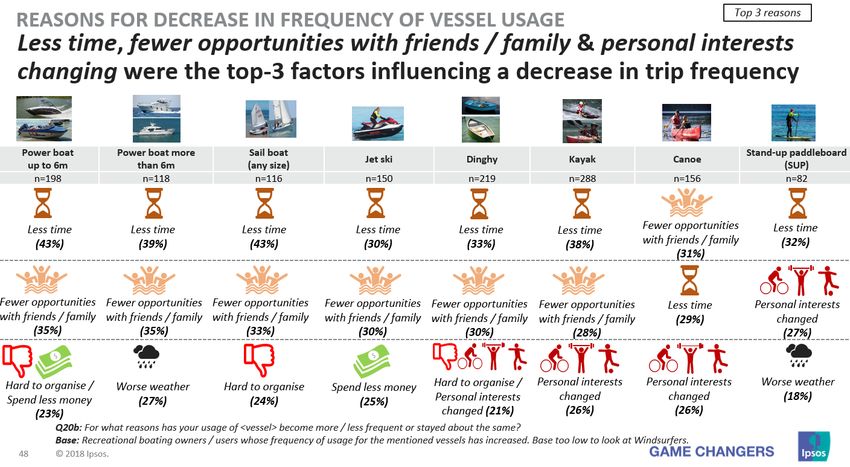
2018 Recreational Boating Participation Research

    The majority of the recreational boating community members in New Zealand are male (54% vs. 46%
    females in 2018). There has been virtually no change in the number of male and female recreational
    boaties between 2018 and 2017 (see Gender table above).

    Recreational vessel users are again more likely to be New Zealand European in 2018. Although there
    has been very little change in the number of boaties who identify as Māori over the last three years,
    there was a slight decrease in the number of Māori boaties this year. Having less available time,
    fewer opportunities and invitations to boat with friends or family, and it being harder to organise or
    arrange appear to be reasons underpinning this particular change. The numbers of Chinese and
    Indian boaties have remained relatively stable. Again, the methodological change to online surveying
    demonstrates how a wider range of people are able to participate in Maritime NZ’s Recreational
    Boating Survey than in the past.

8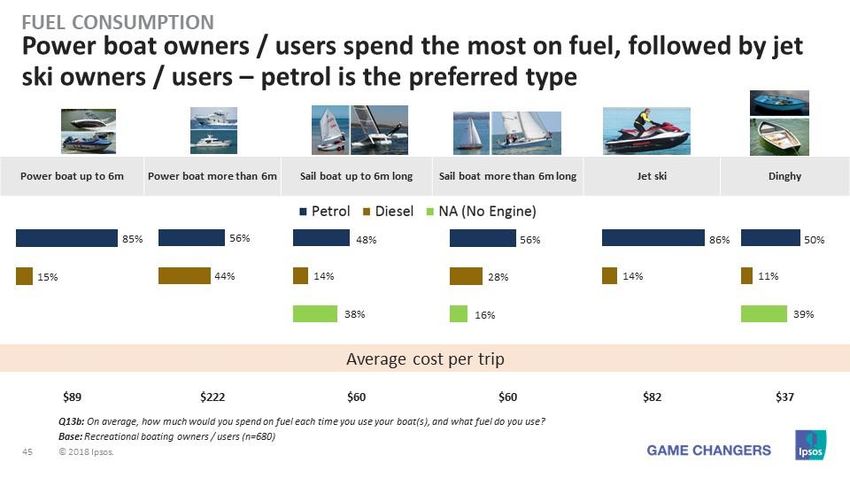
2018 Recreational Boating Participation Research

    Recreational vessel owners / users are again more likely to reside in the upper North Island in 2018,
    with 37% living in the Auckland region (no change from 2017). While there was no change between
    2017 and 2018 in the Waikato region (both 9%), there was only a one percent difference in the
    Wellington / Wairarapa region between these years with regards to where boaties live (9% in 2018
    vs. 8% in 2017). In the South Island regions, the recreational boating community was again largest in
    Canterbury / West Coast (12% in 2018 vs. 14% in 2017), followed by Otago (5% in both 2018 and
    2017).

    The number of younger recreational boaties has decreased slightly from 42% in 2017 to 39% in 2018.

9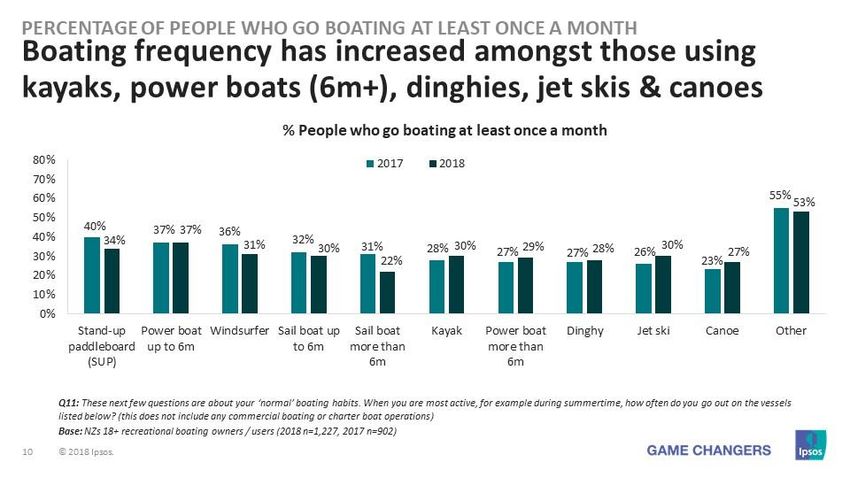
2018 Recreational Boating Participation Research

     To what regions do they mostly take their recreational vessel?
     While recreational vessel users have continued to stay fairly close to the area they live when boating,
     Auckland boaties have travelled into three other regions to enjoy the water (e.g. Northland, Waikato,
     and the Bay of Plenty). Most boaties in comparison tended to venture into only one or two additional
     regions during the previous 12 months. In 2017 Aucklanders did not visit the Bay of Plenty and chose
     to go to Waikato slightly more (10% in 2018 vs. 13% in 2017).

     Note: Responses for some regions were grouped, as base sizes were too low to look at individual regions. Percentages below
     10% not shown.

     Type of Recreational Vessel Owned / Used
     In 2018 kayaks are again the most popular form of recreational vessel owned or used by boaties in
     New Zealand. Ownership / usage of this type of small craft has grown slightly from 32% in 2017 to
     33% in 2018.

10
2018 Recreational Boating Participation Research
Those using kayaks, large power boats, dinghies, jet skis, and canoes at least once a month appear to
have gone out on these types of vessels more in 2018 compared to the previous year. Although they
were only incremental, jet skis (30% in 2018 vs. 26% in 2017) and canoes (27% in 2018 vs. 23% in
2017) both saw increases of 4 points in their ‘normal’ recreational use. Having more opportunities
with family / friends, better weather, and more available time were all cited by these types of
recreational boaties as key driving factors behind this increase in use.
Conversely, stand-up paddleboards (“SUPs”), windsurfers, and both categories of sail boats all saw
decreases in their ‘normal’ recreational usage. Large sail boats (i.e. 6 metres+) saw the largest
decrease in monthly usage by recreational boaties (22% in 2018 vs. 31% in 2017). Sail boat users
indicated having less time, fewer opportunities with family / friends, and it being harder to organise
as the top-three reasons why they did not go out on their vessels as much in 2018.
Change in boating frequency
Asked for the first time in 2018, this question asked boaties how much their time on the water had
changed between May 2017 to April 2018 compared to the equivalent 2016–17 period. SUP and jet
ski owners / users increased their boating trip frequency the most (25% and 14% respectively), while
the amount windsurfers and canoeists went on excursions decreased more than for any other
boaties (54% and 52% respectively). The majority of boaties reported that their trip frequency stayed
fairly close to levels undertaken in 2016–17.
112018 Recreational Boating Participation Research
Note: This question was not asked in the 2017 survey.
Note: This question was not asked in the 2017 survey.
122018 Recreational Boating Participation Research
Note: This question was not asked in the 2017 survey.
In relation to asking boaties how much their time on the water had changed between recent years,
participants were also asked for the first time in 2018 why their usage of vessels had become more /
less frequent or stayed about the same. More opportunities with friends / family, better weather, and
more available time were the top-three factors influencing an increase in trip frequency. The top-
three factors which led to a decrease in how much they used their vessels were reportedly having
less time, fewer opportunities with friends / family, and personal interests changing. There was more
variation between the factors which influenced increases in vessel usage.
Demographic differences by type of recreational vessel use
As in previous years, there are numerous significant demographic differences when comparing
recreational vessel use across New Zealand in 2018.
Note: Responses for sail boats up to 6 metres (20 feet) long and sail boats more than 6 metres (20 feet) long were combined,
as the base was too low to look at sail boats more than 6 metres (20 feet) long individually.
132018 Recreational Boating Participation Research
Other vessels owned, used, or spent time on
The results from 2018 show that owners / users of recreational vessels continue to own, use, or
spend time on a range of other vessels, especially smaller craft such as kayaks and dinghies. Jet ski
owners / users are more likely to also own, use, or spend time on large power boats and sail boats of
any size.
Boating experience
More than a third of recreational boaties in 2018 reported having 6–20 years’ experience, which is a
small increase from the previous year (36% in 2018 vs. 33% in 2017). Like the 2017 report, this
finding reinforces that the average experience level amongst recreational boaties is continuing to
decrease.
142018 Recreational Boating Participation Research
Length of typical trip
The 2018 results indicate that the majority of recreational boaties tend to spend 1–4 hours on a
range of smaller vessels such as kayaks, canoes, SUPs, and jet skis. Those using power boats (up to
6m) enjoyed more trips that lasted between 4 hours to 1 day than the previous year (46% in 2018 vs.
35% in 2017). Some 21% said a typical trip on larger power boats (6m+) in 2018 usually lasted
overnight or two or more days (21% in 2018 vs. 16% in 2017). The greater suitability of larger, more
powerful vessels to longer excursions is again a key factor here.
In 2018 there was a significant decrease in the overall number of recreational boaties going on short
trips between 500m and 2km from shore (21% in 2018 vs. 25% in 2017). Instead, the most frequent
excursions undertaken in 2018 were two kilometres or more from shore (24% in 2018 vs. 21% in
2017). The shift in distance travelled in 2018 could potentially be attributed to how more time was
spent on larger or more powerful vessels which are capable of longer voyages, as well as better
weather conditions which were also reported by power and sail boat users.
152018 Recreational Boating Participation Research
When analysed specifically by boat type, the greatest distance travelled in 2018 is two or more
kilometres from shore by power and sail boat owners / users. While this is significant compared to
other boat owners / users, it is also an increase from the previous year:
2018
Power boat up to 6m – 40%; power boat more than 6m – 56%; sail boat of any size – 44%.
2017
Power boat up to 6m – 32%; power boat more than 6m – 45%; sail boat of any size – 35%.
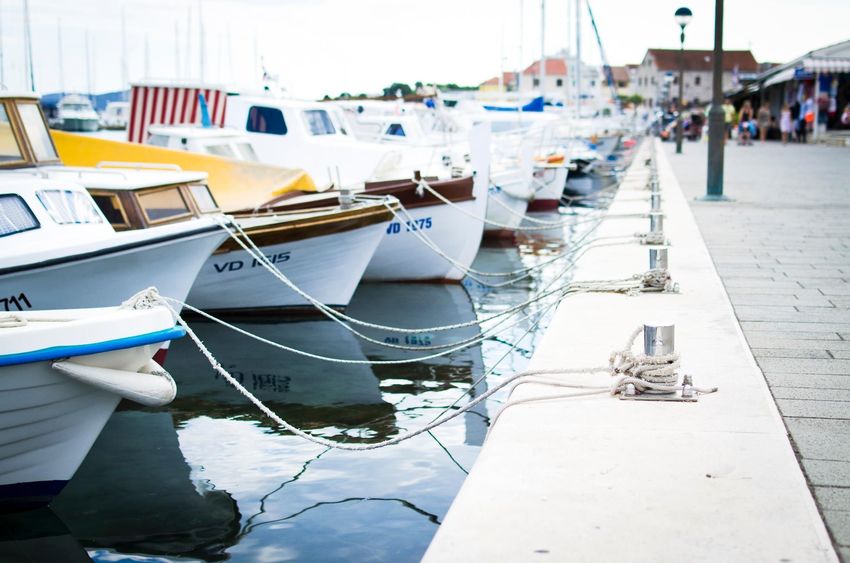
Vessel launch
As in 2017, boat ramps and putting vessels straight into the water are the most common forms of
launch overall. Slightly more boaties picked up their vessel and put it in the water than the previous
year (30% in 2018 vs. 27% in 2017). When analysed by vessel type, larger vessels continue to be
usually launched from a marina or boat ramp.
162018 Recreational Boating Participation Research
Some 80% of jet skiers in 2018 reported using their engine for at least half their trip through to the
entire time they were out on the water (no change from 2017).
Fuel spend and preferred type
The answers to this question, which was first asked in 2018, indicated owners / users of power boats
over 6 metres and power boats up to 6 metres spent the most money on fuel on average per trip
respectively at approximately $222 and $89, followed by owners / users of jet skis who spent around
$82 per boat trip. In terms of fuel type, petrol is clearly used over diesel by 50% for more of five out
of six vessel types which can be operated with an engine.
172018 Recreational Boating Participation Research
Note: This question was not asked in the 2017 survey. The reduced sample size is due to this question being asked only of
those who operate a vessel with an engine.
Who they go with
In 2018 the majority of recreational boaties elected to go out on the water with at least one person
or a number of other people. There was little difference between this year and 2017 (84% in 2018 vs.
86% in 2017). In terms of the types of craft boaties go out on, those owning or using power boats of
over 6 metres in 2018 are significantly more likely to go out with either 2-3 people (44%), 4-5 people
(26%) or groups of five or more passengers (14%). Of the smaller craft, those venturing out on
dinghies were significantly more likely to go out with just one other person (58% in 2018).
182018 Recreational Boating Participation Research
Family and friends continue to be the most common type of passengers. However, in 2018 the
number of friends joining boat owners / users increased, and this difference was significant (58% in
2018 vs. 53% in 2017). There was also a significant increase in children aged 6–12 years of age going
out on regular boat trips (11% in 2018 vs. 7% in 2017). These types of young passengers most
frequently went out on excursions where there were either 4-5 other people on board (21%) or more
than five other passengers (20%). Family (74%) and 6-12-year-old children (12%) were regularly taken
on power boats (up to 6m), while friends were also popular passengers when jet skiing (70%). These
numbers for family and friends were significant.
192018 Recreational Boating Participation Research 20
2018 Recreational Boating Participation Research

     Attitudes to Boating Safety
     Overall Boating Behaviour
     The four key risk factors identified and targeted by the Safer Boating Forum are:
           1)   Failure to wear lifejackets all the time;
           2)   Not being able to communicate for help when an accident happens;
           3)   Not checking the weather forecast before going out;
           4)   Alcohol use, (and)
           5)   Skipper responsibility.
     The Safer Boating Forum emphasises skipper responsibility and these four risk factors. The 2018
     research indicates that the general population continues to see overall boating safety as important,
     with recreational vessel owners / users again feeling personally stronger about boating safety. The
     strength of conviction around personal boating safety amongst recreational vessel owners / users
     has slightly increased from 71% in 2017 to 73% in 2018.

     In 2018 92% of recreational vessel owners / users claim that overall boating safety is important to
     them personally (vs. 90% in 2017). Interestingly the previous year it was reported that those who
     own / use a large power boat (6m+) viewed boating safety as significantly less important. This year’s
     result clearly shows that this type of boat owner / user has undergone a positive change regarding
     safety (96% in 2018 vs. 80% in 2017). Boating safety has also become significantly more important for
     dinghy owners / users in 2018 (97% vs. 94% in 2017).

21
2018 Recreational Boating Participation Research
The importance of general boating safety has remained unchanged among recreational boaties in
2018.
222018 Recreational Boating Participation Research
Like last year, lifejackets are the most common form of safety device taken on board (87% in 2018 vs.
86% in 2017). Significantly more boaties have taken air horns on board during the past 12 months
(11% in 2018 vs. 8% in 2017).
In 2018 significantly more boaties are checking the weather (85% in 2018 vs. 81% in 2017) and also
making sure that there are at least two ways that they are able to call or signal for help (69% in 2018
vs. 65% in 2017) when compared to last year.
232018 Recreational Boating Participation Research
Owners / users of power boats under 6 metres are significantly more likely to make sure they have all
the safety devices asked about when they go out on the water. They are also more likely to carry a
cell phone in a waterproof bag compared to other boat owners / users (59% vs. 55%). The other
large-vessel owners / users are also significantly more likely to carry a much wider range of safety
devices than those operating smaller water-based crafts. Encouragingly, dinghy owners / users were
significantly more likely in 2018 to include a cell phone in a waterproof bag than owners / users of
other small vessels (66% vs. 55%). SUP owners / users were again significantly less likely to carry any
safety devices (20%).
Emergency Communications
Maritime NZ recommends that recreational boaties carry at least two forms of communication that
will work when they are wet. Maritime NZ also recommends that these devices work in the area that
the boaties are boating in.
The current research shows that fixed radios continue to be the most common form of marine VHF
radio taken on board (71% in 2018 vs. 70% in 2017). There has been no change in the number of
people who indicate they ‘never’ take a marine VHF radio, which is a positive outcome in terms of
safety equipment brought on excursions (25% in both 2018 and 2017) (see the ‘What do you ensure
is on the boat?’ table overleaf).
242018 Recreational Boating Participation Research
While even more recreational boaties are carrying PLBs on board in 2018 (49% in 2018 vs. 42% in
2017), the percentage of those taking E-PIRBs has significantly decreased (42% in 2018 vs. 52% in
2017).
252018 Recreational Boating Participation Research
In 2018 there has been yet another decrease in distress beacons being registered (55% in 2018 vs.
58% in 2017). Coupled with the even higher lack of awareness of registration amongst boaties (34%
in 2018 vs. 31% in 2017), the need to improve knowledge around the legality and process associated
with distress beacon registration is arguably even more pressing than it was 12 months ago.
Compared to 2017, it appears that more boaties are taking signalling seriously. There has been a
significant increase in the number of people having at least two ways to either call or signal for help if
needed ‘every time’ (43% in 2018 vs. 38% in 2017).
262018 Recreational Boating Participation Research
Weather Forecast
The percentage of boaties who say they check either the marine or mountains forecast ‘every time’
prior to excursions has significantly increased compared to 2017 (58% in 2018 vs. 52% in 2017). An
equal number have maintained their weather checking ‘most of the time’ in the past two years (19%
in both 2018 and 2017). This indicates the act of checking these types of forecasts is possibly
becoming more habitual amongst a wider range of boat owners / users.
Alcohol Use
The decision to avoid alcohol either before or during their time on the water ‘every time’ has also
significantly increased compared to 2017 (67% in 2018 vs. 61% in 2017). The higher proportion of
boaties not including alcohol is extremely encouraging in terms of reducing one of the four key risk
factors actively identified and targeted by the Safer Boating Forum.
272018 Recreational Boating Participation Research
Lifejacket Behaviour
A clear majority of people indicated they wear a lifejacket for the whole duration of their boating trip
‘every time’ or ‘most of the time’ with the results almost identical to the previous year (combined
75% in 2018 vs. combined 76% in 2017). The percentage of those boaties who report they wear a
lifejacket either ‘never’, ‘not very often’, or only ‘some of the time’ has been a combined 22% from
2017 to 2018. The fact that this is a key risk factor and this number has not changed over the last
three years is cause for concern. More positively, with regards to lifejacket storage, a quarter of all
boaties ensure they have five or more lifejackets on board in 2017 and 2018.
282018 Recreational Boating Participation Research
Given that many excursions with family and friends involve fairly large groups with four, five, or more
people, it is very encouraging that nearly 75% of boaties say they ensure there are enough lifejackets
to cater for all passengers ‘every time’.
292018 Recreational Boating Participation Research
The number of adult passengers wearing a lifejacket the entire time they are on the water has
decreased slightly (49% in 2018 vs. 50% in 2017). The significant decreases in the number of children
who wore lifejackets only ‘some of the time’ (4% in 2018 vs. 8% in 2017) or ‘most of the time’ (8% in
2018 vs. 13% in 2017) are also worth noting. In 2018, only 49% of adult passengers wore a lifejacket
the entire time they were on the water compared to 69% of child passengers, and this result was
significant.
302018 Recreational Boating Participation Research
This year 92% of recreational vessels owners / users indicated that boating safety is important to
them personally (vs. 90% in 2017). As with last year’s results, the attitudes and behaviours to boating
safety do not always correspond with what is being said. This can also be either positive or negative,
as well as significantly different when analysed by vessel type. Kayakers and canoeists are again
significantly more likely to display positive boating behaviours versus those who own / use larger
power boats. Owners / users of power boats up to 6 metres and dinghy owners on the other hand
are significantly more likely to ensure there are enough lifejackets for all their passengers.
312018 Recreational Boating Participation Research
Increasing Behavioural Change
Underlying Theory
The questionnaire used for the 2018 Recreational Boating Survey contained the same questions used
in the 2017 survey which are based upon the MAPS model of behavioural change. This contends
there are four MAPS areas where behaviour can be influenced. These are:
M. Motivational Factors
A. Ability Factors
P. Physical Factors
S. Social Factors
This model was used to better understand the barriers that exist in relation to the four key
behaviours3 where Maritime NZ desires an increased amount of behavioural change in terms of:
Lifejacket usage
Weather checking
Taking sufficient forms of signalling
Avoiding alcohol while boating
These four MAPS factors and examples of how they can relate to safe boating behaviour are
explained in more detail below.
A. MOTIVATIONAL FACTORS
There are many roads to increase or decrease motivation. Tapping into hidden motivations or
conscious goals, intentions, and commitment is one road; relying on a positive incentive or a
reinforcement mechanism (e.g. rewarding people seen to be using lifejackets) or negative
consequences (e.g. the ‘Don’t Be A Clown’ and ‘Joe Bro’ campaigns that made it socially
unacceptable to boat without a lifejacket) to initiate and shape a new habit is a different one. Using
cognitive mechanisms like our aversion to losses can also greatly impact motivation.
Because motivation can be short-lived, inconsistent, and fickle, the more roads to motivation that
can be mustered, the better. This includes new developments in areas such as augmented and virtual
reality, which can give people experiences that are so emotionally life-like that they feel more
motivated than if just information alone was transmitted. The virtual reality experience recently used
in New Zealand to give people the experience of being trapped in a burning house could for instance
be extended to demonstrate how quickly one can be swept overboard.
B. ABILITY FACTORS
Some behaviours are hindered by our physical abilities such as the inability to use a marine VHF radio
or wearing a poorly fitted lifejacket. Others are simply hindered by lack of awareness (i.e. not being
aware of safer boating resources such as marine weather apps) or a lack of skill (i.e. being able to
decipher marine-specific terms such as ‘swell’). Cognitive mechanisms can also hinder our ability to
change behaviour (e.g. a natural preference to do things as they have habitually been done).
3
Note that when setting priorities, each set of questions (lifejacket usage, weather-checking, etc.) will have been answered
by approximately similar numbers of respondents, assigned in a manner to ensure that respondents had to answer only one
answer-set each. Therefore, if priorities are to be set for one of these behavioural change areas, we recommend looking at
the incidence levels recorded in Q30 (regularly use lifejackets, emergency communications, etc.) to identify where the
greatest changes are desired.
322018 Recreational Boating Participation Research
In many situations, people need to take new information or cues on board to change their
impression and their behaviour, and confirmation bias becomes a cognitive obstacle to our ability to
perform the behaviour. For example, new information about a changed weather forecast can be
rejected if other boaties are seen to be heading offshore, thereby confirming one’s view that a
potentially questionable behaviour is acceptable.
The environment we create also plays a part in ensuring we have the ability to perform a behaviour.
Many devices provide a way to self-regulate our behaviour (e.g. the Coastguard and MarineMate
apps with safety information). Technology like these apps can increase our physical and cognitive
ability to perform specific behaviours, thus making it easier and more convenient to make safer
decisions. For example, the MetService weather app indicates how users should potentially dress and
what sun protection to use.
C. PHYSICAL FACTORS
The physical environment not only provides cues as to why desirable behaviour is not happening (e.g.
lifejackets not easily accessible or alcohol brought on board), it also offers opportunities to
encourage better behaviour. This could be done by unobtrusively encouraging people to imitate
other people (e.g. signs showing boating role models like the Big Angry Fish duo wearing lifejackets at
boat ramps), by adding visuals to text information, or by priming people with sensory cues so that
thoughts or options become more available to their mind and are more likely to influence their
impressions, preferences, and behaviour at the right moment (e.g. lifejacket messages on buoys).
The environment can also influence behaviour by changing the architecture of the choice
environment (e.g. people must make conscious choices) or creating cues that make desirable default
choices more visible and / or more attractive (e.g. giving boaties with lifejackets preferred access to
boat ramps).
Time can also be used to disrupt existing patterns and behaviours or create meaningful associations
leading to new behaviours. Changing smoke alarm batteries with daylight saving is now a common
meme, while safer boating behaviours might also be linked into key dates such as boat maintenance
at Labour Weekend.
D. SOCIAL FACTORS
Individual behaviour is very strongly shaped by other people, through a range of social norms. We
can be influenced by what we see other people (e.g. parents, friends, or celebrity boaties such as Big
Angry Fish) do or what we think they expect us to do. We are also more likely to follow up on
commitments if they happen to be made publicly (or at least in the eye of significant others). Our
impressions, judgment, and decisions are influenced by an innate sense of fairness or a learned sense
of obligation to reciprocate.
This is further compounded by social media, which provides new avenues to harness social forces in
our quest for behaviour change.
332018 Recreational Boating Participation Research
Increasing Behavioural Change
Identifying MAPS Factors to Address
As discussed earlier, Maritime NZ has identified four key safer boating behaviours which are of the
greatest priority:
Lifejacket usage
Weather checking
Taking sufficient forms of signalling
Avoiding alcohol while boating
Respondents were again asked in 2018 about their normal habits in relation to these behaviours and
were allocated a set of questions pertaining to their ‘unsafe’ behaviours (unless they reported safe
behaviours in all four areas). These are discussed below.
Emergency communications
‘Non-Signallers’ is the term we have used for those who do not always ensure that they have at least
two forms of communication on board when going boating. The current study shows that
Motivational factors are again strong for these people. There continues to be a lower desirable
response in the Ability, Social, and Physical factor categories for Non-Signallers in 2018.
Note: Figures in blue represent the desirable response for that behaviour. Base too low to look at results by vessel type.
Weather forecast
‘Non-Weather Checkers’ is the term we have used for those who do not always check the marine or
mountain forecasts before going boating. Note that the questionnaire developed in collaboration
with Maritime NZ included marine VHF radio capability factors, as these can influence the ability to
check weather forecasts on the water. In 2018 Motivational factors are primarily stronger overall and
Physical factors have improved on last year’s result. Although Ability factors have also become
stronger than last year, the results still indicate a lower desirable response. Social factors are also
strong.
342018 Recreational Boating Participation Research
Note: Figures in blue represent the desirable response for that behaviour. Base too low to look at results by vessel type.
Alcohol use
‘Drinkers’ is the term we have used for those who drink and / or allow the drinking of alcohol when
boating. Compared to last year, Social factors are primarily stronger, while Physical factors are
slightly stronger albeit still fairly mixed. While there has not been a great deal of change from 2017
for Motivational and Ability factors, Drinkers are still ultimately showing desirable behaviour in these
two categories.
Note: Figures in blue represent the desirable response for that behaviour. Base too low to look at results by vessel type.
352018 Recreational Boating Participation Research
Lifejacket behaviour
‘Non-Lifejacket-Wearers’ is the term we have used for those who do not always ensure that they
wear a lifejacket when they go out on the water. Motivational and Social factors are primarily
stronger for Non-Lifejacket Wearers than they were in 2017. Although there has not been much
change for Ability and Physical factors, Non-Lifejacket Wearers are still showing desirable behaviour
in in the Ability category but a lower desirable response in relation to Physical factors.
Note: Figures in blue represent the desirable response for that behaviour. ~Base too low to look at results by vessel type.
362018 Recreational Boating Participation Research
Safety Messages Awareness
Safety messages awareness of the recreational boating campaign continues to be relatively strong at
the overall level but has experienced a slight decrease. When prompted with pictures or a
description of the activity, 55% of recreational boaties recalled having seen an aspect of the safety
messages or the safer boating ‘activities’ in the previous 12 months (vs. 58% in 2017).
Awareness of the safety messages in 2018 is again significantly higher amongst those aged 65 years
and over (63% vs. 55%) and highest amongst boaties in Marlborough (77%), Bay of Plenty (62%),
Gisborne (62%), and the Waikato region (61%)4. Safety messages are less likely to be recalled
amongst those aged 35-44 years (49%). Awareness of the safety messages or activities is also
significantly higher in 2018 amongst owners / users of power boats up to 6 metres (65%)*5, but
significantly lower amongst kayak owners / users (46%).
4
Note that the base is very low for Marlborough and Gisborne.
5
*Note that the national advertising campaign is targeted at male power boat users aged 30-55 years old.
372018 Recreational Boating Participation Research
In 2017 respondents were asked if they remembered the ‘Safer Boating’ campaign and a much larger
number of safer boating advertisements or activities than the current year. This also reflects the fact
that Maritime NZ has not done as much nationwide advertising during the past 12 months.
This year, boaties were again asked if they could recall the ‘Safer Boating’ campaign and three of the
same advertisements or activities as last year. Those living in Waikato, Marlborough, Canterbury,
Nelson, Tasman, Hawke’s Bay, Bay of Plenty, and Wellington were asked if they could recall the ‘No
Excuses’ campaign. Last year only those in Waikato, Marlborough, Canterbury, Otago, and Southland
were asked about this campaign. This particular campaign was run for five days by nine councils in
partnership with Maritime NZ to focus on taking action against those who break lifejacket and speed-
related rules and reinforce good on-water safety behaviours.
The ‘Old 4 New’ lifejacket swaps activity (19% in 2018 vs. 13% in 2017) and ‘No Excuses’ campaign
(18% in 2018 vs. 2% in 2017) were recalled by significantly more boaties in 2018 compared to the
previous year. The ‘Nobody’s Faster Than Disaster’ campaign on the other hand was remembered by
significantly fewer boaties this year (7% in 2018 vs. 13% in 2017).
382018 Recreational Boating Participation Research
Summary and Key Insights
This Executive Summary has presented the results of the 2018 Recreational Boating Survey which
was conducted amongst a nationally representative sample of 3,101 New Zealand adults aged 18+
years by Ipsos New Zealand on behalf of the Safer Boating Forum, led by Maritime NZ. This year,
‘booster’ samples were gathered in the Auckland, Waikato, Canterbury, and Wellington / Wairarapa
regions to reflect these areas’ status as the top-four boating regions in the country and to also
provide regional councils with an even more robust picture of recreational boating in these key
locations.
The 2018 research has found the following key insights regarding recreational boating activities
and safety-related attitudes and behaviours:
Although some significant improvements have been made by recreational boaties in some of
the four key risk factors identified and targeted by the Safer Boating Forum, there is still
room to further improve risk-related behaviour on the water.
Since 2017 to 2018 approximately one in five boaties report that they wear a lifejacket either
‘never’, ‘not very often’ or only ‘some of the time’. Given this is both a key risk factor and this
figure has not improved during the last two years is concerning.
Twenty-five percent of all boaties reported having five or more lifejackets on their vessels in
2017 and 2018.
In 2018, only 49% of adult passengers wore a lifejacket the entire time they were on the
water compared to 69% of child passengers, and this result was significant.
The 2018 results indicate that boaties are taking signalling more seriously and there is
improved uptake of the message that boaties should have at least two ways to call or signal
for help when they go out on the water. Importantly, there has been a significant increase in
the number of people having at least two ways to either call or signal for help if needed
‘every time’.
The issue of boaties not being aware whether their Personal Locator Beacons have been
registered continues to be an ongoing issue: the number reporting this lack of awareness
around registration has slightly increased from 2017.
Compared to 2017 it is also clear that significantly more boaties are checking either the
marine or mountains forecast before every boating trip, with the current study indicating a
significant increase in relation to this behaviour.
An equal number of boaties have maintained their weather checking ‘most of the time’ in
2017 and 2018 which indicates the act of checking the marine or mountains forecasts may be
becoming more “habitual” or normalised amongst a wider range of boat owners / users.
In 2018 significantly more boaties reported they are choosing to avoid alcohol before or
during their boating trips ‘every time’ compared to 2017.
Boaties were asked for the first time in 2018 why their use of vessels had become more / less
frequent or stayed about the same. More opportunities with friends or family, better
weather and more available time were reportedly the top-three factors influencing an
increase in trip frequency.
While awareness of the safety messages or activities in 2018 was again significantly higher
amongst those aged 65 years and over (63% vs. 55%), awareness was also significantly higher
this year amongst owners / users of power boats up to 6 metres (65%).
39You can also read