Corporate Presentation - September 2020 - Lundin Group of Companies
←
→
Page content transcription
If your browser does not render page correctly, please read the page content below
Corporate Presentation
September 2020
Disclaimer
All statements, other than statements of historical fact, made and information contained in this     The technical information contained in this presentation relating to the Fruta Del Norte
presentation and responses to questions constitute “forward-looking information” or “forward-        Project is based on a Technical Report prepared for the Company entitled “Fruta del Norte
looking statements” as those terms are defined under Canadian securities laws (“forward-             Project, Ecuador, NI 43-101 Technical Report on Feasibility Study” dated June 15, 2016 with
looking statements”). Forward-looking statements may be identified by terminology such               an effective date of April 30, 2016 (the "Technical Report"). Information of a scientific and
“believes”, “anticipates”, “expects”, “is expected”, “scheduled”, “estimates”, “pending”,            technical nature in this presentation was reviewed and approved by Ron Hochstein, P.Eng.,
“intends”, “plans”, “forecasts”, “targets”, or “hopes”, or variations of such words and phrases or   Lundin Gold’s President and Chief Executive Officer, and Stephen Leary, MAusIMM CP(Geo),
statements that certain actions, events or results “may”, “could”, “would”, “will”, “should”         an independent consultant to Lundin Gold, both of whom are Qualified Persons within the
“might”, “will be taken”, or “occur” and similar expressions).                                       meaning of National Instrument 43-101 - Standards of Disclosure for Mineral Projects (“NI
                                                                                                     43-101”).
By their nature, forward-looking statements involve assumptions, inherent risks and
uncertainties, many of which are difficult to predict, and are usually beyond the control of         Unless otherwise indicated, all dollar values herein are in US dollars.
management, that could cause actual results to be materially different from those expressed
by these forward-looking. Lundin Gold believes that the expectations reflected in these              Important Information for US Investors
forward-looking statements are reasonable as of the date made, but no assurance can be               This presentation may use the terms “measured", “indicated“, “inferred" and “historical”
given that these expectations will prove to be correct. In particular, this presentation             mineral resources. U.S. investors are advised that, while such terms are recognized and
contains forward-looking statements pertaining to: the restart of operations, its plans to           required by Canadian regulations, the Securities and Exchange Commission does not
ramp up mill and mining operations, efforts to protect its workforce from COVID-19, its 2020         recognize them. “Inferred mineral resources" and “historical estimates” have a great
production outlook, including estimates of gold production, grades and recoveries and its            amount of uncertainty as to their existence and great uncertainty as to their economic
expectations regarding all-in-sustaining costs, the expected timing of completion of the             feasibility. It cannot be assumed that all or any part of an inferred mineral resource or a
south ventilation raise and other capital projects, estimates of mineral reserves and                historical estimate will ever be upgraded to a higher category. Under Canadian rules,
resources and exploration plans and potential, the feasibility of increasing mine and mill           estimates of inferred mineral resources may not form the basis of feasibility or other
throughput and timing of implementation, the effectiveness of the Company’s sustainability           economic studies. Further, historical estimates are not recognized under Canada’s NI 43-
efforts and benefits to be derived under agreements with the government.                             101. U.S. investors are cautioned not to assume that all or any part of measured or indicated
                                                                                                     mineral resources will ever be converted to mineral reserves.
There can be no assurance that such statements will prove to be accurate, as Lundin Gold's
actual results and future events could differ materially from those anticipated as a result of       This presentation is not an offer of securities for sale in the United States or in any other
the factors discussed in the "Risk Factors" section Lundin Gold’s Annual Information Form            jurisdiction. The Company’s securities have not been and will not be registered under the
dated March 24, 2020 and its short form prospectus dated June 8, 2020, which are available           United States Securities Act of 1933, as amended, and may not be offered or sold within the
on SEDAR at www.sedar.com. Forward-looking information should not be unduly relied                   United States absent registration or an application exemption from registration.
upon.

                                                                                                                                                                                      2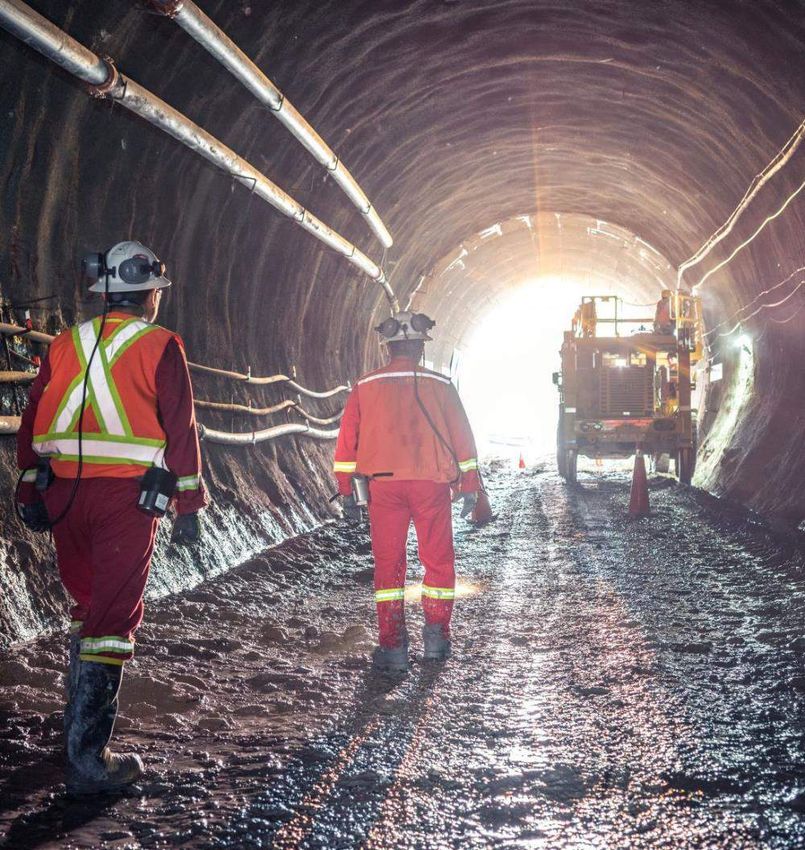
Building a Leading Gold Company
Through responsible mining

                                                       Mill currently running at
        Mine ramp up on schedule
                                                       design throughput

        Expect to produce 200,000 –                    Working under strict COVID-
        220,000 oz gold in 2020                        19 protocols

                               Exploration to begin on high
                               priority target within
                               extensive land package

                                                                              3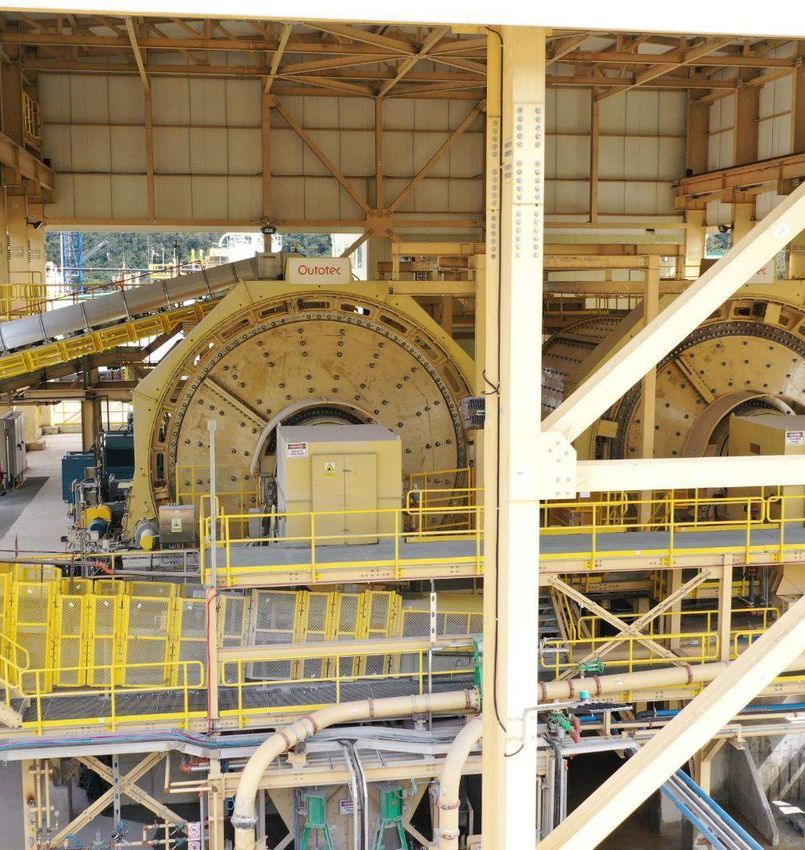
First Half 2020 Highlights
 February 2020: declared commercial production
       ahead of schedule and on budget

     March 22, 2020: Operations suspended
         temporarily due to COVID-19
            (re-started July 5, 2020)

 51,320 oz of gold produced prior to suspension
                  of operations

   66,114 oz of gold sold (30,906 oz sold after
            commercial production)

                                          4
Second Half 2020 Outlook
Full year gold production estimated to be 200,000 – 220,000 ounces

                                                        Average mill production
         Gold production
                                                        3,200 tpd, including re-start
         150,000 – 170,000 oz gold
                                                        ramp up period

         Average head grade                             Average gold recovery
         10 g/t gold                                    85%

                                 AISC per oz sold
                                 $770 – $850

                                                                                5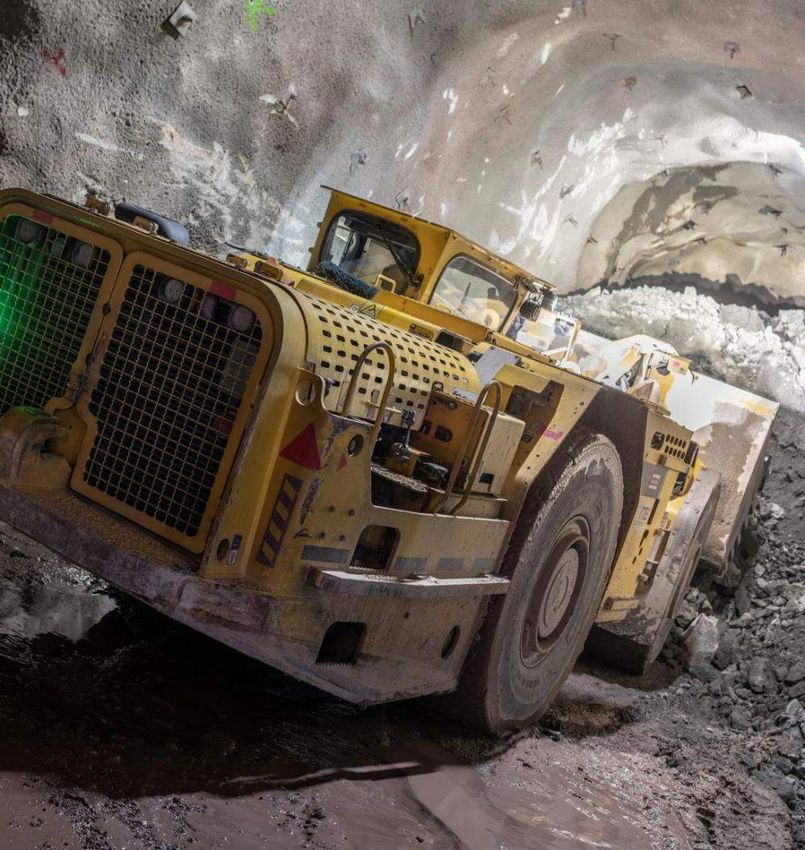
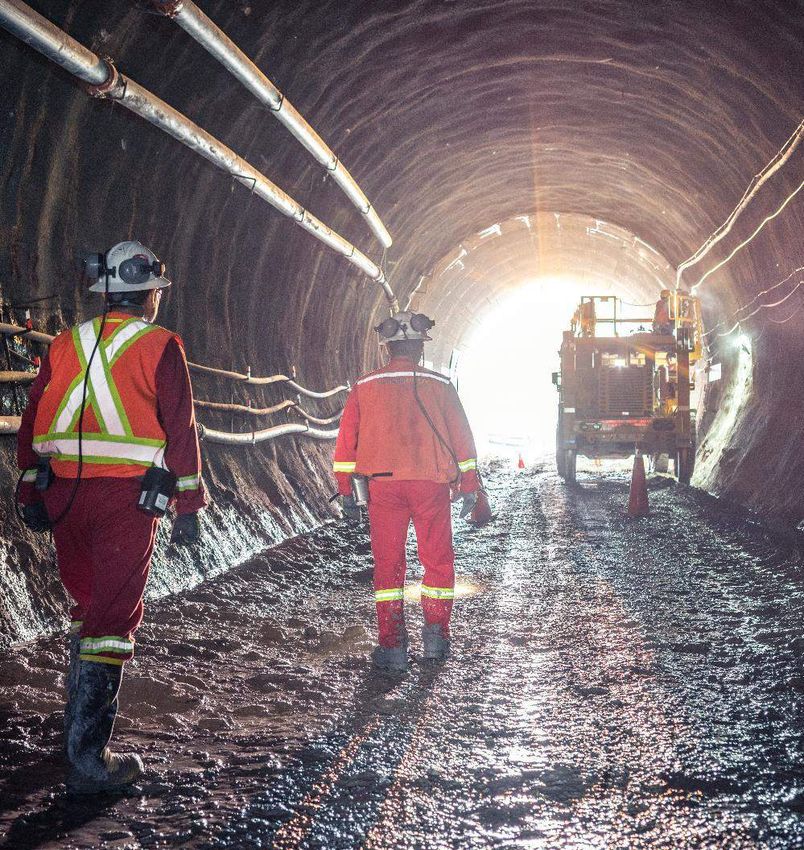
Current Mine Development
• 16.7 km of underground mine development completed
• South ventilation raise expected to be completed in Q4 2020 – will not impact
  planned 2020 production

                                                                                  6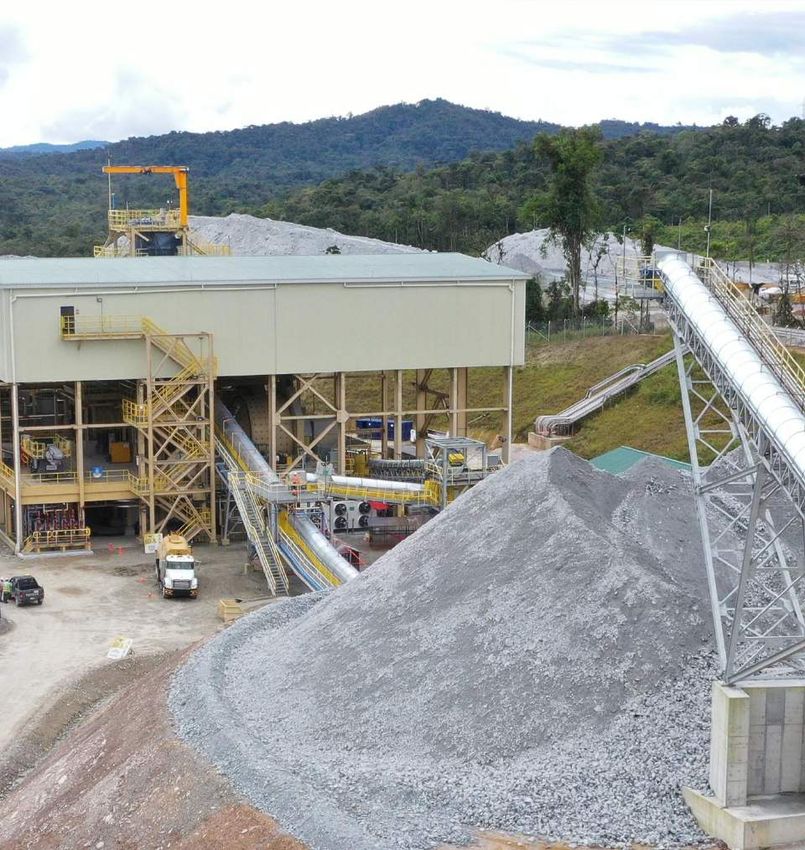
Low Life of Mine All-in Sustaining Costs1
                                  H2 2020 AISC $770 – $850 per ounce gold sold
                                                                                                                                                                                               H2 2020 Cash Costs
                                  2,000                                                                   Gold Price ~$1,955/oz2                                                                (US$ per oz Au sold)3

                                  1,800                                                                                                                                           On site operating costs           $585 - $625
                                  1,600
                                                                                                                                                                                  Treatment & refining                  $50 - $70
All In Sustaining Cost (US$/0z)

                                  1,400

                                  1,200
                                                                                                                                                                                  Royalties & production taxes          $90 - $100
                                  1,000

                                   800                                                                                                                                            Silver by-product                     ($10 - 15)
                                   600
                                                                                                                                                                                  Cash Costs                        $715 - $780
                                   400        Life of Mine Average = $621 per oz Au
                                   200                                                                                                                                            Sustaining Capital & Closure          $55 - $70
                                     0
                                          0                25                               50                             75                              100
                                                                                                                                                                                  H2 2020 All-In Sustaining costs   $770 - $850
                                                                Percentage (%) of Global Production

                                              1. SNL Metals and Mining, public company filings   2. Spot gold as at September 14, 2020   3. See Lundin Gold news release dated July 5, 2020                                7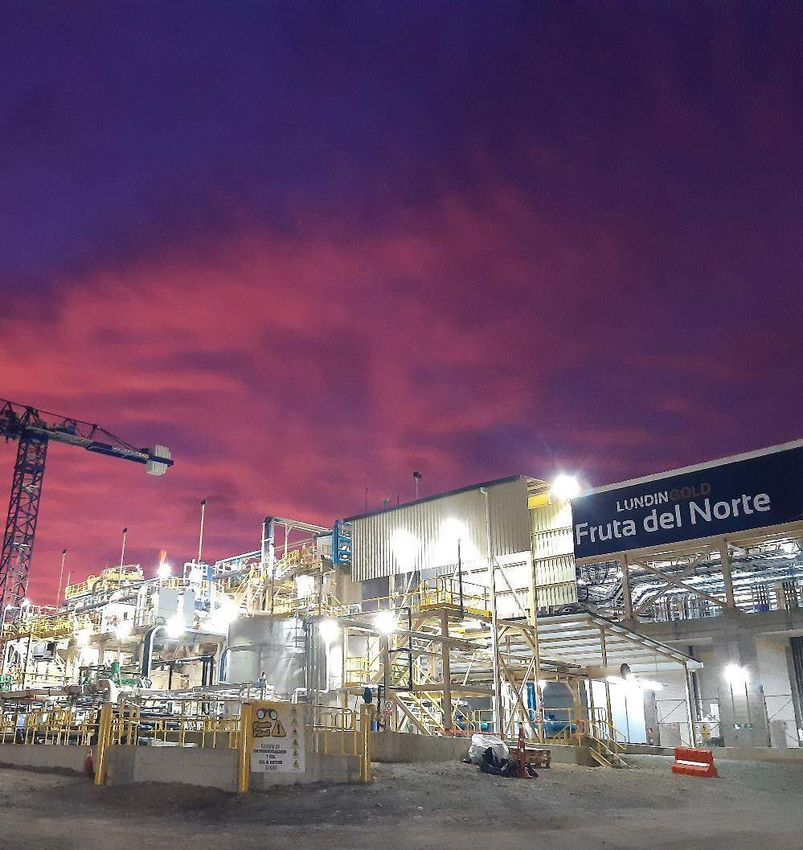
Potential of Increasing Mine and
Mill Throughput

• Studying the feasibility of increased production
  from the current capacity of 3,500 tonnes of
  ore per day to 4,000 – 4,500 tonnes per day

• Evaluating potential for increase in throughput
  as early as in 2021

                                                     8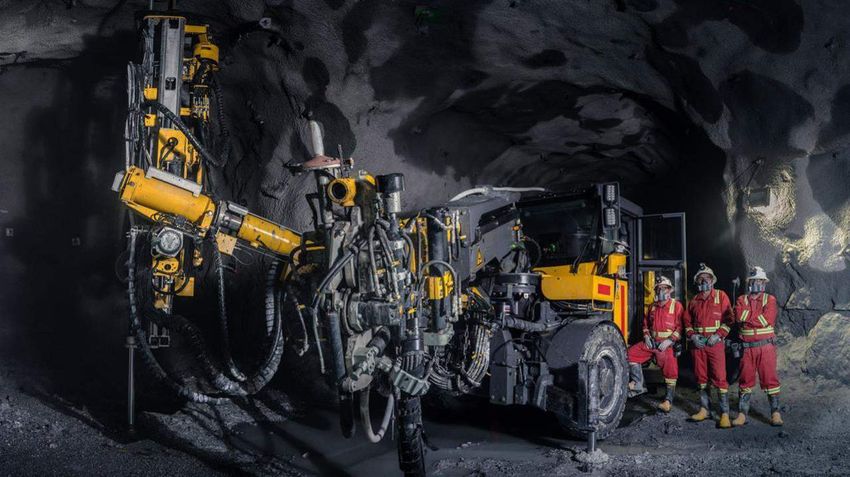
Planning Fruta del Norte Resource Expansion Drilling Program
 • Drill targets include targets at depth and southern extension of the existing mineral resource model
 • Anticipated to start later this year

Fruta del Norte deposit not                                                        Probable Reserves
 fully defined to the south                                                         represent 67% of
     (Inferred Resource)                                                          Indicated Resources     North

                             South

                                                                                                                      Height 300 m
Grade of Ore Blocks
 3-5 – 5.0 g/t Au
 5.0 – 10.0 g/t Au
 > 10.0 g/t Au

                      1.   See Annual Information Form dated March 24, 2020.                                      9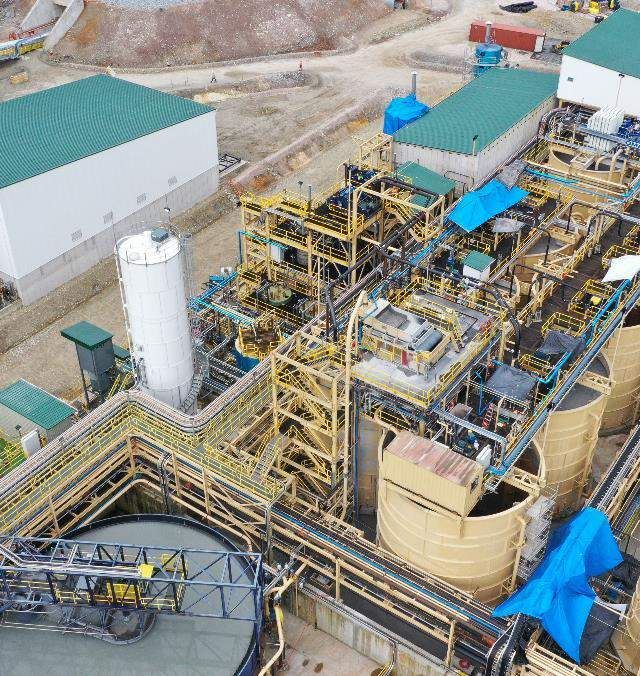
Fruta del Norte one of the Few Multi-Million Ounce, High-Grade Gold
                              Assets in Production1
                              FDN has probable mineral reserves of 5 million ounces at 8.74 g/t Au
                         12

                         10
                                                                                                                                                                                                   Producers with gold reserves
                                                  Mponeng                                                                                                                                               > 4 million ounces
                                                       Fruta del Norte
Reserve Au Grade (g/t)

                          8                         Brucejack

                                                            Kyzyl
                          6                       Meliadine
                                                    Tshepong      Tanami
                                        South Deep       Kloof Consolidated
                                                                         Porgera
                                              Kittila                           Loulo
                          4                                                                Kibali

                                                                            Ahafo                   Pueblo Viejo                    Olimpiada
                                                           Fekola                                                                                                                                                                          Muruntau
                                                 Tasiast                                        Lihir
                          2         Verninskoye               Natalka          Blagodatnoye          Canadian Malartic
                                                                        Merian            Tarkwa                                                                                                                                                  Nevada Operations
                                   Los Filos     Kuranakh            Sukari                  Kalgoorlie
                                                  Gross                                    Detour Lake
                                                    Cowal             Veladero
                                  Kisladag   Penasquito Herradura                            Boddington
                                  Free State Vaal River Surface Yanacocha      Paracatu    Cadia East
                          0
                              0                                 500                                 1,000                             1,500                               2,000                               2,500                             3,000                 3,500
                                   Annual Gold Production (‘000)

                                                           1.   Source: S&P Global Market Intelligence Metals and Mining, company reports, Fruta del Norte Technical Report and the Lundin Gold Annual Information Form dated March 24, 2020.                    10
Exploration at High Priority Barbasco
Target Fruta del Norte
Similar structural location and orientation
within the Basin to Fruta del Norte
• Received permit and 6,000 m drill program planned for mid
to late Q4 2020
Suarez Pull Apart
• Surface indications comparable to Fruta del Norte include: Basin - 16 km
strike length
• Soil and rock samples anomalous in the epithermal pathfinder
elements As and Sb Barbasco
• Illite and marcasite alteration
• Southern third of the anomaly is under cover and defined
by a strong ZTEM (airborne resistivity) anomaly
• Small scale epithermal gold-silver stockwork veins in the
area have assayed up to 10.4 g/t Au
11Remaining CAPEX Projects
• South Ventilation Raise
• Expected to be completed in Q4 2020
• Paste Plant Commissioning
• Expected to be completed by end of Q3 2020
• Zamora River Bridge
• Construction expected to resume in Q4 2020
• Anticipated to be completed in Q2 2021
12Strict COVID-19 Protocols
Implemented
• All personnel entering site must go through a
quarantine period followed by PCR test
• Employees are working from home to reduce
personnel on site
• Rotations extended to minimize travel and
logistics
• Additional transportation and on-site protocols
include:
• Physical distancing
• Mandatory PPE including wearing masks onsite
• Frequent disinfection of equipment and facilities
13Supporting Local Governments and
Communities during COVID-19
• Purchasing disinfection equipment for
local police, army and governments
• Providing essential equipment to front-
line medical and other government
support workers
• Supporting the Neighbourhood Doctor
program
• Supplying transportation for medical
professionals, allowing them to access families in
rural areas
• Supporting food donation programs in
local communities
14Strong Shareholder Base
Shareholders
• Newcrest Mining Ltd • Merian Global Investors
• Lundin Family Trust • Fidelity Investments UK
• Orion Mine Finance • Wells Capital Management
• CD Capital • Pictet Asset Management
• Fidelity Management • Blackrock Fund Advisors
• Van Eck Associates • Connor Clark & Lunn
• Invesco • CM-CIC Asset Management
TSX and Nasdaq Stockholm LUG
Share Price1 C$11.89
Shares Outstanding2 230.0 M
Market capitalization1 C$2,735 M
52 week high/low1 C$13.49/C$5.82
Cash position3 $74.2 M
1. As at September 14, 2020 2. As at August 31, 2020 3. As at June 30 , 2020 15Building a Leading Gold Company
Through responsible mining
Mill currently running at
Mine ramp up on schedule
design throughput
Expect to produce 200,000 – Working under strict COVID-
220,000 oz gold in 2020 19 protocols
Exploration to begin on high
priority target within
extensive land package
16Analyst Coverage
Firm Analyst Rating and Target Price (C$)
BMO Capital Markets Brian Quast Buy, $14.50
CIBC World Markets Bryce Adams Buy, $15.00
Cormark Securities Nicolas Dion Hold, $13.50
Echelon Wealth Partners Ryan Walker Buy, $12.75
VIII Capital David Talbot Buy, $14.75
Haywood Securities Kerry Smith Buy, $14.50
Kepler Cheuvreux Ola Sodermark Hold, $12.091 (SEK 80)
National Bank John Sclodnick Buy, $14.75
Nordea Equity Research Christian Kopfer Hold, target price on hold
Paradigm Capital Don MacLean Under Review
Pareto Securities Johan Spetz In Transition
Scotia Capital Inc. Trevor Turnbull Buy, $14.00
Stifel GMP Ian Parkinson Buy, $14.50
Sparebank1 Vidar Lyngvær Buy, $15.11 (SEK 100)
TD Securities Arun Lamda Buy, $17.00
1. Kepler Cheurvreux and Sparebank1 price target converted from SEK to CAD (SEK 6.61619 = CAD 1) @ August 31, 2020
2. Lundin Gold is followed by the analysts listed above. Note that any opinion, estimates or forecasts regarding the Company made by these analysts are the analysts’ opinions and do not represent opinions, estimates or forecasts 17
of the Company or its management. Lundin Gold does not imply endorsement by the analyst coverage referenced above.Appendix
Commercial Production Highlights

   $50 million in recognized revenues

       30,906 ounces of gold sold

       $952 AISC per oz gold sold

    $1,680 average realized gold price
                 per oz

                                    19
Work Carried Out During
Suspension
• Mine
• Continued development activities and stope drilling to
provide inventory for start-up
• Maintenance of mine infrastructure (roads, power,
ventilation and dewatering system)
• Recovery of South Ventilation Raise
• Mill
• Relining of SAG mill
• To increase recovery repiping to send more material to
gravity circuit and optimize flotation reagent additions
• Crushing plant maintenance and wear part replacements
• CIL Plant maintenance program
• Operation and Maintenance of Water
Management Systems
202020 LOMP Annual Projected Gold Production
500 12.00
10.00
400
Au Grade (g/t)
8.00
300
Kozs/year
6.00
200
4.00
100
2.00
0 0.00
2021 2022 2023 2024 2025 2026 2027 2028 2029 2030 2031 2032 2033
Koz/year Au Grade
21Process Plant Flowsheet
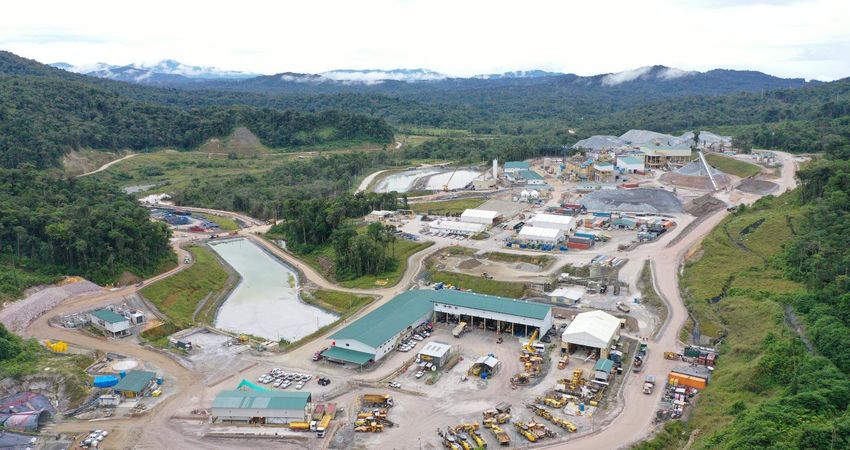
22Fruta del Norte
Exploration Upside Exists
Within extensive land package
• Fruta del Norte is within a major under explored
mineralized trend
• Only 18 holes outside of Fruta del Norte have been drilled
in the 38km2 Suarez pull-apart basin
• Priority is to systematically explore for Fruta del Norte Puente- Barbasco
epithermal Au-Ag type systems Princesa
• High priority, ‘drill ready’ targets are:
• Barbasco
Gata
• Puente-Princesa Salvaje
• Gata Salvaje
23Non-Executive Board of Directors
Lukas Lundin – Chairman
• 37 years of recognizing value and superior global investment opportunities in the natural resource sector
• Pursuit of highly prospective properties around the world has resulted in numerous resource discoveries, including the multi million-ounce Veladero gold discovery
• Has led several companies through highly profitable business acquisitions and mergers such as Lundin Mining Corporation's $3.3 billion merger with EuroZinc Mining
Carmel Daniele Ian Gibbs
• Founder and CIO of CD Capital Management Group Ltd., the fund manager of a • Canadian chartered accountant who has held a variety of prominent positions with Lundin
number of private equity and mining funds Group of Companies, currently serving as CFO of Josemaria Resources Inc.
• 25 years of natural resources investment experience, 10 years of which were spent
with Newmont Mining/Normandy
Chantal Gosselin Ashley Heppenstall
• 25 years of combined experience in the mining industry and capital markets • Lead Director of Lundin Gold since 2015
• Has held positions as VP and PM at Goodman Investment Counsel and Senior Mining • Has worked with Lundin Group public companies since 1993, most recently as the
Analyst at Sun Valley Gold LLP, as well as various mine-site management positions in President, CEO and Finance Director of Lundin Petroleum AB (now Lundin Energy AB)
Canada, Peru and Nicaragua
Craig Jones Paul McRae
• Chief Operating Officer (Papua New Guinea), Newcrest Mining • Global reputation in project and construction management in the mining industry for both
• Joined Newcrest in 2008 and has held various senior management and executive surface and underground projects of all scales and complexities, and was most recently
roles, including General Manager Projects, General Manager Cadia and a number of responsible for the successful development of Lundin Mining’s Eagle Mine in Northern
Executive General Manager roles within Newcrest Michigan
Bob Thiele Istvan Zollei
• General Manager - Technical Services and Business Improvement, Newcrest Mining • Portfolio Manager at Orion Mine Finance, a mining-focused investment business providing
• Prior to joining Newcrest in 2017, served for five years as Operations Manager - flexible capital investment solutions to mining companies in the base and precious metals
Mining at Calibre Global, and before that worked as General Manager, Business sector
Improvement at Barrick Gold Corporation • Has international finance experience and been responsible for investments in mining,
• Has over 35 years of operational and corporate project and mining experience oil/gas and power companies
24Management Team with Extensive Mining Experience
Ron F. Hochstein - President, CEO & Director
• 35 years in the mining industry, including more than 20 year working with the Lundin Group
• Worked with a number of resource companies, most recently as President and CEO of Denison Mines Corp. from 2009 to 2015
Alessandro Bitelli - EVP, CFO
• 35 years experience in the resource industry and in public accounting, both in Europe and North America
• Former CFO of Redback Mining, which was acquired by Kinross in 2010 for $9.2 billion
David Dicaire - VP, Projects and General Manager
• 40 years in the mining, engineering and construction industry, leading both Owners and EPCM teams on a variety of global
projects
• Project Director for Freeport McMoRan’s US$4.6 billion Cerro Verde Expansion Project in Peru, and previously worked on Agua
Rica Mine in Argentina (Glencore, prev. Xstrata) and Quellaveco Mine in Peru (Anglo American)
Nathan Monash - VP, Business Sustainability
• 15 years experience in resource business sustainability
• Worked extensively with the IFC, guiding extractive industry clients on the structure and implementation of sustainable
development strategies
25Operations Team with Global
Mining Experience
Doug Moore Juan Carlos Contreras
Mine Manager Mill Manager
• Carlin East Mine, USA • El Peñón Mine, Chile
(Newmont) (Yamana)
• Buckhorn Mine, USA • Can Mine, Chile (COPEC S.A.)
(Kinross) • Tambo de Oro Mine, Chile
• Lac des Iles Mine, Canada (HMC Gold)
(North American Palladium)
Murray Wright
Supply Chain Manager
• Kansanshi Mine, Zambia (First
Quantum)
• Tasiast Mine, Mauritania
(Kinross)
• Otjikoto Mine, Namibia (B2
Gold)
26Newcrest Financing Package
• Orion Mine Finance and Blackstone Tactical Opportunities
provided the facilities in May 2017 and they were fully drawn
in January 2018
• Newcrest purchased facilities in April 2020
• Stream credit facility of US$150 million
• Cash equivalent of 7.75% of Au ounces and 100% of Ag ounces
based on spot at time of payment less US$400/ounce Au and
US$4.00/ounce Ag, capped at 350,000 ounces Au and 6.0 million
ounces Ag
• Payments commenced upon achievement of Commercial
Production in February 2020
• Option to buy back 50% of the stream in June 2024 and 50% in
June 2026
• Gold pre-pay term credit facility of US$150 million
• Principal and interest paid over 19 quarters equivalent to 11,500
Au ounces based on spot at time of payment starting December
2020 and ending 2025
• Offtake agreement for up to 2.5 million ounces refined gold
27Senior Debt Facility
• $350 million from lenders syndicate
• 7 lenders and 1 export credit agency
• Tranche A: $250 million senior commercial facility
• Tranche B: $100 million senior covered facility under a raw
material guarantee provided export credit agency
• Fully drawn at end of 2019
• No mandatory gold hedging
• Annual interest rate is the three or six-month LIBOR plus an
average margin of approximately 5.05% for Tranche A and
2.50% for Tranche B
• Repayable in variable quarterly instalments starting at the
end of 2020 and maturing in June 2026
28Government Agreements
The Company has all the major agreements and permits with the Government of
Ecuador
Both the Exploitation Agreement and the Investment Protection Agreement were signed in December 2016
• The Exploitation Agreement sets out the rights and obligations of the • The Investment Protection Agreement primarily deals with tax and mining
Government of Ecuador and Aurelian as mining concessionaire with respect to regulatory stabilisation and other investment protection mechanisms. Key
the Project and incorporates: benefits include:
• Term – affords the mining concessionaire the right to develop and produce • Income tax rate fixed at 22%
gold from the Project for 25 years • Exemption from the capital outflow tax of 5% on payments of principal and
• Fiscal Terms – describing royalties, windfall tax and sovereign adjustment interest to financial institutions outside of Ecuador
mechanisms • The ability to obtain benefits granted by the Government of Ecuador through
• Security – acknowledges the financing requirements and provides the ability future investment protection agreements with other investors in similar
and authorisation to grant security projects in Ecuador
• Enforcement – provides acknowledgement that the Lenders are entitled to • No restrictions to transfer or assign all or part of the investment, including the
foreclose without authorisation from the mining concessionaire or the right to assign its rights to any financing parties
Government of Ecuador • Other benefits granted to Aurelian include no restriction to:
• Dispute Resolution Procedures – arbitration under UNICTRAL rules (in • produce and sell minerals;
Santiago, Chile)
• import and export goods; and
• establish, maintain, control, or transfer funds abroad, provided
statutory remittances and obligations have been met
29Cash Cost and All-In Sustaining Cost1
Cash Cost All In Sustaining Costs
March 1 – June 30, March 1 – June 30,
2020 2020
Cash operating cost $27,060
Operating Expenses $24,224
Corporate social responsibility $422
Royalty Expenses $2,836 Treatment and refining charges $2,350
Accretion of restoration provision $20
Cash Operating Costs $27,060
Sustaining capital -
Gold oz sold recognized in
30,906 Less: silver revenues ($417)
statement of income (loss)
Total all-in sustaining cost $29,435
Cash operating cost per oz sold $876
Gold oz sold 30,906
All-in sustaining cost per oz sold $952
1. Refer to “Non-IFRS Measures” in the Company’s MD&A for the second quarter of 2020. 30Income Statement for the Six Months Ended June 30, 2020
Revenues $50,002 Other expenses (income)
Corporate administration $12,923
Cost of goods sold
Exploration $1,681
Operating Expenses $24,224 Suspension of operations $29,304
Royalty Expenses $2,836 Finance expense (income) $17,748
Other expense (income) ($1,474)
Depletion and amortization $8,164
Derivative loss $28,301
$35,224
$88,483
Income from mining operations $14,778 Net loss for the period ($73,705)
31Suspension of Operations Costs
Six months ended
June 30, 2020
Salaries and benefits $13,003
Maintenance $4,364
Fixed administrative costs $4,062
Site services $2,197
COVID-19 expenditures $1,455
Other costs $1,734
Depreciation and amortization $2,489
$29,304
32Mineral Resources
NI 43-101 Mineral Resources - Mineral Resources, inclusive of Mineral Reserves as at December 15, 2015
Tonnage Grade Contained Metal Grade Tonnage
Category
(M t) (g/t Au) (M oz Au) (g/t Ag) (M oz Ag)
Indicated 23.8 9.61 7.35 12.9 9.89
Inferred 11.6 5.69 2.13 10.8 4.05
Notes:
1. The Qualified Person for the estimate is Mr. David Ross, P.Geo., an employee of RPA. The estimate has an effective date of 31 December, 2015.
2. Mineral Resources are reported inclusive of Mineral Reserves; Mineral Resources that are not Mineral Reserves do not have demonstrated economic viability.
3. Mineral Resources are reported at a cut-off grade of 3.5 g/t Au; which was calculated using a long term gold price of US$1,500/oz.
4. Mineral Resources are constrained within underground mineable shapes that assume a minimum thickness of 2 m; metallurgical recovery of 94%; total operating costs of US$145/t milled (mining cost of US$60/t milled; process
costs of US$35/t milled; G&A costs of US$15/t milled; surface infrastructure costs of US$28/t milled; concentrate transport and treatment costs of US$7/t milled); royalties of US$71/oz and selling costs of US$65/oz.
5. Numbers may not add due to rounding.
6. For information with respect to the key assumptions, parameters and risks associated with the results of the Technical Report for the Project, the Mineral Resource and Mineral Reserve estimates included therein and other
technical information, please refer to the Technical Report.
33Mineral Reserves
Reconciliation of Probable Mineral Reserves1 as at December 31, 2019
Technical Report UPE(2)(3)(4)(5)(6)(7)(8) Processed in 2019(9) December 31, 2019
Mt 15.5 17.8 0.2 17.6
Au (g/t) 9.67 8.74 7.53 8.74
Au (Moz) 4.82 5.02 0.03 4.99
Ag (g/t) 12.7 12.1 7.5 12.1
Ag (Moz) 6.34 6.95 0.03 6.92
1. Except as set out below, the assumptions, parameters and risks associated with the results of the Technical Report for 5. Gold cut-off grades for the different mining methods are listed in the table below:
the Project and the Mineral Resource and Mineral Reserve estimates included therein and the UPE are as set out in the
Gold Cut-off Grade UPE Unit
Technical Report.
2. All Mineral Reserves in this table are Probable Mineral Reserves. No Proven Mineral Reserves were estimated. Transverse Stope 3.8 g/t
3. UPE estimates are as at September 19, 2018. Overhand D&F 5.0 g/t
4. Mineral Reserves were estimated using key inputs listed in the table below: Underhand D&F 5.0 g/t
Key Inputs for Mineral Reserve Estimate UPE Unit
Gold Price 1,250 $/oz 6. The average silver metallurgical recovery is 81.6%. The silver price assumption was $20/oz. Silver was not considered
in the calculation of the cut-off grades.
Transverse Stope 48 $/t
7. Tonnages are rounded to the nearest 1,000 t, gold grades are rounded to two decimal places, and silver grades are
Overhand D&F 81 $/t rounded to one decimal place. Tonnage and grade measurements are in metric units; contained gold and silver are
Underhand D&F 71 $/t reported as thousands of troy ounces.
Process, Surface Ops, G&A 58 $/t 8. Rounding as required by reporting guidelines may result in summation differences.
9. Corresponds to mill feed.
Dilution Factor 10 percent
Concentrate Transport & Treatment 9 $/t
Royalty 71 $/oz
Gold Metallurgical Recovery 91.7 percent
34Contact information:
Sabina Srubiski
Manager, Investor Relations
info@lundingold.com
@LundinGold / LundinGoldEC
+1 604-689-7842
Lundin Gold www.lundingold.com
Lundin Gold
Lundin Gold EcuadorYou can also read