SUKARI GOLD MINE Investor Site Visit September 2018 - Centamin
←
→
Page content transcription
If your browser does not render page correctly, please read the page content below
SUKARI GOLD MINE Investor Site Visit September 2018
DISCLOSURES
Forward Looking Statements

Forward Looking Statements: There are risks associated with an investment in the shares of       expressed or implied by the forward-looking statements. Such factors include, among others,
Centamin plc (“Centamin” or “the Company”). Recipients of this presentation should review        future price of gold; general business, economic, competitive, political and social
the risk factors and other disclosures regarding Centamin referred to in the section entitled    uncertainties; the actual results of current exploration and development activities;
“Principal risks affecting the Centamin Group” in (i) our most recent Annual Information         conclusions of economic evaluations and studies; fluctuations in the value of the US dollar
Form; and (ii) our Management Discussion & Analysis reports, in each case available at           relative to the local currencies in the jurisdictions of the Company’s key projects; changes in
www.sedar.com.                                                                                   project parameters as plans continue to be refined; possible variations of ore grade or
                                                                                                 projected recovery rates; accidents, labour disputes or slow-downs and other risks of the
This presentation contains "forward-looking statements" (which include “forward-looking          mining industry; climatic conditions; political instability, insurrection or war; civil unrest or
information” within the meaning of Canadian securities legislation) which may include, but       armed assault; labour force availability and turnover; delays in obtaining financing or
are not limited to, statements with respect to the future financial or operating performance     governmental approvals or in the completion of exploration and development activities. The
of the Company, its subsidiaries, affiliated companies, its projects (including the Sukari       reader is also cautioned that the foregoing list of factors is not exhaustive.
mine), the future price of gold, the estimation of mineral reserves and resources, the
realisation of mineral reserve and resource estimates, the timing and amount of estimated        Although the Company has attempted to identify important factors that could cause actual
future production, revenues, margins, costs of production, estimates of initial capital,         actions, events or results to differ materially from those described in forward-looking
sustaining capital, operating and exploration expenditures, costs and timing of the              statements, there may be other factors that cause actions, events or results to differ from
development of new deposits, costs and timing of future exploration, requirements for            those anticipated, estimated or intended. Forward-looking statements contained herein are
additional capital, foreign exchange risks, governmental regulation of mining and exploration    made as of the date of this presentation and, except as required by applicable law, the
operations, timing and receipt of approvals, consents and permits under applicable mineral       Company disclaims any obligation to update any forward-looking statements, whether as a
legislation, environmental risks, title disputes or claims, limitations of insurance coverage    result of new information, future events or results or otherwise, after the date on which the
and regulatory matters.                                                                          statements are made or to reflect the occurrence of unanticipated events. There can be no
                                                                                                 assurance that forward-looking statements will prove to be accurate, as actual results and
These forward-looking statements are provided for the purposes of assisting the reader in        future events could differ materially from those anticipated in such statements. Accordingly,
understanding the Company’s financial position and results of operations as at and for the       readers should not place undue reliance on forward-looking statements.
periods ended on certain dates, and to present information about management’s current
expectations and plans relating to the future. Readers are cautioned that forward-looking        Competent Persons: Information in this presentation which relates to exploration, geology,
statements may not be appropriate for other purposes than outlined in this presentation.         sampling and drilling is based on information compiled by geologist, Mr Norm Baillie, who,
Often, but not always, forward-looking statements can be identified by the use of words          as an accredited Chartered Professional Geologist and Manager through the Geological
such as "plans", "hopes", “aims”, “assumes, “seeks”, “targets”, “projects”, "expects", "is       Society of the United Kingdom and the Australasian Institute of Mining and Metallurgy, is an
expected", "budget", "scheduled", "estimates", "forecasts", "intends", "anticipates", or         “Competent Person” for this purpose and a “Qualified Person” as defined in “National
"believes" or variations (including negative variations) of such words and phrases, or may be    Instrument 43-101 of the Canadian Securities Administrators”.
identified by statements to the effect that certain actions, events or results "may", "could",
                                                                                                 Refer to the Company’s annual report for 2017, for further discussion of the extent to which
"would", “should”, "might" or "will" be taken, occur or be achieved.
                                                                                                 the estimate of mineral resources/reserves may be materially affected by any known
                                                                                                 environmental, permitting, legal, title, taxation, socio-political, or other relevant issues.
Forward-looking statements involve known and unknown risks, uncertainties and a variety of
material factors (many of which are beyond the Company’s control) which may cause the
actual results, performance or achievements of the Company, its subsidiaries and affiliated
companies to be materially different from any future results, performance or achievements

                                                                                                                                                                                                     2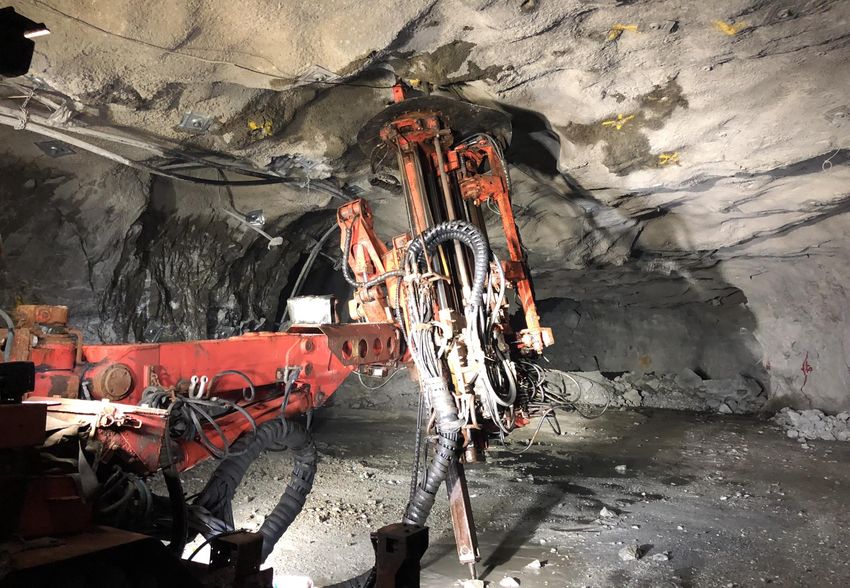
INTERIM RESULTS REVIEW
Solid financial performance

Operational performance
     •        Produced 217,099 ounces of gold at US$637/oz                                                                                                                                       %
                                                                                                                                                              2018         H1           H1
                                                                                                                                              units                                            change
              cash costs and US$930/oz AISC.                                                                                                               Guidance(1)    2018         2017
     •        Maintained full year revised guidance of                                                      Gold production                   koz           505-515       217          234      -7%
              505,000 – 515,000 ounces
                                                                                                            Cash costs of                    US$/oz
     •        Continued progress overcoming short-term                                                                                                      625-640       637          668      -5%
                                                                                                            production(2)                   produced
              operational challenges
                                                                                                            All-in sustaining cost(2)      US$/oz sold      875-890       930          857      9%

Solid financial performance
     •        Successfully minimised cost inflation across the
                                                                                                                                                                                                %
              Group, in spite of reduced production, increased
                                                                                                                                                  units         H1 2018      H1 2017          change
              sustaining capex and fuel cost pressure.
                                                                                                             Operating cash flow                 US$m             127            126           1%
     •        Generated positive cash flow of US$36.1m,
              throughout operationally challenging quarters                                                  Capex (inc Sukari expl)             US$m              51            31            67%
                                                                                                             Profit Share                        US$m              39            41            -5%
     •        Maintained strong and flexible balance sheet of
              US$303.3m cash and liquid assets, with no debt,                                                Free Cash Flow(1)                   US$m              36            51           -29%
              no hedging, no streaming                                                                       Dividend                           US cents           2.5           2.5            -
     •        Committed to shareholder returns with 2.5 US                                                   Cash and liquid assets(1,2)         US$m             303            334           -9%
              cent declared interim dividend, equivalent of
              returning 80% of FCF, while self funding our
              pipeline of potential development projects

1.       As per full year revised guidance published on 25 May 2018
                                                                                                                                                                                                     3
2.       Non-GAAP measures and are defined in the Financial Review of our Interim Results, announced 2 August 2018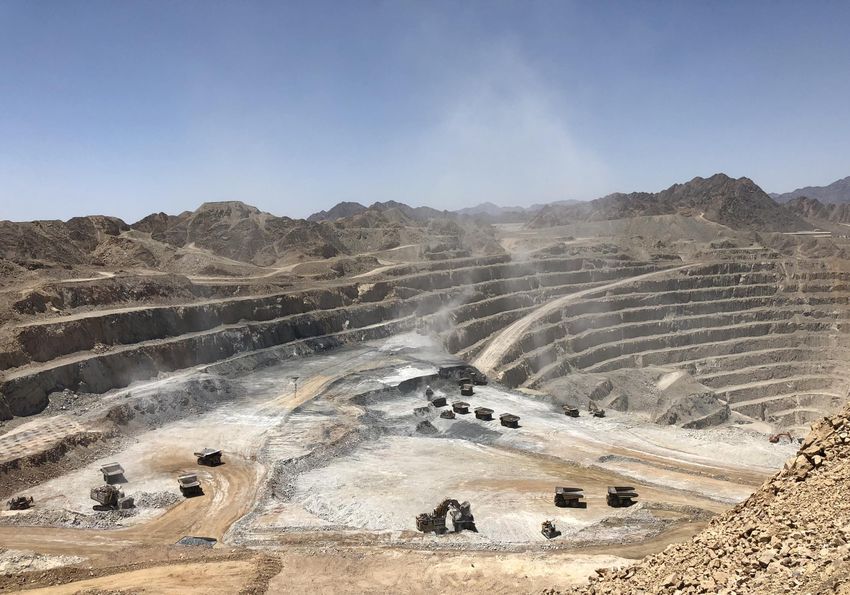
INTERIM RESULTS REVIEW
Continued operational progress

       Factors impacting performance                                                                    Cause                             Response

                                                                   • Transitional zone thicker than expected with      ✓ Enhanced grade control drilling
     Open pit grade
                                                                     lower than expected grades                        ✓ Personnel change

                                                                                                                       ✓ Repaired LHDR, restoring availability and
                                                                   • Long hole drill rig ("LHDR") damaged, causing       utilisation in line with mine plan
                                                                     disruptions and temporary suspension of stoping   ✓ Stope tonnes improved
     Underground stope tonnage
                                                                   • Increased cascade stoping leading to increased    ✓ High-grade stope sequence deferred 3
                                                                     dilution                                            months
                                                                                                                       ✓ A reserve LHDR ordered, expected in Q4

                                                                   • Increased development tonnages due to lower
     Underground development grade                                                                                     ‐ Personnel change
                                                                     stoping production

                                                                                                                       ‐ Reducing contribution from higher dilution
                                                                   • Greater than expected dilution from high-volume     mining methods
     Underground stope grade
                                                                     mining method (cascade stope mining)              ‐ Improved controls continue to be
                                                                                                                         implemented

1.    As per full year revised guidance published on 25 May 2018
                                                                                                                                                                      4
2.    Non-GAAP measures and are defined in the Financial Review of our Interim Results, announced 2 August 2018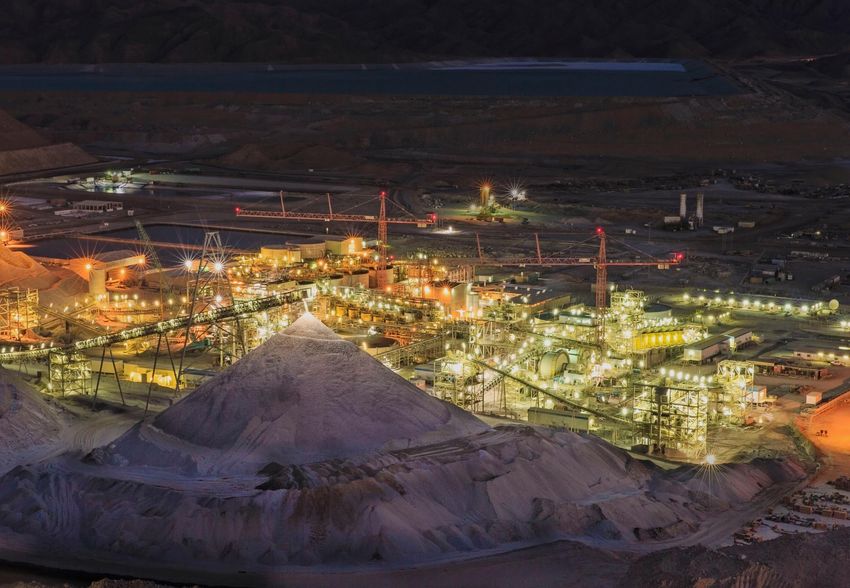
PRIORITISING SHAREHOLDER RETURNS
9.4% dividend yield (as at 30 Aug 2018)
BALANCED CASH FLOW DISTRIBUTION                                      SUSTAINABLE DIVIDEND STREAM

                    Operating Cash Flow                              ▪      US¢ 2.5 interim dividend for 2018, represents
                                                                            80% of Free Cash Flow

                                                                     ▪      c. US$420m returned to shareholders in 5 years
            SUSTAINING CAPEX & EXPLORATION
                                                               44%
                  Investment in future growth                        ▪      First use of Sukari cash flow is minimum
                                                                            dividend payment

                  PROFIT SHARE & ROYALTIES                           ▪      Further dividends in light of potential growth
                        Contribution to country                32%
                                                                            capital

                          FREE CASH FLOW                             DIVIDEND HISTORY
                         Cash flow generation                  24%
                                                                     16.0
                                                                     14.0
                                                                     12.0
                    SHAREHOLDER RETURNS                              10.0
                   Sustainable dividend stream
                                                                      8.0
                                                                      6.0

                           Dividend Policy                            4.0
                                                                      2.0
  Min dividend 30% of       Maintain min $250-    Growth capital
   Sukari cash flow         $300m cash balance     investment         0.0
                                                                               2014       2015           2016        2017    2018

         Excess Cash returned to shareholders as dividend                               Final Dividend    Interim Dividend
                                                                                                                                    5
LONG TERM SUSTAINABILITY
Growth opportunity through the drill-bit

 Group reserve and resource growth potential
 ▪ Sukari underground is open at depth with extensive reserve and resource drilling underway
 ▪     Doropo Project (1.35Moz Indicated) drilling targeting further resource expansion and maiden reserve
 ▪     ABC Project targeting maiden resource

                                             Group Resource and Reserves, as at 31 December 2017
25

20

15

10

5

0
        2003    2004     2005      2006  2007     2008     2009            2010    2011      2012  2013      2014     2015    2016     2017
           Reserve - Sukari Open Pit Reserve - Sukari Underground           Resource - Sukari Resource - Batie West    Resource - Doropo      6
All Resource estimates are published Measured and Indicated, ex Inferred
INVESTMENT CASE
Supported by strong fundamentals

               Asset Quality                                                   Financial Flexibility
               Large, world class asset : top 20 producing gold mine                                            No debt
               by ounces
                                                                                                             No hedging
               Low cost, bulk tonnage mine
                                                                                                           No streaming
               >20yrs LOM (vs gold sector avg ~10yrs*) with reserve
               and resource growth upside                                    Maintain min cash balance of US$250-300m
               Near term, near-mine / capex lite production growth     US$303m cash and liquid assets as at 30 Jun 2018
               upside
                                                         LON:CEY / TSE:CEE
                                                           100% free float
                                                                FTSE 250

               Stakeholder Returns                                     Active Growth Pipeline
               Meaningful contributor to our host country/partners         Sukari UG – Amun/Ptah reserve replacement
               Minimum dividend of 30% of Sukari cash flow             Sukari UG – Cleopatra exploration & development
               Current 9.4% dividend yield, as at 30 Aug 2018                      Doropo – infill and expansion drilling
               Maintain social license to operate                                  Batie West – scoping study underway
                                                                                     ABC – greenfield target generation
                                                                                                                            7
*Referenced RBC Capital Markets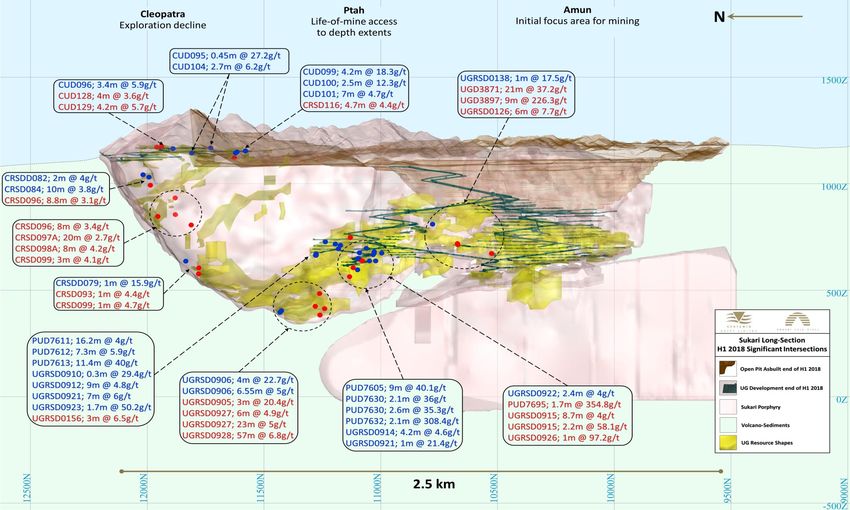
NEAR TERM DELIVERABLES
Catalysts

 ❑ Deliver solid H2 operational performance and subsequently deliver on revised guidance of
    505-515koz at AISC of US$875-$890/oz sold

 ❑ Return excess cash to shareholders
 ❑ Deliver Sukari solar project feasibility study

 ❑ Appointment of a non-executive Chairman

 ❑ Sukari underground updated reserve and resource statement

 ❑ Doropo Project PEA, update resource and maiden reserve

 ❑ ABC Project maiden resource

 ❑ Significant exploration target generation across the portfolio

 ❑ Continued downward trend in Group LTIFR
                                                                                              8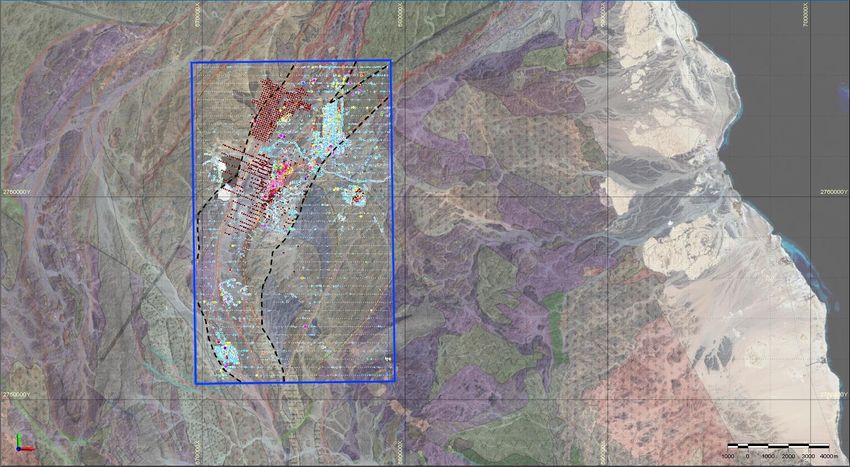
SUKARI GOLD MINE
                                                                            Youssef El-Raghy
                                                                      (Country General Manager)

                                                                              Raitt Marshall
                                                                        (Mine General Manager)

Esmat El-Raghy    Steve Fuhri    Chris Boreham     Mohamed         David Stribley          Ahmed Ali     Darren Swinson   Amr Houssouna
                                                                                                                                            Taha Lamada      Amr Aboelrazik
   (Security                     (Underground    Farghally (Open     (Process                             (Maintenance     (Commercial
                 (HSE Manager)                                                            (IT Manager)                                    (Admin Manager)   (Supply Manager)
  Manager)                         Manager)       Pit Manager)       Manager)                               Manager)         Manager)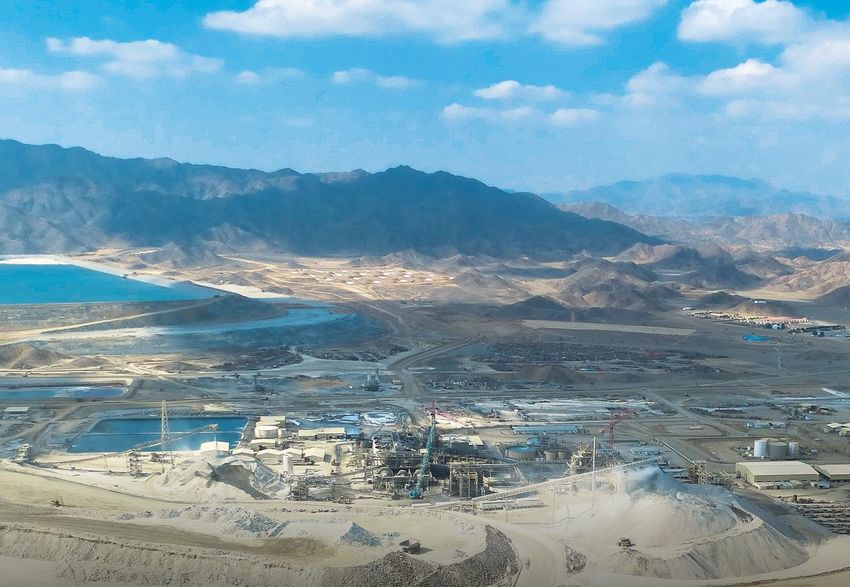
EGYPT OVERVIEW Excellent emerging market opportunities Arab Republic of Egypt ▪ Stable government: President el Sisi re-elected for 2nd term; Undergoing economic reform as part of the $ 12bn IMF loan Sukari Gold Mine ▪ Strengthening economy: 2018 GDP grew 5.3%, inflation halved to
MINE HISTORY
Strong operational track record in a new frontier, against a changing political environment

                    Commissioned                                 Commenced
                                                                                             Fuel subsidy             Plant expansion
                    Stage 1 4Mtpa                                underground
                                                                                              removed                    to 10Mtpa
                        plant                                      mining

600                                                                                                                                                                                                                                                              1,800
                                                                                                                                                                                                                                                      2018F
                                                                                                                                                                                                                                                    505-515koz
                                                                                                                                                                                                                                                                 1,600
500
                                                                                                                                                                                                                                                                 1,400

400                                                                                                                                                                                                                                                              1,200

                       Production                                                                                                                                                                                                                                1,000
300                    Cash Cost
                       Average realised gold price                                                                                                                                                                                                               800

                       All-in sustaining cash costs
200                                                                                                                                                                                                                                                              600

                                                                                                                                                                                                                                                                 400
100                                                                                                                                                                                                                                                1H18A
                                                                                                                                                                                                                                                   217koz        200

  0                                                                                                                                                                                                                                                              0
                 2009                      2010                       2011                      2012                      2013                      2014                      2015                      2016                      2017                 2018

                                                       ~US$1.2bn capital investment and full cost recovery                                                                                     Profit Share with local partners, EMRA1

                                  Mubarak                                       Army                     Morsi             Mansour                                                              Sisi                                                    Sisi
                                                                                                                                                                                                                                                                     11
      (1) For further details on the mechanics of the Concession Agreement please refer to the 2017 Annual Report and Accounts and the License Overview found on the Company website: http://www.centamin.com/production/sukari/licence-overview
CONCESSION AGREEMENT
Corporate Structure
License 160km2
CENTAMIN PLC 30 year license grated in 2005, with option for a
further 30 years
(CEY LN;CEE CN)
Royalty 3% NSR
Profit Share Profit Share was triggered in 2016, after full
with EMRA $1.2bn cost recovery.
100% Profit Share schedule:
1. 40% first 2 years (to June 2018)
2. 45% for next 2 years (to June 2020)
3. 50% of revenue net of all qualifying costs
PHARAOH GOLD MINES thereafter.
(Concession Agreement)
Cost Recovery Growth capital expenditure is recovered over
three years
Sustaining capital expenditure is recovered in the
year it is incurred
50%
Taxes No other direct or indirect taxes
EGYPTIAN Other Early payments were made to EMRA in 2013,
MINERAL 2014, 2015 in line with returns made to
50% RESOURCES shareholders by way of dividends. These early
SUKARI GOLD MINES AUTHORITY
payments were later offset against the first profit
(“EMRA”)
share payments made in 2016.
12CONTRIBUTION TO OUR OPERATING COUNTRY
Corporate social responsibility
Supporting our operating host country and local community
H1: $39.3m paid to EMRA in profit share H1: $9.0m in royalties to ARE*
Total US$323m
DIRECT financial
contribution to
$198.3m paid to EMRA in profit share to date $125m paid to ARE in royalties to date ARE
In addition to the above, we engage in various local community projects and initiatives to ensure we maintain our social
license to operate, lead by strong relations with local stakeholders, as set out in the CSR report found on our website
>1,350 Egyptian >270 Egyptian
employees company suppliers
95% 44%
workforce is suppliers are
Egyptian Egyptian
13
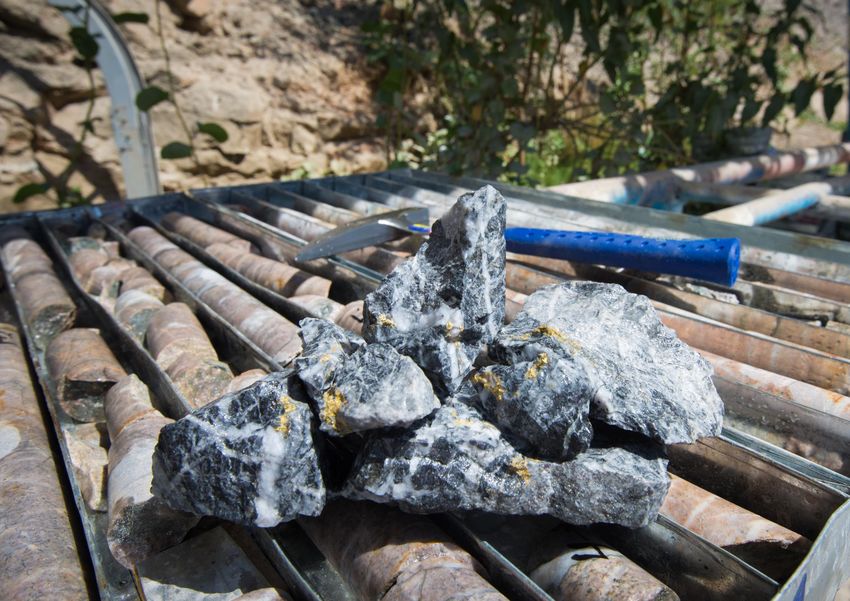
*Arab Republic of Egypt (“ARE)SUKARI OVERVIEW
Quick facts
License area 160km2 SUKARI MINE PRODUCTION COSTS (US$m)
Operations Open pit (owner-operator) & underground (contractor) Refinery &
G&A
US$9m transport
Geology Two parallel structures trending NNE and dipping E US$1m
• Porphyry intrusive, hosting the low grade, bulk
tonnage open pit
• High grade underground zones, located along the
contact zones of the structures
OP mining
Resources 11.8Moz M&I US$55m
Reserves 8.0Moz P&P
LOM Open pit: >20 years Processing
Underground: >5 years US$81m
Plant 12.5Mt pa CIL
Production 2017A: 544.7koz Au
UG mining
2018F: 505-515koz (1H18A: 217.1koz) US$11m
AISC (US$m) 2017A: US$426m
2018F: US$442m – US$458m (H118A: US$202m)
Unit AISC 2017A: US$790/oz
(US$/oz sold)
H1 2018: US$157m (H1 2017: US$152m)
2018F: US$875-US$890/oz (H118A: US$930/oz)
Safety 2017A: LTIFR 0.24 (1H18: LTIFR 0.07)
14SUKARI OVERVIEW
Site layout
Access 8km gravel road off the
Edfu/Marsa Alam paved
highway
100km to Marsa Alam
International Airport
Water 25km salt water pipeline
Desalination plant
40-45% of processing water
is recycled off the TSF
Power HFO, 70MW capacity
Solar feasibility underway
Tailings 1 tailings storage facility
(TSF), with another under
construction
15
15HEALTH AND SAFETY
Invested in our people
Annual LTIFR (per 200,000 hours worked)
• People and workplace safety is our number one priority
0.50 • Industry leading health and safety record, targeting zero-
harm
0.40
0.30 • Group H1 LTIFR is 0.06 per 200,000 man hours worked
0.22
0.20 • Health and safety training forms a critical part of delivering
0.10 0.06 H1 2018
sustainable operations, along with continued professional
development training that ensures operational excellence
-
2013 2014 2015 2016 2017 2018 and career advancement
H1 2018
LTIFR • Cote d’Ivoire maintains a zero harm safety record since
Total man hrs
LTI per 200,000 exploration began, with Q2 LTIFR 0.00:
worked
hours
• Ten consecutive quarters without an LTI, over a total
GROUP 1,623,252 1 0.06
of 1,161,200 man hours worked
Sukari 1,433,316 1 0.07 • Burkina Faso maintains a zero-harm record, Q2 LTIFR 0.00:
• Sixth consecutive quarter without an LTI, over a total
Burkina Faso 40,682 0 0.00
of 391,789 man hours worked
Cote d’Ivoire 149,254 0 0.00
16OPEN PIT
OPEN PIT MINE
Long life, low cost, bulk tonnage operation

 Mining       Owner-operator
              Bulk tonnage operation
                     ▪ 2018F: 75Mt total
                        material moved
                     ▪ 2018F: 20Mt total ore
                        moved
                     ▪ 2018F: 0.58g/t mined
                        grade, inc DL, stockpile
 Pit design   7 stages; currently mining Stage 4:
              source of ore for the next 4 years
 Final Pit    2.7km long x 1.3km wide

 Resource     Sukari M&I resource: 11.8 Moz

 Reserve      Open pit P&P reserve: 7.2Moz @
              0.93g/t, 239Mt
 LOM          > 20 years

                                                    18
OPEN PIT
Mining Stage 4
1 Jan 2018
H1 2018 OPEN PIT
▪ Excellent mining productivity with total material moved
ST7 ST6 ST5 ST4
of 36.9Mt, a record six-month figure for the mine
▪ Transitional zone has delivered more tonnes and lower 1160 RL
grades than planned
▪ 11.6Mt total ore mined at a grade of 0.51g/t,
1200 RL
comprising:
▪ 5.6Mt @ 0.64g/t delivered to the mill 1060 RL
▪ 1.8Mt @ 0.37g/t delivered to the dump leach Mining Jan-Jun 2018
▪ 4.2Mt @ 0.39g/t delivered to low grade stockpile
30 June 2018
2018 OUTLOOK
▪ Exiting transitional zone in Q3, into primary ore in Q4 ST7 ST6 ST5 ST4
▪ Expected FY2018 overall open pit mill feed of ~0.71g/t
1080 RL
▪ Overall mined grade ~0.58 g/t
1200 RL
1060 RL
19
Mining Jun-Dec 2018OPEN PIT
Mining Stage 4
Open Pit Plan View : 2018F Stage 4 at year end
31 Dec 2018
Open Pit Plan View: Sukari
porphyry ST ST ST ST
7 6 5 4
1010 RL
1200 RL
1040 RL
20UNDERGROUND
UNDERGROUND MINE
Shallow, high grade ounces

Mining     Contractor: Barminco
           Method: Long-hole stoping, room and pillar, cascade stoping
Design     Amun/Ptah production decline: engineered to 1.5Mtpa,
           optimal is 1.3Mtpa, to depth of c.600m vertical metres
           Cleopatra exploration/development decline under
           construction: engineered to 1Mt pa
Resource   1.6Moz M&I @ 6.8g/t, 7.4Mt
Reserve    0.8Moz P&P @ 5.1g/t, 4.7Mt
LOM        Current reserve supports > 5yr LOM
Upside     2017 increased UG reserves in excess of mine depletion over
           two years; Orebody open at depth

                                                                                                  22
                              Amun / Ptah Underground Long Section (looking east): 2018 stoping
UNDERGROUND
Interim Results
H1 2018 UNDERGROUND UNDERGROUND ORE MINED AND AVERAGE GRADE
▪ Total production 601kt at 5.69g/t 350 12.0
300 10.0
▪ Production from stoping, 340kt at 5.86g/t 250 8.0
200
▪ Ore from development 261kt at 5.48g/t 150
6.0
4.0
▪ Stoping tonnages impacted by equipment availability 100
2.0
50
▪ 55:45 stoping : development split 0 0.0
▪ H1 grades lower than plan due to:
▪ Development / stoping mix
Development Ore Stoping Ore Amun/Ptah Grade
▪ Dilution within large cascading stopes
2018 OUTLOOK TOTAL DEVELOPMENT METRES (MINERALISED + WASTE)
2,500
▪ Better balance of stoping and development tonnes
2,000
▪ ~60:40 stoping development split for FY2018 1,500
▪ High grade deferred stopes expected to be accessed 1,000
from Q3 500
0
▪ Significantly lower stope dilution from cascading
mining scheduled over balance of the year
▪ Tighter control on development headings Development Metres
23PROCESSING
PROCESSING
Exceeding 12.5Mt pa throughput

Capacity       Plant throughput : 12.5Mt pa

Design         Sulphide flotation, fine grind, carbon-in-leach plant (CIL)
               Conventional SAG and ball mills
First Pour     26 June 2009

Feed grade     2017A:       1.57g/t
               2018F:       1.35g/t (H118A: 1.15 g/t)
Recovery       2017A :      88.1%
               2018F :      89% (H118A: 88.6%)
Construction   4 stage build from 4.5Mtpa (2009) – 10Mtpa (2014)
               Fully funded from equity, on time and on budget
                                                                             25
PROCESSING
Interim Results
2018 PERFORMANCE AND OUTLOOK PLANT PERFORMANCE
▪ Strong performance across the process plant 1,550
1,500
100%
95%
1,450
▪ Plant throughput in H1 of 6.2Mt, running at an 1,400 90%
1,350 85%
annualised rate >12.4Mtpa due to record productivity 1,300 80%
1,250
levels 1,200 75%
1,150 70%
▪ H1 head grade of 1.15g/t due to lower mined grades
▪ Improved metallurgical recovery rates to 88.6% (vs.
87.5% H1 2017) despite lower grade Plant Productivity Recovery
PROCESSING PLANT THROUGHPUT (Mtpa) ORE PROCESSED AND FEED GRADE
14.0 4,000 2.00
12.0 1.60
3,000
10.0 1.20
8.0 0.80
2,000
0.40
6.0
1,000 0.00
4.0
2.0
0.0
2009 2010 2011 2012 2013 2014 2015 2016 2017 2018F Total Ore Processed Plant Feed Grade
26PROCESSING PLANT
Flow sheet
27DUMP LEACH
Low cost ounces : Monetising marginal tonnes
2x dump leach pads
▪ South Dump Leach, located on the west of Sukari hill over
approx. 25ha and currently has 16.4Mt of ore stacked
▪ North Dump Leach, located at the north of Sukari over
approx. 15ha. North DL was constructed in Q2 2018 and has
0.93Mt of ore stacked to date. Irrigation began in Q3 2018.
▪ H1 production: 5,183 ounces, a 37% increase on H1 2017.
▪ Increased oxide material and transitional ore delivered to the
dump leach pads as a result of the thicker than expected
Stage 4 transitional zone.
▪ Operational all year
▪ Head grade of ore: 0.3-0.4g/t
▪ Average recovery rate: ~60%
28EXPLORATION
SUKARI RESERVES

Sukari Open Pit Mineral Reserve
                                                                                                         2017                                                                                                                   2015
                                                              Tonnes                                   Grade                                     Gold                                 Tonnes                                   Grade                                    Gold
                                                               (Mt)                                   (g/t Au)                                  (Moz)                                  (Mt)                                   (g/t Au)                                 (Moz)
    Proven                                                        159                                    1.02                                     5.2                                     130                                    1.11                                     4.6
    Probable                                                       70                                    0.80                                     1.8                                      99                                    1.07                                     3.4
    Stockpile                                                      10                                    0.52                                     0.2                                      21                                    0.42                                     0.3
    Total                                                         239                                    0.93                                     7.2                                     250                                    1.03                                     8.3
• The effective date of the reserve and resource statement is 30 June 2017 or 30 June 2015 as relevant                                 • Cut-off grades (gold): CIL oxide 0.35g/t, CIL transitional 0.35g/t, CIL sulphide 0.35g/t, Dump Leach oxide 0.2g/t
• Totals may not equal the sum of the components due to rounding adjustments                                                           • Designed underground reserves detailed below do not form part of the open pit reserve
• Based on mined surface as at 30 June 2017 and a gold price of US$1,300 per ounce

Sukari Underground Mineral Reserve
                                                                                                        2017                                                                                                                    2015
                                                             Tonnes                                   Grade                                   Gold                                    Tonnes                                  Grade                                    Gold
                                                             (‘000 t)                                (g/t Au)                               (‘000 oz)                                 (‘000 t)                               (g/t Au)                                (‘000 oz)
    Proven                                                        0.7                                     8.5                                    200                                      1.0                                     6.1                                     200
    Probable                                                      4.0                                     4.4                                    569                                      1.7                                     5.9                                     320
    Sub-total                                                    4.7                                      5.1                                    769                                      2.7                                     6.0                                     520
    Development (Probable)                                        0.6                                     0.9                                     18
    TOTAL                                                        5.4                                      4.5                                    787                                      2.7                                     6.0                                     520

• The effective date of the reserve and resource statement is 30 June 2017 or 30 June 2015 as relevant
• Totals may not equal the sum of the components due to rounding adjustments
• Based on underground mine workings as at 30 June 2017
• Long Hole Stopes for reserves estimation are designed using a 3.0g/t elevated cut-off and mining dilution applied at 15% @ 0.4g/t as all stopes are located in mineralised porphyry and 10% mining loss is then assumed to allow for stope bridges and material left in stopes after mining.
  For shallow-dipping long hole stopes a 50% mining loss has been assumed
• Room and Pillar Stopes for reserves estimation are designed using a 3.0g/t elevated cut-off and mining dilution applied at 10% @ 0.8g/t as all stopes are located in mineralised porphyry and 40% mining loss is then assumed to allow for non-recovered pillars and material left in stopes
  after mining                                                                                                                                                                                                                                                                                   30
• Mineral Resources are reported inclusive of those resources converted to Proven and Probable Mineral Reserves
SUKARI RESOURCES
Sukari Total Mineral Resource
Measured Indicated Total Measured + Indicated Inferred
Cut-off Tonnes Grade Tonnes Grade Tonnes Grade Gold Tonnes Grade Gold
g/t Au (Mt) (g/t Au) (Mt) (g/t Au) (Mt) (g/t Au) (Moz) (Mt) (g/t Au) (Moz)
0.3 240 1.02 145 0.84 385 0.95 11.75 25 0.80 0.64
0.4 199 1.15 114 0.97 313 1.09 10.95 19 0.90 0.58
0.5 167 1.29 92 1.10 259 1.22 10.17 15 1.1 0.52
0.7 121 1.55 62 1.34 183 1.48 8.72 10 1.3 0.43
1.0 80 1.92 36 1.70 116 1.85 6.90 6 1.7 0.31
• The effective date of the reserve and resource statement is 30 June 2017
• Totals may not equal the sum of the components due to rounding adjustments
• The Mineral Resource estimate is based on the open pit mined surface as at 30 June 2017 and adjusted for underground mine workings as at 30 June 2017
• All available assays as at 30 June 2017
• Resource data set comprises 311,419 two metre down hole composites and surface rock chip samples
• Mineral Resources are reported inclusive of those resources converted to Proven and Probable Mineral Reserves
• The resources are estimates of recoverable tonnes and grades using Multiple Indicator Kriging with block support correction
• Measured Resources lie in areas where drilling is available at a nominal 25 x 25 metre spacing, Indicated resources occur in areas drilled at approximately 25 x 50 metre spacing and Inferred resources exist in areas of broader spaced drilling.
• The resource model extends from 9700mN to 12200mN and to a maximum depth of 0mRL (a maximum depth of approximately 1,000 metres below wadi level)
Sukari Underground Mineral Resource (included within the total resource above)
2017 2015
Tonnes Grade Gold Tonnes Grade Gold
(‘000 t) (g/t Au) (‘000 oz) (‘000 t) (g/t Au) (‘000 oz)
Measured 1,947 8.9 554 1,850 6.5 390
Indicated 5,492 6.0 1,065 2,820 7.0 630
Total M&I 7,439 6.8 1,619 4,670 6.8 1,020
Inferred 6,711 4.5 976 6,970 5.6 1,240
• The effective date of the reserve and resource statement is 30 June 2017 or 30 June 2015 as relevant • Measured Mineral Resources are defined by a drill spacing of at least 20m x 20m and confined to the interpreted
• Totals may not equal the sum of the components due to rounding adjustments mineralisation defined by underground mine development. Indicated Mineral Resources are defined as areas outside the
• The Mineral Resource is reported above 2g/t within interpreted mineralised domains Measured Mineral Resource and defined by approximately 20m x 20m drill spacing. Inferred Mineral Resources include all
• The Mineral Resource estimate is depleted by underground mine workings as at 30 June 2017 remaining estimated mineralisation defined by a drill spacing of approximately 50m x 50m
• All available information has been used including mapping from underground mining and assays as at 30 June 2017 • Mineral Resources are reported inclusive of those resources converted to Proven and Probable Mineral Reserves. 31
• Available resource data resulted in 41,277 one metre down hole composites used for grade estimation • The underground resource is located within the boundaries of the total resource, and is included within that total
• The Mineral Resources were estimated utilising a single Indicator weighted Kriging method (IK) to estimate gold for each of the mineralisation domainsSUKARI LONG TERM SUSTAINABILITY
Orebody remains open at depth
AMUN CROSS SECTION LOOKING NORTH
▪ Underground exploration and development strategy
remains:
‐ Reserve replacement
‐ Resource growth and improved classification
‐ Maintain development at >3yrs ahead of mining
‐ Reduce sensitivity to equipment downtime
▪ H1 drilled 20,254m from Amun/Ptah and 14,209 from
Cleopatra, as scheduled and under budget
▪ H2 forecast drill programme:
‐ 4 rigs targeting reserve and resource expansion:
1. Cleopatra
2. Ptah deeps: Northern extensions;
Extensions along the Eastern Contact
3. Ptah Keel: Infill drilling; Eastern and
Western resource extension
4. Top of Horus
32UNLOCKING SUKARI’S FULL POTENTIAL
Q2 2018 drill intercepts highlights
33
33SUSTAINABILITY
Significant reserve-resource growth potential
PTAH CROSS-SECTION : 2018 EXPLORATION DRILLING BAST CROSS-SECTION : 2018 EXPLORATION DRILLING
34NEAR TERM GROWTH
Cleopatra, unlocking the North; Top of Horus, orebody remains open at depth
CLEOPATRA CROSS-SECTION : 2018 EXPLORATION DRILLING TOP OF HORUS CROSS-SECTION : SIGNIFICANT INTERCEPTS
35REGIONAL EXPLORATION
Sukari License Area
RED SEA
Sukari North Prospects
N ▪ Sukari is a world-class gold district (+15Moz)
hosted on a major ANS terrane boundary, a
NW verging, obducted, ophiolite thrust belt.
Sukari V
Mine Shear ▪ Sukari Resources are currently drill defined
around the 2.5km long by 0.6km deep Sukari
porphyry which sits axially within a much
wider 17km long by 3.7km ophiolite shear
zone.
▪ There are 7 main surface prospects hosted
along 5 primary domain gold trends, within
the license. All surface prospects are within
Quartz trucking distance to the existing processing
Ridge plant and infrastructure.
Sami
South ▪ Q2 2018 successfully completed the first
stage petrophysics for the application of 3D
seismics across the license area.
Shu ▪ Conduct further DTH geophysics in H2 2018;
Start 2D Seismic sections in Q1 2019, with
which to construct a robust district 3D geo-
seismic architecture of the license area to
Kurdeman depths >1.5km, targeting potential new
Sukari-style porphyries.
Tenement area: 160km2
36REGIONAL EXPLORATION
Sukari License Area
SUKARI REGIONAL PROSPECTIVITY – Q2 2018
Sukari Mine Sukari
North
V Shear
Sami South
Sukari
North
Quartz
Ridge
Kurdeman
Sukari
Mine V Shear
Shu
Quartz
Ridge
Shu
Sami South
Kurdeman
37ARABIAN NUBIAN SHIELD
Strategically positioned
▪ Sukari first modern mechanised gold mine
▪ Historic gold belt: 65 historic gold mines known across the
ANS.
▪ Competitive advantage: Centamin’s operational track
record, country presence, skilled work force, local and
geologic understanding gives the Company a competitive
advantage to look at further growth opportunities within 38
the ANS.GROUP EXPLORATION PIPELINE
Positive Group exploration results delivered across the portfolio
SUSTAINABILITY
NEAR TERM
Sukari Underground
Sukari Underground
Amun/Ptah Decline
Cleopatra Exploration Decline
Resource extension drilling continued to return excellent
Successful early stage results identifying good grades on results
the contact zone
21m @ 37.2g/t; 9m @ 226g/t; 57m 6.8g/t
Self-funding project due to pre-production revenue
generation Underpinning the long term sustainability of the
underground
MEDIUM TERM LONG TERM
Doropo Project ABC Project
Near resource, near surface extension drilling returned Wide spaced drilling and geochem results indicate
positive results extensive gold mineralised system
Updated resource and reserve/PEA expected H1 2019 Target maiden resource H1 2019
39APPENDIX
BOARD AND SENIOR MANAGEMENT STRUCTURE
Commitment to highest standard of corporate governance and leadership

                                                          BOARD OF DIRECTORS

                     Josef El-Raghy        Independent
                                                               Succession process underway. Intention to announce Non-Exec Chairman by Q3
                       Executive          Non -Executive
                                                                               with an orderly handover until 2018 year end
                       Chairman              Chairman

                                             G. Edward
                        Andrew                                                                                                    Dr Ibrahim
    Ross Jerrard                              Haslam           Mark Bankes           Mark Arnesen           Alison Baker
                         Pardey                                                                                                     Fawzy
   Chief Financial                          Senior Non-        Non-Executive         Non-Executive         Non-Executive
                     Chief Executive                                                                                             Non-Executive
       Officer                               Executive           Director              Director               Director
                         Officer                                                                                                   Director
                                              Director

                                                      SENIOR MANAGEMENT

       Youssef                                                                                  Norm Bailie                        Darren
                                Mark Morcombe
       El-Raghy                                                Alexandra Carse                    Group                          LeMasurier
                                Chief Operating
     GM Egyptian                                              Investor Relations                Exploration                       Company
                                    Officer
      Operations                                                                                 Manager                          Secretary

                                                                                                                                                 41
FOCUS ON COST CONTROL
OPEN PIT MINING COST PER TONNE UNDERGROUND MINING COST PER TONNE
2.50 60
2.00 50
40
1.50
30
1.00
20
0.50 10
0.00 0
Open Pit Mining Cost per Tonne (US$/t) Overall Underground Cost per Tonne (US$/t) Stoping Cost per Tonne (US$/t)
PROCESSING COST PER TONNE ALL-IN SUSTAINING COSTS
20.0
150
15.0 125
100
10.0 75
50
5.0 25
0
0.0
Processing Cost per Tonne (US$/t) All-In Sustaining Costs (US$m) Gold Sold (koz)
42
Note: Overall Underground Cost per Tonne calculated as expensed and capitalised mining costs divided by total tonnes moved from underground
Stoping Cost per Tonne calculated as expensed mining cost divided by stoped ore producedCOST BREAKDOWN
GROUP Cost Centres GROUP FX Exposure
Other 10% 10% Other 10% 8%
Labour 9% 9% 16%
AUD 15%
Fuel 18% 16%
21%
EGP* 24%
Contractors 27%
25%
55%
USD 51%
Consumables
38%
38%
H1 2018 H1 2017 H1 2018 H1 2017
43
• EGP includes fuel costs which are linked to USD prices
• Group cost centre and FX breakdown incorporates all group expenditure including capexDISCIPLINED CAPITAL ALLOCATION
US$135m
▪ FY2018 Capex Budget (including US$22m greenfield
Exploration
exploration) of US$135m
Burkina Faso
▪ H1 2018 US$64m (47%) spent
▪ $51m sustaining capex
Côte d'Ivoire ‐ Fleet rebuild programme spend peaked
‐ Working capital systems upgrade complete
Egypt: Cleopatra (excl. ‐ Stores inventory reached target warehouse level
revenue)
▪ H2 2018 and beyond…
‐ Optimisation of maintenance programme
Sustaining capex
Sukari UG exploration
‐ Deferral of non-critical sustaining capex items
‐ Procurement Committee established to
Sukari UG development review/negotiate supply contracts and tender
processes
‐ Results driven exploration model
Other sustaining capex
44
FY 2018 CAPEXAlexandra Carse Investor Relations +44 7700 713 738 alexandra.carse@centamin.je
You can also read