April 2021 - Natural Gas ...
←
→
Page content transcription
If your browser does not render page correctly, please read the page content below

April 2021
NGI’s LNG Insight Methodology & “How to Read” Guide
Natural Gas Intelligence’s (NGI) LNG Insight is a daily pricing, data and news service targeting the North
American Liquefied Natural Gas (LNG) market. With more than 30 years of adding transparency to
natural gas markets through its reports and services, NGI aims to shed light on the evolving LNG market
with its newest offering.

Developed in collaboration with the North
American LNG and natural gas markets and first
published in October 2019, NGI’s LNG Insight
aims to provide a global perspective on the
North American natural gas market, particularly
as the United States assumes a larger role in the
worldwide LNG industry.

This document serves as both a methodology
and a “how to read” guide for the various LNG-
related charts, graphs and tables we publish
each business day. For more information, please
contact us at lng@naturalgasintel.com.

Previous 5 Trading Days
Summary Table
The Summary Table on page 1 provides a quick
snapshot of key data from the 20 different
charts and data tables we publish in each day in
LNG Insight. Our goal in providing data from the
previous 5 trading days is to allow readers to
pick up on trends and relationships that may be
forming in the marketplace in one concise, easy
to read format.

                                                                                                             1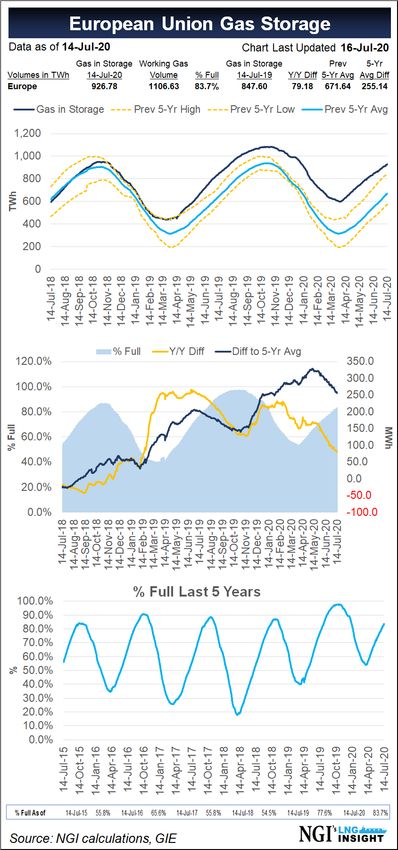
North America Focused Content
NGI’s U.S. Gulf Coast LNG Netback Prices (12-Month Strip)
Our U.S. Gulf Coast Netback Prices table aims to measure the value of LNG sold on a Free On Board
(FOB) basis in the U.S. Gulf Coast by starting with the futures prices of natural gas in both Asia and
Europe, and deducting from that shipping costs to move LNG from Sabine Pass to those respective
markets. The highest netback from the three individual routes we consider is the resulting netback price
for each month.

For example, in the chart below, the November Japan/Korea futures price is $5.820/MMBtu, and the
estimated round-trip cost to transport LNG from Sabine Pass to, and back from, that part of the world is
$2.551/MMBtu. The resulting netback from that route is therefore $3.269/MMBtu. Applying the same
formula to the National Balancing Point (U.K.) and the Title Transfer Facility (Netherlands) yields
respective netbacks of $4.046/MMBtu and $3.865/MMBtu. $4.046 is the highest of the three – or
maximum as we call it in the chart - and thus is the November Gulf Coast netback price for that day.

Example Calculation of NGI’s U.S. Gulf Coast LNG Netback Price

 All Figures in $US/MMBtu                         JPN/KOR          National Balancing         Title Transfer Facility
                                                                     Point (NBP)*                     (TTF)*
 November Futures Price                             $5.820              $5.340                        $5.235
 Less: Round Trip Shipping Costs from               $2.551              $1.294                        $1.370
 Sabine Pass
 U.S. Gulf Coast Netback                            $3.269                $4.046                       $3.865
 Maximum Netback (& therefore
 the overall November Gulf Coast                                               $4.046
 Netback Price):

 *Because the NBP and TTF contracts trade in pence/therm and Euro/MWh, respectively, we convert them to $US/MMBtu,
 based on the current forex futures strip for each currency. We list actual NBP and TTF prompt month futures settles in a
 different table, as shown in the Prompt Month Global NatGas Futures Settlements section below.

We calculate the U.S. Gulf Coast LNG netback prices in the same manner for the next 11 months, using
relevant futures contract prices, shipping rate assumptions and exchange rates for each listed month.

Higher Gulf Coast netback prices certainly indicate stronger international LNG demand, but we also
believe they could lead to increased pipeline gas flows into the Gulf Coast region, which in turn could
impact U.S. regional natural gas basis differentials.

One of the key inputs we use to calculate months 2-12 shipping costs is the West of Suez LNG Vessel
Rate Curve, a chart we describe in more detail on page 5. Since these shipping costs are based on
historical seasonality, the resulting netback curve may not necessarily reflect what current conditions
the market may be discounting. However, we believe this chart offers the industry a comparative
baseline as to where the next 12 months of Gulf Coast netback prices likely would be, assuming current
market vessel rates and historical vessel rate seasonality hold.

                                                                                                                            2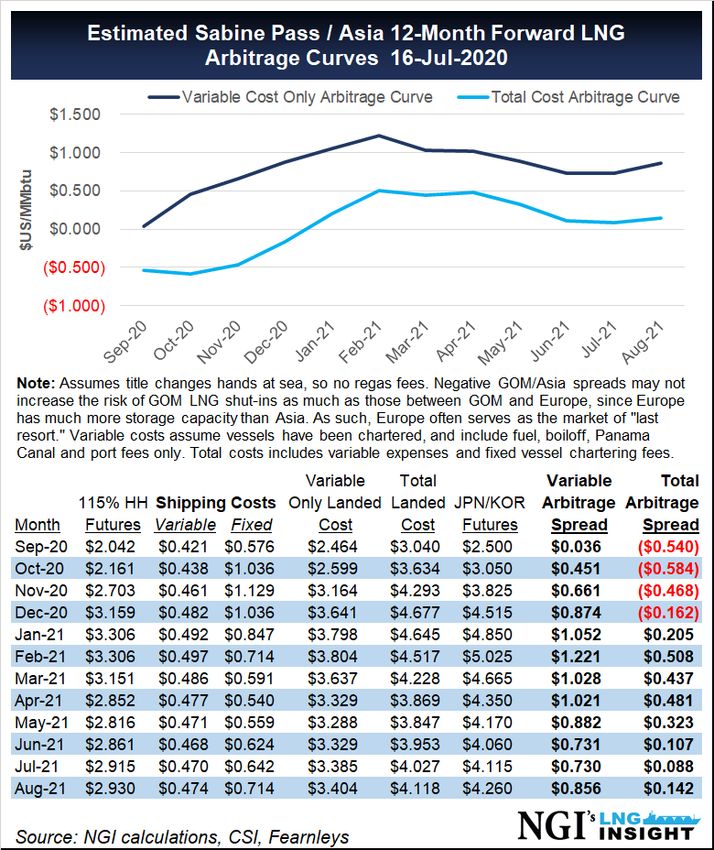
Understanding the LNG Production Margin

Subtracting current Henry Hub futures contracts from our Gulf Coast Netback prices yields an estimated
LNG production margin at Sabine Pass, which is another measure used by the industry to estimate
relative global demand for LNG.

The higher this difference/margin, the more U.S. LNG is in demand, and the more robust LNG
liquefaction gross margins in the Gulf Coast become, everything else being equal. We believe this is
similar to the “cryo-spread” figure Tellurian Inc. publishes each day.

How Does NGI Calculate Shipping Costs?

Each of our shipping costs represents the estimated round-trip cost to transport LNG from Sabine Pass
to Asia and Europe, and are based on the following assumptions:

                                                                                                        3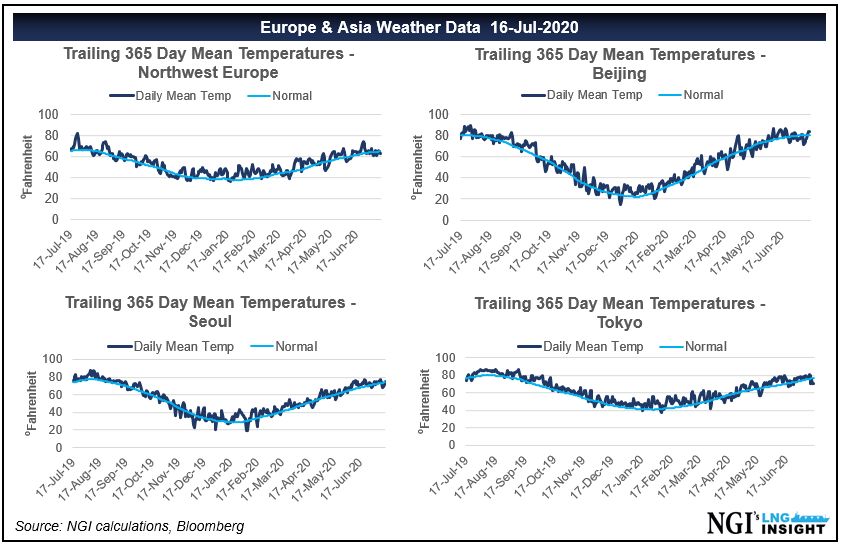
Calculations for months 2-12 include
relevant commodity prices and
exchange rates for each of those
months, along with our estimate of
what a 12-month forward strip may
look like, based on the current $USD
spot market and 1-year time charter
rates for a 174,000 m3 (cubic
meters) two-stroke vessel published
by Fearnleys AS, along with historical
seasonality. For more information,
please see the Spot Vessel Rate
Forward Curve section below.

Please also be advised that our other
assumptions, such as knots, boiloff
percentages, number of days in port, etc. differ somewhat from those used by Fearnleys, so the various
Sabine Pass-based shipping costs they calculate may also differ from our figures.

Defining the Spot Month

In our calculations, the spot month changes to the next month after the 15th of each month since that is
the approximate date when the Asian futures contract expires.

For example, on the first trading day after Oct. 15, the spot month would become December for all the
futures contracts in the table, even though some of those other contracts would still be trading for
November. This allows a way to remain consistent in the months measured.

In this example, the actual spot month Henry Hub contract (November) does not expire until the third to
last trading day of the month, and the two European contracts go off the board one trading day later. In
order to fill this coverage gap, we continue to list the actual spot market contracts for each of the
futures prices in our separate Prompt Month Global NatGas Futures Settlements table, as shown on
Page 8.

Spot Month Sabine Pass Export Landed Price Arbitrage Continuation Chart
The Spot Month Sabine Pass Export Landed Price Arbitrage Continuation Chart represents what the
spreads have been over the last year to ship LNG from Sabine Pass to the Gate Terminal in the
Netherlands, and to the Futtsu Terminal in Japan.

These calculations incorporate feed gas and variable liquefaction charges, which we assume to be 115%
of the current Henry Hub futures contract (in accordance with the Cheniere Energy Inc. methodology for
some of its contractual arrangements), along with the total shipping charges (variable and the fixed cost
of the charter vessel) we list in the Gulf Coast Netback table. Comparing the two calculations also
suggests how much more advantageous it is to send LNG from Sabine Pass to Europe vs. Asia, although
that of course depends on the actual terminal to which the LNG is shipped.

                                                                                                         4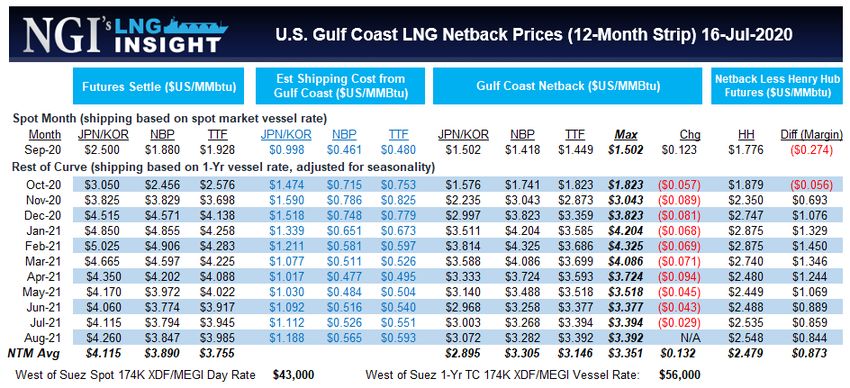
For example, if the spot TTF futures contract is $5.235/MMBtu, the spot Henry Hub futures contract is
$2.214/MMBtu, and the shipping cost between Sabine Pass and the Gate Terminal in the Netherlands is
$1.370/MMBtu, then the spread between Sabine Pass and Gate is $5.235 - $1.370 – ($2.214*1.15) =
$1.319/MMBtu.

Our calculations only assume landed prices, or delivery to the respective regasification terminals, and
include neither regasification fees nor any charges to access the pipeline grid. This is an important
consideration, since JPN/KOR is a pure LNG price, whereas NBP and TTF are delivered-to-pipeline prices.
As a result, one should also include the variable costs of regasification and variable charges to access the
pipeline grids in the UK (NBP) and the Netherlands (TTF), to get a better measure for the true arbitrage
spread to those European nations. We believe such variable charges tend to range between US$0.10-
$0.50/MMbtu. Such an adjustment is not necessary for cargoes to Asia, once again because JPN/KOR
futures are a pure LNG price.

West of Suez LNG Vessel Rate Curve
The spot market vessel rate curve we publish
each day serves two main functions. First, it is
a major component in our monthly shipping
rates calculations, which we need to fill out
months 2-12 of our Gulf Coast Netback table.
Second, it indicates what spot market LNG
vessel rates could look like for the next 12
months, based on current LNG vessel rates and
historical seasonality.

Our West of Suez LNG Vessel Rate Curve is not
an actual traded curve. Rather, it is something
we impute based on the current one-month
spot market rate for a 174,000 m3 XDF/MEGI
vessel in the Atlantic Basin, the 1-yr term
contract rate for the same vessel, and
historical spot market rate seasonality. Said
differently, our spot LNG vessel rate curve
indicates what the expected Atlantic Basin spot
rate should be for the next 12 months if
current LNG spot vessel rates, current LNG 1-
year term charter rates and historical vessel
rate seasonality all hold.

The average of our individual 12-month rates
will equal the current 1-year term contract
rate.

We also list absolute prices for the curve in the
table on the lower righthand corner on page 5.

                                                                                                           5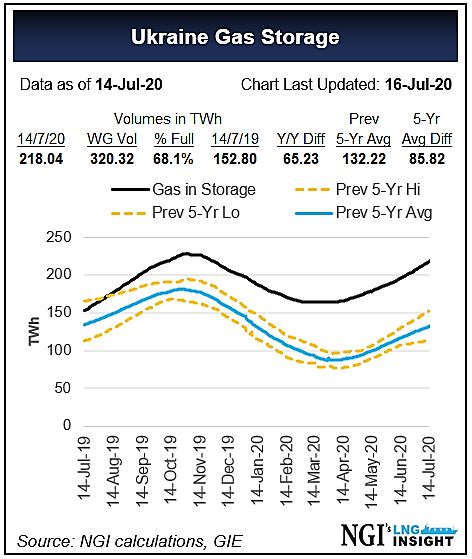
Other North America LNG Netback Prices
In addition to our signature Gulf of Mexico LNG netback price, we also calculate netback prices to Cove
Point, MD; Kitimat, BC; and Costa Azul, MX. Our methodology for these three locations is exactly the
same as that described above for the Gulf of Mexico, in that we start with gas prices in Asia and Europe,
and deduct LNG shipping costs from those to determine the maximum netback price at each location for
the next twelve months. We then compare that forward LNG netback strip to the forward curve for the
nearest physical market index in order to determine the LNG production margin at each location. We
also include Waha forward prices in a separate column, because we believe more U.S. LNG purchases
will be tied to this index in the coming years.

How Can NGI Publish Netback Prices for Kitimat & Costa Azul? Those Export Facilities Aren’t
Operational Yet!

As of this writing (May 2020), the LNG Canada facility in Kitimat, BC, was scheduled to enter service by
2025, and Sempra Energy had yet to reach its final investment decision on building export capability at
the exiting Costa Azul import terminal. Obviously, the netback prices we publish for these two locations
are not based on any actual LNG flows. However, we believe these figures will allow the industry to
monitor the theoretical profitability of these two locations over time, and will help the market
understand how seasonal physical market price movements in Western Canada and near the
California/Mexico border could impact the economics of these two locations over the coming years.

                                                                                                           6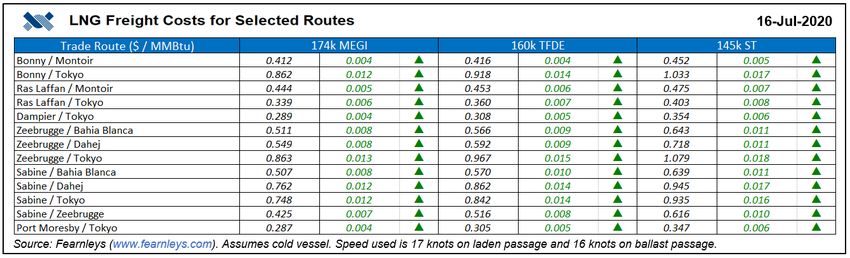
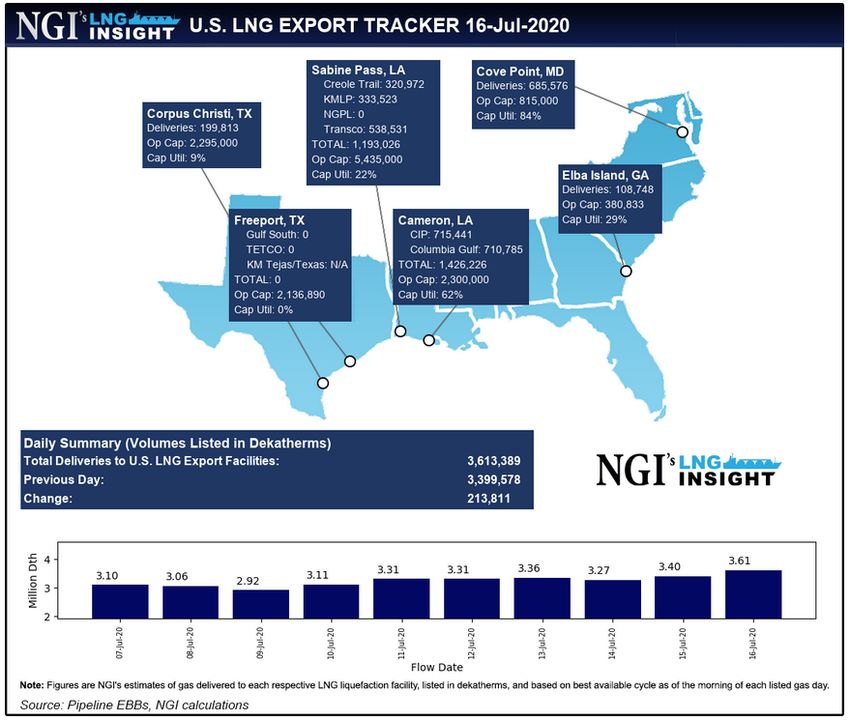
NGI’s U.S. LNG Export Tracker
Our U.S. LNG Export Tracker is
created each trading morning and
shows the number of dekatherms
(Dth) that have been nominated
via the pipelines serving each of
the six U.S. LNG liquefaction
facilities in the lower 48 (L48)
states for that gas day. Because
we create the tracker in the
morning (U.S. Eastern Time), the
flows are based on the best
nomination cycle at the time,
which tends to be the evening
cycle.

However, we realize more gas may
be nominated during the
subsequent three intraday cycles,
so we also perform another scrape
of the various pipeline electronic bulletin boards the next day, to ensure we bank the final total. For
example, in the chart above, the 3.61 million Dth for July 16 represent flows based on the evening cycle,
whereas the 9 days before that are all adjusted figures taken after the final intraday 3 nomination cycles
for those flow days. However, if that 3.61 million Dth preliminary figure for July 16 were to change, we
would show the updated and final number in following versions of that table.

NGI’s Daily Henry Hub Spot Index vs. Prompt (CME) Futures Contract

The Henry Hub in Erath, LA, continues to gain prominence as a global natural gas pricing benchmark,
especially as U.S. sourced LNG increases its global market share. The prompt Henry Hub futures contract
expires three trading days before the start of the next calendar month, and while laws of market
arbitrage dictate that cash and futures prices must converge at the moment the futures contract goes
off the board, those two prices can vary greatly in the days prior to expiration. Our Daily Henry Hub Spot
Index vs. Prompt (CME) Futures Contract table compares the percentage difference in NGI’s day-ahead
Henry Hub spot market index found in our NGI’s Daily Gas Price Index service to the prompt month
Henry Hub CME futures contract for each trading day during the previous 12 months. Any historically
wide percentage difference suggests that one (or both) of the two markets may be in for a significant
price change, especially if that wide differential still exists closer to the final trading day of the futures
contract.

For more information about our daily, weekly and monthly North American natural gas price indexes,
please visit our website.

                                                                                                             7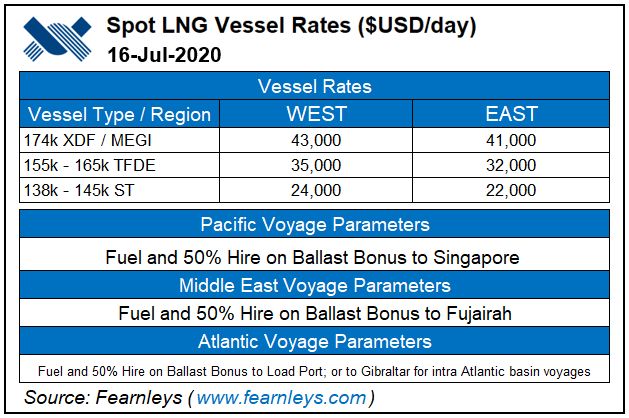
General/Global Focused Content
Prompt Month Global NatGas Futures Prices
Daily settlement prices in this table appear in both local currency/measurement units and
$USD/MMBtu, based on the current spot market exchange rate for the two European futures contracts.

Note these prompt month contracts all settle at different points throughout the month. For example,
the JPM/KOR futures contract tends to settle on or around the 15th of each month, while Henry Hub
futures expire on the third to last trading day before the start of the next month. The two European
contracts go off the board on the penultimate trade day of the month.

After the expiration of all four prompt month futures contracts listed in this chart, we will start listing
prices for the next prompt futures month on the first trading day of that next calendar month. For
example, assume the November JPN/KOR futures expires October 15th, the November Henry Hub
futures contract expires October 29, and the two November European contracts expire October 30. We
would begin listing December futures contract information (the next prompt futures month) on the first
trading day of November (the next calendar month).

                                                                                                          8
Global Natural Gas Futures Settles
Our global natural gas futures settle table
expands upon our Prompt Month Global
NatGas Futures Price table by providing
next 12-month and next complete three-
year calendar strips for the Henry Hub,
JPN/KOR and TTF futures contracts. Each
curve is expressed in $US/MMbtu. Both the
Henry Hub and JPN/KOR contracts trade in
$US/MMbtu, but because TTF trades in
Euro/MWh, we convert those to
$US/MMBtu by bootstrapping a Euro/USD
foreign exchange forward curve for each
relevant month.
Please note these curves only list futures
prices, and do not incorporate any shipping
costs to move gas between the U.S. and
Asia/Europe. As a result, these curves should
not be taken as a direct proxy for the
economics of shipping gas from the U.S to
Asia/Europe, or between Asia & Europe.
However, the wider these spreads, the more
in the money such transactions are likely to be. This is particularly relevant for the so-called 2nd wave of
proposed North American LNG export facilities, as many of those projects have yet to reach FID.
Fearnleys LNG Freight Costs & Spot LNG Vessel Rates
Each day, we republish with permission certain key LNG shipping data provided by Fearnleys, one of the
world’s most prominent shipbrokers.
The Fearnleys charts provide spot
market vessel rates and related charges
for steam turbine, TFDE and two stroke
vessels (XDF & MEGI) in both the
Atlantic (West) and Pacific (East)
Basins.
9In addition, Fearnleys provides NGI with LNG freight cost calculations for certain key routes throughout
the world and breaks those down by the three propulsion classes.
We believe these charts provide an excellent reference point for shipping costs around the world. As
noted before, our Sabine Pass route calculations may differ a bit from those in the Fearnleys charts,
because our assumptions are somewhat different (see page 3 for our assumptions).
For more information about these Fearnleys data, please go to www.fearnleys.com.
Europe & Asia Weather Data
According to data from the International Group of Liquefied Natural Gas Importers (GIIGNL), Europe and
Asia accounted for 93% of global LNG imports in 2019, and weather is a key driver of consumption in
both regions. Our daily Europe & Asia Weather Data chart shows actual and normal average
temperatures for the trailing 365 days in Northwest Europe, Beijing, Seoul, and Tokyo.
Weather is certainly not the only determinant of demand in these two continents, but we believe the
historical normal temperature curve, which is based on data from the previous 30 years, is a good
approximation for the load profile and seasonality in each of these markets. Notice the shape of the 30-
year normal curve is different for each of these areas. For example, Northwest Europe tends to have
cooler summers than those in Asia, while winters in Beijing are typically colder than they are in Seoul
and Japan. All these regions have a somewhat different load profile from that in the United States. So, to
the extent that these areas are having an atypically mild or cold winter/summer, that could impact
demand for U.S. cargoes that runs counter to historical U.S.-only seasonal consumption.
10Asia Focused Content
While Europe serves as the market of “last resort” for LNG, thanks in large part to its ample
underground storage capacity, Asia’s high demand for the fuel often times makes it the market of “first
resort” for LNG shippers. According to GIIGNL, Asia accounted for 69% of global LNG imports in 2019,
led by Japan, China, and South Korea. Moreover, we believe overall LNG demand tends to be less price
sensitive in Asia than in Europe, because several key Asian energy consuming countries have relatively
low to no access to pipeline gas and other fuel sources.
Estimated Sabine Pass / Asia 12-Month Forward Arbitrage Curve
This chart shows the economics of shipping LNG from Sabine Pass to Asia (specifically, to the Futtsu
import facility near Tokyo, Japan) for the next twelve months. Our methodology is similar to the
calculation we use in our Sabine Pass / Gate (Europe) 12-month arbitrage curve chart, in that we start by
taking 115% of the Henry Hub price, and add to that our estimate of shipping costs between Sabine Pass
and Japan for each month in the forward curve. We also calculate separate variable cost only and total
cost curves, for the reasons explained on pages 13-14.
However, there are two main differences between Asia and Europe one should keep in mind when
comparing our Asia and European Arbitrage Curves. First, LNG delivered into Asia tends to change hands
at sea, which means the JPN/KOR futures prices are much more of an LNG price than the TTF price in
Europe. One does not have to factor in any regasification or pipeline access fees for Asian deliveries, as
is the case for LNG cargoes shipped to Europe. Second, negative portions of this Asia arbitrage curve are
11not necessarily a signal that U.S. cargo
shut-ins may be forthcoming, because
those cargoes could still be injected into
underground storage facilities in Europe,
the so-called market of last resort. But a
deeply negative curve does potentially
eliminate Asia as a destination for U.S.
cargoes, and that could place downward
pressure on both the Henry Hub and U.S.
Gulf of Mexico FOB LNG prices.
Daily Prompt Oil Linked
Asia Parity Prices
Our Daily Prompt Oil Linked Asia Parity
Prices chart lists the current spot market
value of LNG delivered to Asia, the
current actual slope of that Asian LNG
price, the theoretical maximum 17.2%
slope vs. the current spot Brent crude
price, and the estimated cost of coal in
Japan. We also calculate the 17.2% slope
vs. the trailing three-month average of
the Japan Crude Cocktail price, as that is a
common reference point as well.
According to GIIGNL, which we believe is one
of the most referred to sources in the LNG
industry, Asia represented 69% of global LNG
demand in 2019, and the majority of LNG
contracts in that region are linked to Brent
crude oil prices. As a result, Brent prices tend
to serve as a cap on Asian LNG prices.
The percentage of Brent at which LNG is
priced, also called the slope, can vary.
Historically, it has tended to be more than
14%, but as of this writing, we believe new
contracts were being signed more in the 11%-
12% range.
Our oil parity price uses a slope of 17.2% of
Brent, which we believe is a bit more
conservative, since it is based on the reciprocal
of the 5.8-to-1 heating value equivalent to a
12barrel of crude oil to one MMBtu of natural gas. As such, this should be the theoretical maximum slope
at which Asian LNG should trade against crude, something that occurred two times in the chart below.
We also show the estimated price of
coal in Japan, which is based on the
prompt month Australia Newcastle
Coal futures price, plus the current
cost of transport to ship coal from
Australia to Japan. Unlike how Brent
Oil Price Parity tends to serve as a
hard cap on JKM prices, coal prices
do not necessarily serve as an
absolute floor on LNG prices in Asia,
but they do show the area in which
coal becomes more economic
relative to gas fired generation in the
region.
Europe Focused Content
Europe tends to be the “market of last resort” for LNG cargoes, because of its extensive underground
storage network and well-established physical pipeline network. As a result, if U.S. sourced LNG cannot
work its way into Europe, then there is an increased probability that these American cargoes may be
cancelled, or “shut in,” everything else being equal.
There are a number of reasons that U.S. LNG cargoes may not be able to discharge in Europe, including
realized prices in Europe that are less than the variable transportation costs between those two
markets, otherwise profitable U.S. LNG cargoes are still more expensive than local European prices, or
storage in the European Union (EU) could be full. We assess these various factors via the following
charts:
Estimated Sabine Pass / Gate 12-Month Forward LNG Arbitrage Curve
This chart shows the potential for U.S. LNG shut-ins by subtracting the landed price of Sabine Pass
sourced LNG versus the TTF price for each of the next twelve months. We calculate the various landed
prices by taking 115% of the monthly Henry Hub futures price and adding our estimate of shipping costs
between Sabine Pass and the Gate Terminal in the Netherlands for those the next twelve months.
Those shipping costs can have both a fixed (sunk) and a variable (incremental) component to them,
depending on how one treats the expense of procuring an LNG vessel. Similar to the obligations faced by
firm transportation take-or-pay pipeline shippers in the United States, who must pay those fees
regardless of whether they use that capacity, LNG shippers are on the hook for vessel charter fees no
matter their usage. As a result, these are sunk, or non-incremental costs, and existing holders of LNG
13vessels will be more concerned about
covering the variable, or incremental
costs of transporting LNG. We show
this via our variable cost only
arbitrage curve, in which we only
include boil-off, fuel, port fees, and
canal charges (where applicable) in our
calculated shipping costs.
Our total cost arbitrage curve includes
all shipping costs, including the
variable costs mentioned above, and
the expense of chartering an LNG
vessel. Such a curve is more
appropriate for entities who do not
already have an LNG vessel, because
for them, charting a vessel is a variable
cost.
Said differently, our variable cost-only
arbitrage curve should be used by
existing shippers who have LNG vessel
capacity already, while our total cost
arbitrage curve is more appropriate for
1.) entities who are considering
entering the LNG space, and 2.) analysts who are looking at the long-term competitiveness of U.S.
sourced LNG. The higher the total cost-only arbitrage window, the greater the potential threat for other
LNG players to enter the market.
Complicating this analysis is the fact that the TTF is a pipeline price, so one should also include the
variable costs of LNG regasification and accessing the Dutch pipeline grid in order to create a true
apples-to-apples comparison. We have elected to exclude such fees from our arbitrage window
calculations, for the sake of simplicity, and because actual variable costs can differ greatly among
shippers. We believe a representative range of them is somewhere between $0.10 and $0.50 per
MMBtu, depending on the regasification facility. So, those looking for “fully loaded” arbitrage window
calculations should add another $0.10 to $0.50 to both the variable only and total cost arbitrage curves.
14U.S. Landed vs. European Prices
U.S. LNG competes with natural gas delivered via
pipeline in Europe, so even if the Sabine Pass-TTF
arbitrage window is positive, meaning U.S LNG is
cheaper than gas in the Netherlands, it could still
be the case that U.S. LNG is more expensive than
gas prices in other European countries.
Our U.S. Landed vs European Prices chart
compares the landed price of U.S. LNG at the Gate
Terminal in the Netherlands (“Gate Landed Price,”
or GLP) to the prompt futures price in Belgium,
Czech Republic, France, Germany, Italy,
Netherlands, Slovakia, Spain, and the U.K.
Negative values in the “Diff to GLP” column
indicate that imported U.S. LNG from the Gulf of
Mexico is more expensive than the local price.
Note our GLP calculation only includes variable shipping costs and does not include the charter cost of
the vessel. We also exclude any additional European variable costs from this calculation, such as
regasification and pipeline access fees. For more on these costs, please see the Estimated Sabine Pass /
Gate 12-Month Forward Arbitrage Curve section above.
European Spark/Dark Spreads
The combination of coal and natural gas fired
generation typically accounts for between
30%-40% of European Union electricity
generation, not an insignificant figure.
However, the relative percentage use of those
two competing fuels at any particular time
depends heavily on just how economic each is
in producing electricity.
Each day, we calculate the gross margin of
producing power in Europe by natural gas via
the spark spread, and the comparative gross
margin for generating European electricity by
coal by way of the dark spread.
15Dirty spark and dark spreads only consider the input fuel cost of generating electricity, while clean spark
and dark spreads also include the cost of emissions in Europe (and in the case of the United Kingdom,
the local Carbon Support levy).
The more economic the clean spark spread is to the clean dark spread, the more likely Europe will burn
natural gas in favor of coal in generating electricity.
Our daily European Spark/Dark Spreads table features clean and dirty spark/dark spreads that we
calculate for Belgium, Czech Republic, France, Germany, Italy, the Netherlands, Slovakia, Spain, and the
United Kingdom, based on applicable prompt month electricity, natural gas, and coal contracts for each
country, and subject to the assumptions and formulas shown above.
16Spanish PVB vs. Dutch TTF Futures
The Dutch Title Transfer Facility (TTF) is one of the most liquid natural gas pricing points in the world,
and as a result, it tends to be used as a proxy for LNG prices in Europe. Because of this, we use TTF as
the main European pricing point in our various LNG arbitrage calculations. However, TTF is a pipeline
price, and therefore is likely more reflective of regional fundamentals rather than those in the global
market.
We believe the emerging Punto Virtual de Balance (PVB) in Spain is a more representative price
indicator of European LNG, because the Iberian peninsula receives a greater percentage of its total
supply from cargoes than the rest of the continent. Spain also has an abundance of storage capacity and
a relatively large number of regasification facilities with reloading capability, making it a more of an
“LNG friendly” destination.
As of May 2020, the TTF futures contract had more than 100x the open interest of its nascent PVB
counterpart, meaning it will likely be quite some time before the PVB gains broader market acceptance.
However, the PVB still provides useful price signals, as the contract tends to trade at a premium to TTF.
The greater the premium, the greater the price advantage LNG enjoys over pipeline gas in Europe.
European Union Gas Storage
Another potential shut-in signal for U.S. (and globally sourced) LNG cargoes is the amount of gas in
storage in Europe since the continent tends to serve as a last resort destination for LNG shipments. The
fuller European gas storage, the less likely Europe will be able or willing to accept additional cargoes,
among other considerations.
Each day, we run the following European Union Gas Storage chart, based on information furnished by
Gas Infrastructure Europe. The top graph displays gas in storage relative to the high, low and average
levels over the previous five years, the middle drills down into where current storage levels are
compared to a year-ago, and to the previous five-year average, and the bottom display is a running total
of gas in storage over the previous six-years, including where storage stood on the current chart date in
17each of those years. That latter chart not
only gives readers a sense of historical
seasonality, but also highlights where
current storage levels are compared to
normal.
Note: Our EU storage figures do not
include the Ukraine, which is a non-EU
country. We list Ukrainian storage in a
separate table, as described below.
Ukraine Gas Storage
Historically, the sizable natural gas
storage capacity in the Ukraine existed
primarily to serve Gazprom, but that has
changed dramatically in recent months.
In April 2019, Ukrtransgaz, which
manages storage and the country’s
transmission system operator, began to
open its system and incentive non-
Gazprom buyers and sellers with
discounted transportation tariffs and
exemptions from customs duties.
The Ukraine is not part of the European Union, and as such, GIE does not include Ukrainian storage in its
main Europe storage count, hence our decision to publish a separate Ukraine storage table each day.
However, we believe the new accessibility of storage in the Ukraine provides a significant secondary
18source of storage capacity in Europe, which should help extend and build upon Europe’s existing role as
the global LNG market of last resort.
European Union LNG Regas Terminal Gas Storage
Our European Union LNG Regas Terminal Storage table shows daily changes in on-site storage levels at a
number of key LNG import facilities in the region. Storage capacity at the various European
regasification terminals represents a very small fraction of total European underground storage, and
therefore does not act as a substitute for or complement to our European Union Gas Storage table
described above.
However, we believe monitoring
the daily percentage of storage
utilization at these regasification
facilities can help yield clues
about their collective ability to
receive more cargoes in the
short-term. Between January
2013 and April 2020, the
average storage capacity
utilization of the European
regasification facilities listed in
the adjacent table was 48.7%, so
any current figure close to this
total indicates recent European
regasification activity has been
operating close to normal. The
maximum utilization since 2013
is 80%, meaning any utilization
approaching that figure indicates
these facilities may be
effectively full. Similarly, storage
at these regasification terminals
was never lower than 22.7%
during this time period, which
suggests any capacity figure
close to 23% means more
cargoes are needed.
19Latin America Focused Content
Latin America DES Prices
Our Latin America DES Prices table aims to
measure the price of LNG for the next three
months that is delivered ex-ship to Argentina,
Brazil, Colombia, Chile, Mexico East
(Altamira), Mexico West (Manzanillo), and
Panama. These prices are essentially cost-
plus, or net forward prices, that start with
cost of LNG from a source country on an FOB
basis and include estimated shipping costs to
transport LNG from the source to the
destination country. Our calculations are
based on the following assumptions:
1.) The shipping routes we consider are
heavily influenced by the source country
of recent LNG imports into each nation.
In most cases, those have been primarily
from the U.S. or Trinidad & Tobago,
especially since more L48 liquefaction
capacity has come online, but we also
consider reloaded cargoes from Europe.
2.) For U.S. and Trinidad-based cargoes, we
use the netbacks we calculate in our U.S.
Gulf Coast LNG Netback Prices table as
the starting FOB price, and for Europe
FOB prices, we use Spanish PVB futures
prices, since as explained earlier in this
document, we believe PVB prices are a closer representation of the LNG market than are the more
commonly referred to TTF prices.
3.) The shipping costs we add to our U.S. netback and PVB futures prices are based on a 160,000 m3
DFTE/TFTE vessel, as opposed to our U.S. GOM calculations, which are based on a 174,000 m3
XDF/MEGI sized ship.
4.) Our published DES prices are the minimum delivered price from the U.S. GOM and Spain for each
location.
20LNG Data Suite
NGI provides a portion of the data featured in this methodology in both Microsoft Excel format, as part
of our datafeeds via API, and through our channel partners. The data suite offers daily netback prices,
arbitrage curves, U.S. LNG export flow data, shipping costs, vessel rate curves (West of Suez), landed
prices, Latin America DES Prices, and Slope-to-Brent Prices (Slopes). For more information about this
service and the data series included, click here.
For more information on how to download/scrape these data, please see our Data Spec & Automation
page.
When Are the Various LNG Insight Tables Updated Each Day?
NGI’s LNG Insight is available in both pdf and html (website) formats. While we generally send out the
PDF by 6 p.m. Eastern Time each business day, we do update the html versions of our content
continuously throughout the day, according to the following schedule (charts/tables listed in order of
appearance in the daily .pdf file):
Chart/Table Update Time (U.S. Eastern Time)
LNG Related News/Analysis Throughout the day
Prompt Month Statistics – Previous 5 Trading Afternoon (usually after 4:00p)
Days
U.S. Gulf Coast LNG Netback Prices (12-Month Afternoon (usually after 4:00p)
Strip)
Spot Month Sabine Pass Export Landed Price Afternoon (usually after 4:00p)
Arbitrage Continuation Chart
Other North America LNG Netback Prices Afternoon (usually after 4:00p)
U.S. LNG Export Tracker Morning (usually by 10:00a)
NGI’s Daily Henry Hub Spot Index vs. Prompt Morning (usually by 10:00a)
(CME) Futures Contract
Fearnleys LNG Freight Costs & Spot LNG Vessel Morning (usually by 10:00a)
Rates
West of Suez LNG Vessel Rate Curve Afternoon (usually after 4:00p)
Prompt Month Global LNG & NatGas Futures Afternoon (usually after 4:00p)
Prices
Estimated Sabine Pass / Asia 12-Month Forward Afternoon (usually after 4:00p)
LNG Arbitrage Curves
Daily Prompt Oil Linked Asia Parity Prices Afternoon (usually after 4:00p)
Europe & Asia Weather Data Afternoon (usually after 4:00p)
21Chart/Table Update Time (U.S. Eastern Time)
U.S. Landed vs European Prices Afternoon (usually after 4:00p)
Spanish PVB vs. Dutch TTF Futures Afternoon (usually after 4:00p)
Estimated Sabine Pass / Gate 12-Month Forward Afternoon (usually after 4:00p)
LNG Arbitrage Curves
European Spark/Dark Spreads Afternoon (usually after 4:00p)
European & Ukraine Gas Storage Morning (usually by 10:00a)
European LNG Regas Terminal Storage Morning (usually by 10:00a)
Latin America DES Prices Afternoon (usually after 4:00p)
Disclaimers, Limitation of Warranty & Liability
The Information contained in this newsletter (our Content) is intended as a professional reference tool.
You are responsible for using professional judgment and for confirming and interpreting the data
reported in our Content before using or relying on such information. OUR CONTENT IS PROVIDED "AS IS"
AND WE DISCLAIM ALL WARRANTIES, EXPRESS OR IMPLIED, INCLUDING THE IMPLIED WARRANTIES OF
MERCHANTABILITY AND FITNESS FOR YOUR PARTICULAR PURPOSE. Although we believe our Content to
be complete and accurate as described therein, we make no representations regarding completeness or
accuracy. We will not be liable for any damage or loss of any kind arising out of or resulting from access
or lack of access to or use of our Content, including but not limited to your reliance on it, errors in the
data it contains, and data loss or corruption, regardless of whether such liability is based in tort, contract
or otherwise. NGI’s full Subscriber Agreement is available here: naturalgasintel.com/TOC
For more information, please contact us at
lng@naturalgasintel.com
22You can also read


