A Conundrum - Bloomberg LP
←
→
Page content transcription
If your browser does not render page correctly, please read the page content below
Bloomberg Commodity Outlook – January 2020 Edition

                                                                               Bloomberg Terminal
Bloomberg Commodity Index (BCOM)

                                                                               Indices
              A Conundrum
      ‒      Mighty U.S. Energy, Dollar Not Necessarily Good for Commodities
      ‒      Crude Oil Price Resistance More Formidable Than Support in 2020
      ‒      Headwinds Remain Strong for Copper, Industrial Metals in 2020
      ‒      Gold, Precious Metals Will Need a Good Reason to Stop Advancing
      ‒      Corn to Sugar: Agriculture Prices on Sound Footings for 2020s

 CONTENTS
 02 Broad Market Outlook
 03 Energy
 05 Metals
 08 Agriculture

 DATA
 11 Performance
 15       Curve Analysis
 18       Market Flows
 21       Performance
                                                                   1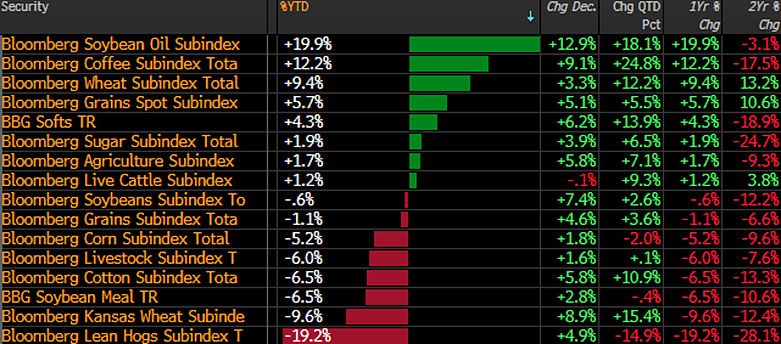
Bloomberg Commodity Outlook – January 2020 Edition
Bloomberg Commodity Index (BCOM)

Data and outlook as of December 31, 2019
                                                                                Learn more about Bloomberg Indices
Mike McGlone – BI Senior Commodity Strategist
BI COMD (the commodity dashboard)
                                                                         Note ‐ Click on graphics to get to the Bloomberg terminal

Mighty U.S. Energy, Dollar Not Necessarily Good
for Commodities                                                       Commodity Recovery Prerequisite: Peak Greenback
Performance: Dec. +5.0%, 2019 +7.7%, Spot +10.4%.
(Returns are total return (TR) unless noted)
(Bloomberg Intelligence) -- Rapidly increasing U.S. energy
exports and a strong dollar will limit broad commodity price
gains in 2020, in our view. Commodities historically have
needed a declining greenback for a sustained recovery, yet
the record-setting stock market and dollar have been close
companions, an unfavorable commodity conundrum.
Following such an extended equity-market advance, some
mean reversion is a primary risk to the more economic-
sensitive commodities -- crude oil and copper. A definitive
U.S.-China trade deal would primarily support the grains, but
less so if the strong dollar keeps corn, soybeans and wheat
relatively expensive vs. non-U.S. exports.

Most scenarios favor gold continuing to advance. In the
bigger picture, decarbonization and rapidly advancing                 MACRO PERFORMANCE
technology shine on increasing industrial-metal prices.
                                                                      The Crude-Oil Rubber Band Is Stretched. Prominent on our
                                                                      macroeconomic performers' dashboard in 2019, crude oil is
Commodities Vs. the Dollar                                            at elevated risk of mean reversion, in our view. When the
                                                                      history of 2020 is written, commodities and equities will not
Peak Dollar, Higher Copper Fuel 2020 Bull in Broad                    have had the benefit of starting the year at depressed levels,
Commodities. To get over the halfway hump of the 2010s                as they did a year ago. More organic demand-pull forces are
bear market, broad commodities need a weaker dollar and               required to offset the oversupplied energy market, which we
stronger prices in copper and crude oil, if history is a guide.       view as unlikely as OPEC sustaining production cuts. The
Our outlook for the 2020s favors the red metal vs.                    dollar will need to decline for enduring broad commodity-
oversupplied crude. Gold and precious metals appear to be             price appreciation.
resuming bull markets, while green shoots of recovery are
strengthening in agriculture.                                         Gold Set to Gain on Crude Oil in 2020

Commodities Need Lower Dollar, Higher Copper. Broad
commodity prices face greater headwinds at the onset of
2020 than in 2019, in our view. WTI crude oil is relatively
high, at more than $60 a barrel vs. about $40 a year ago. If
history is a guide, a peak greenback is necessary for
commodities to advance. At about 0.90, copper was the
commodity with the greatest annual correlation to the
Bloomberg Commodity Index in the 2010s. Crude oil, the
usual primary companion to the broad commodity market,
was closer to 0.80.
Emphasizing the increasing significance of the dollar, key            We view mean-reversion potential in the record-high U.S.
partners in copper's roughly 15% decline in the past 10 years         stock market as a primary risk to broad commodity prices in
were an increase of 30% in the trade-weighted broad dollar            2020. Gold should continue to outperform copper, with
and a decline in the value of the Chilean peso. The peso is           related macroeconomic implications and the copper-to-gold
over .90 correlated to copper, and Chile is the world's               ratio's strong companionship with bond yields.
largest producer and exporter.

                                                                  2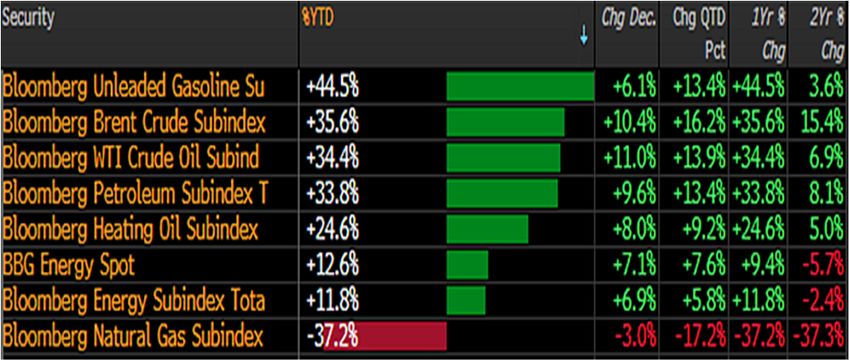
Bloomberg Commodity Outlook – January 2020 Edition
Bloomberg Commodity Index (BCOM)

SECTOR PERFORMANCE
                                                                       Energy
All That Glitters Is Not Gold for Commodities. Gold and                (Index weight: 29% of BCOM)
the precious metals leading commodity-sector performers in             Performance: Dec.+6.9%, 2020 +11.8%, Spot +11.6%
2019 isn't a good sign for organic demand-pull forces driving          *Note index weights are the 2018 average.
broad commodities higher, in our view. The fact that the
dollar and U.S. stock market are ending the 2010s near                 Energy 2020's Like 2010's
record highs tilts our bias toward acceleration of the more
nascent gold-price advance in the 2020s. Primary support for           Crude Oil Price Resistance More Formidable Than
precious metals is the low likelihood that rallying equity             Support in 2020. Vulnerable is our watchword for crude oil
prices and the greenback will maintain velocity in the coming          prices at the onset of the new year. Ending 2019 near the top
year and decade.                                                       quartile of the five-year range vs. the bottom half at the
                                                                       conclusion of 2018 portends a shift to headwinds from
Gold, Precious Metals Appear as Nascent Bulls                          tailwinds. We see little to reverse the predominant trend of
                                                                       the 2010s: rapidly increasing non-OPEC supply.

                                                                       The Crude Oil 2010s Trend Appears Enduring. Crude oil
                                                                       will remain on the unfavorable side of the battle between
                                                                       oversupply and prices in 2020, but less so than the past
                                                                       decade in our view. A primary headwind for the new year --
                                                                       ending 2019 a bit elevated vs. its recent range -- is the
                                                                       opposite of the tailwind at the end of 2018. Our graphic
                                                                       depicts the key driver of West Texas Intermediate prices in
                                                                       the past decade, declining U.S. liquid fuel net imports,
                                                                       expected to stabilize next year. A similar pause in plunging
Industrial metals should be middle-of-the-road performers,             imports in 2015-16 coincided with the trough in prices.
notably when the dollar begins to decline. Highly subject to           What Will It Take to Rally Crude Oil in 2020s?
U.S. grain exports, agriculture is on the cusp of a bull market,
also contingent on a peak greenback. The dollar should stop
advancing when the U.S. stock market stops outperforming
the world.

                                                                       The primary question for the new decade is whether the
                                                                       price-adjustment process to global supply exceeding
                                                                       demand is near its nadir. Expecting an abrupt reversal in
                                                                       such an entrenched trend is less likely than staying the
                                                                       course or accelerating, which tilts our crude-oil price bias to
                                                                       the downside.

                                                                       Higher-Plateau Risks Elevated for Crude Oil. A sustained
                                                                       pullback in the stock market would be a primary risk to
                                                                       crude-oil prices next year. For about the past five years, West
                                                                       Texas Intermediate has had a greater propensity to follow
                                                                       declining yields, but when equities correct, crude oil goes
                                                                       down a lot easier. In 2018 when the S&P 500 declined almost
                                                                       20%, WTI simultaneously dropped over 40%. A less than 15%
                                                                       stock-market retreat during the 2015-16 transition coincided
                                                                       with an almost 50% decline in oil.

                                                                   3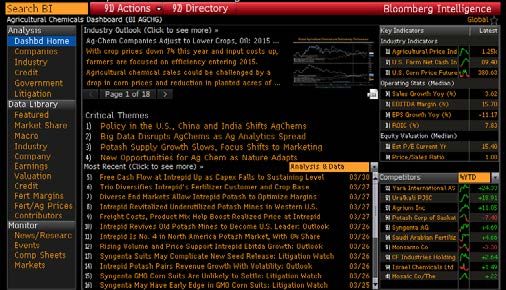
Bloomberg Commodity Outlook – January 2020 Edition
Bloomberg Commodity Index (BCOM)

Rising Stock Market Failing to Lift Crude Oil                         100-week moving average and prices sustaining below the
                                                                      10-year mean of about $3.31.
                                                                      Natural Gas Prices Likely to Remain Under Pressure

Our graphic depicts the crude oil 200-day moving average
tracking more closely with yields and the ease at which oil
prices decline with minor blips in appreciating stock-market
prices.
                                                                      Showing comfort above the 10-year most-traded price (the
Crude-Oil Resistance Appears Formidable. Predominant                  mode) of about $2.80, which is also about the 100-week
trends in crude oil from the past decade are more likely to           mean, would be an initial sign of potential recovery.
prevail in the next, keeping prices under pressure, in our
view. West Texas Intermediate is more likely to consolidate at        Short-Covering Spike Alert in Natural Gas. Natural gas
the lower end of its 10-year range than recover. Our graphic          should need some short cleansing before prices can decline
depicts crude facing a wall of resistance near its mean and           further, if history is a guide. Our graphic depicts hedge fund
median of about $72 a barrel, which marked the peak of the            positions in U.S. gas net-short about 19% of open interest --
recovery. The 100-week moving average is essentially flat,            the greatest since the record near 22% in 2015. The previous
providing little directional bias except to show comfort at           short extreme from mid-August coincided with an almost
lower levels. Revisiting the 10-year mode just below $50              20% price spike in the February future to the September
appears more likely than sustaining above $72, particularly if        high. Once cleansed of excessive shorts, prices resumed the
the stock market reverts a bit toward its mean.                       decline. Nearing good support of about $2 per million British
Stuck Lower - Crude Oil's Past Decade                                 thermal units (MMBtu), we see limited downside in natural
                                                                      gas until shorts are reduced.

                                                                      No Fear of Big Freeze Here - Elevated Gas Shorts

Rapidly advancing technology, demographic shifts and
decarbonization should keep the crude-oil demand vs.
supply balance unfavorable for prices.

The Trend Not a Friend for Natural-Gas Prices. Natural gas            Entering the peak of the heating season elevates volatility
is straightforward: Significant shifts are necessary to reverse       risks. Such emboldened shorts also indicate the extent of
the downtrend in prices, in our view. The greater likelihood is       what is likely to be more enduring bearish sentiment.
sustaining or accelerating the trends of the past decade. U.S.
prices appear more likely to breach support of $2 per million
British thermal units (MMBtu) than sustain above $3
resistance. Our graphic depicts the clear downtrend in the

                                                                  4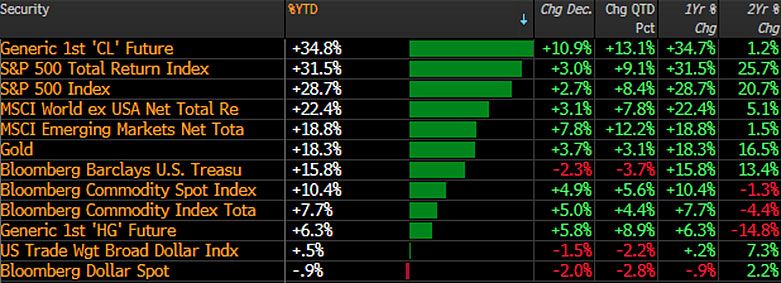
Bloomberg Commodity Outlook – January 2020 Edition
Bloomberg Commodity Index (BCOM)
PERFORMANCE DRIVERS
Crude in 2020 May Follow 2019 Natural Gas. Crude-oil Metals
and other petroleum prices are in a less-favorable position at All (Index weight: 35% of BCOM)
the onset of 2020 than they were in 2019. The poor Performance: Dec.+4.1%, 2020 +12.5%
performance of natural gas since the 4Q18 spike is indicative
of what to expect in a market dominated by U.S. oversupply, Industrial (Index weight: 19.0% of BCOM.
when prices visit the upper end of the range. Nearing the top Performance: Dec.+3.1%, 2020 +7.0%, Spot +5.4%
quartile of the last five years of trading, crude appears Precious (Index weight: 16.1% of BCOM.
vulnerable. Performance: Dec.+3.9%, 2020 +17.0%, Spot +18.0%
2020 Trading Places Risk: Crude Oil - Natural Gas
Industrial Metals - Headwinds
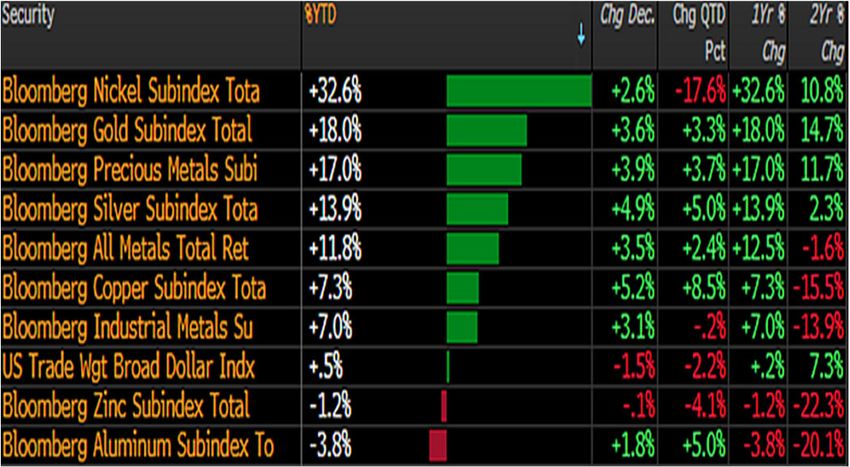
Headwinds Remain Strong for Copper, Industrial Metals
in 2020. Base metal prices are more likely to decline in 2020
than sustain gains from 4Q19, in our view. Compared with a
year ago, Dr. Copper's economic-outlook pendulum may
have swung too far toward optimism vs. the pessimism seen
at the onset of 2019. Sustaining the record-setting U.S.
equities run appears to be a prerequisite for recovering base
metals.
Ending 2018 near $40 a barrel in WTI was a primary reason
for the 2019 rally. The 2020 year will require more organic
Industrial Metals Running Into Resistance. The primary risk
demand vs. supply forces to boost crude oil prices. Crude
for industrial metals in 2020 is some mean reversion in
just above $60 at the end of 2019 emphasizes the narrowing
elevated stock-market prices, in our view. In 2019, base
price cage in a market that has been essentially adjusting
metals barely budged from 4Q18 levels since leading the
lower since the peak near $145 in 2008. Mean-reversion
global receding tide, despite sharp recoveries in equities.
potential in the U.S. stock market is a primary crude oil risk.
Our graphic depicts the mixed signals from top companions
of the Bloomberg Industrial Metals Spot Subindex in the
Front Energy Futures to December 31 2010s -- the MSCI Emerging Markets Index and Chilean peso.
About 0.90 correlated the past 10 years, the 16% EM advance
in 2019 to Dec. 30 appears to be pulling base metals along.
Depressed global purchasing-manager indexes need
sustained recoveries for similar in copper and industrial
metals, if history is a guide.
U.S.-China Trade Baby Steps May Not Boost Copper
Metals typically perform poorly when the dollar is
strengthening. The Chilean peso needs to recover to add
some metals-price tailwinds.
5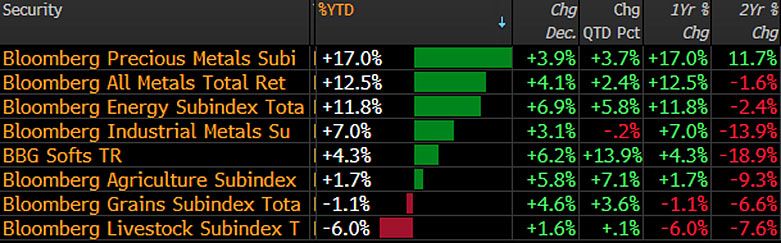
Bloomberg Commodity Outlook – January 2020 Edition
Bloomberg Commodity Index (BCOM)

Copper $3 Resistance Solid vs. $2.50 Support. The                    Copper Stocks Appear to Follow Prices
majority of typically robust copper price companions are
tilting toward lower prices. Our graphic depicts only the
MSCI Emerging Markets Index pointing higher. Among the
datasets with 10-year annual correlations greater than 0.70 to
copper, China's manufacturing Purchasing Managers Index
(PMI) leads at above 0.90. PMI is consistent with U.S.
Treasury bond yields and the Chilean peso at the bottom of
its past-decade range, implying similar for copper prices. On
a 10-year autoscale basis, crude oil and copper appear in
relative harmony.
Many Copper Price Companions Are Unfavorable

                                                                     The annual copper-price correlation to our measure of
                                                                     global stocks is about 0.32 since 2005. The metal's
                                                                     relationship to the MSCI Emerging Markets Index and to
                                                                     China's manufacturing PMI is 0.90; minus 0.87 to the Chilean
                                                                     peso; 0.75 to U.S. bond yields; and 0.80 to crude oil.

                                                                     PERFORMANCE DRIVERS

                                                                     Gold's Upward Trajectory vs. Copper. Sustaining the 4Q
                                                                     jump in copper prices is less likely than what we expect to be
                                                                     a more enduring recovery in gold. Global economic
Expecting a sharp reversal in copper demand vs. supply and
                                                                     demand-pull forces would have to abruptly reverse the
these price partners, potentially on the back of a definitive
                                                                     moribund trend of the past few years to advance base metals
U.S.-China trade agreement, seems unlikely. The 2019 high
                                                                     in 2020. What's more probable is muddling along with some
of about $3 a pound should be more formidable resistance
                                                                     lessening of trade tensions. This year's rabbit -- nickel -- may
than support near the $2.50 low.
                                                                     have sufficiently corrected (almost 30% from the 2019 peak)
Copper Inventories Can Be Contrary Indicator. If global              to refresh the bull trend and should be a leading indicator in
copper inventories are bottoming, prices may follow in 2021,         the new year for advancing industrial metals. The greater
if recent history is a guide. The most recent example of a           potential for nickel in 2020 is a range-bound market, in our
similar potential low in stocks was at the beginning of 2015,        view.
when prices didn't reach a trough until 2H16. The situation
                                                                     Industrial vs. Precious Nuances Favor Metals
was similar in the topping process. Copper prices peaked in
July 2018 and the turn lower in global inventories followed
about three months later. Our graphic depicts global copper
stocks and prices measured by 200-day moving averages to
emphasize a focus on the trends.

                                                                     As a broad sector, metals should continue outperforming
                                                                     most commodities, on the back of rapidly advancing
                                                                     technology, decarbonization and minimal storage costs.

                                                                 6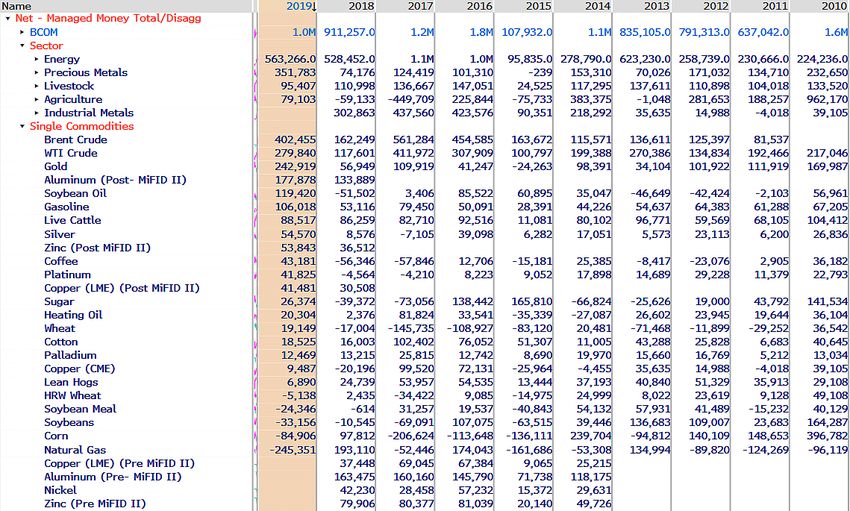
Bloomberg Commodity Outlook – January 2020 Edition
Bloomberg Commodity Index (BCOM)

Precious - Gaining Traction                                              Copper Advance Has Plenty of Resistance

Gold, Precious Metals Will Need a Good Reason to Stop
Advancing. Some combination of sustained dollar strength
and lower stock-market volatility should be needed to hold
back recovering gold prices, which elevates the metal's
inverse sensitivity to equity prices, in our view. Since the first
Federal Reserve interest-rate hike in December 2015, gold
has been anticipating a favorable end-game.

Gold's Divergent Strength vs. Volatility, Dollar. A low
chance of sustained dollar strength and minimal stock-
market volatility tilts our gold-price outlook favorably. Ending
the past decade near the midpoint of its 10-year range sets
the metal ahead of most commodities, which remain mired in
bear markets. The possibility of a failed surge may be
                                                                         Since 1999, the annual correlation of copper to the dollar is
elevated in gold, as depicted in our graphic, but the
                                                                         about minus 0.70, vs. gold's negative-0.65 relationship to the
underlying foundation for price appreciation is primarily from
                                                                         currency.
mean-reversion risks in the record high dollar and historically
low CBOE S&P 500 Volatility Index (VIX). Dollar-                         Gold Inverse Correlation vs. Equities Set to Gain. A
denominated gold following the euro-based metal to new                   primary component for more gold-price gains in 2020 and
highs should be a matter of time.                                        the coming decade is higher stock-market volatility. Our
                                                                         graphic depicts the moribund status of the metal vs. the U.S.
Recovering Gold vs. Strong Dollar, Weak Volatility
                                                                         stock market, coincident with the CBOE S&P 500 Volatility
                                                                         Index (VIX) stuck in the lower quartile of its range. In the next
                                                                         year and decade, it's unlikely stock-market volatility can
                                                                         sustain such depressed levels, which favor appreciating gold.
                                                                         Lower Equity Volatility Needed to Keep Gold Down

About $1,400 an ounce, which held resistance for five years,
is good initial support at the start of the 2020s. The 2013
peak of about $1,700 is initial resistance.

Gold Bull Gaining Traction; Copper Reluctant. Gold is
embarking on a new bull market, but copper has to show                   The unlikeliness of the record-high greenback to keep
something other than an enduring downtrend, in our view.                 appreciating with similar velocity as it has since 2014 is an
The dollar-denominated precious metal is ending 2019 at the              additional tailwind for gold prices. A primary companion of
best level in six years and has made new highs in other                  the advancing dollar -- the record setting U.S. stock market --
currencies, notably the euro. Our graphic depicts copper                 completes the link that should make gold increasingly
mired below the 2017-18 peak. Gold pulling copper higher                 negatively correlated to equity prices.
isn't a good macroeconomic indication. The record high
trade-weighted broad dollar is a primary metals headwind. A              Stocks Are Driving the Fed and Gold. There's a lot riding
peak greenback is a prerequisite for a recovery in copper                on the U.S. stock market extending its record run, but for
prices, if history is a guide.                                           gold the relationship will be increasingly inverse, in our view.
                                                                         In 2018, it was the first 20% correction in the S&P 500 since
                                                                         the financial crisis that helped break gold out of its narrow
                                                                         cage in 2019 above $1,400 an ounce. The breach of this
                                                                         resistance, which held for about five years, came on the back

                                                                     7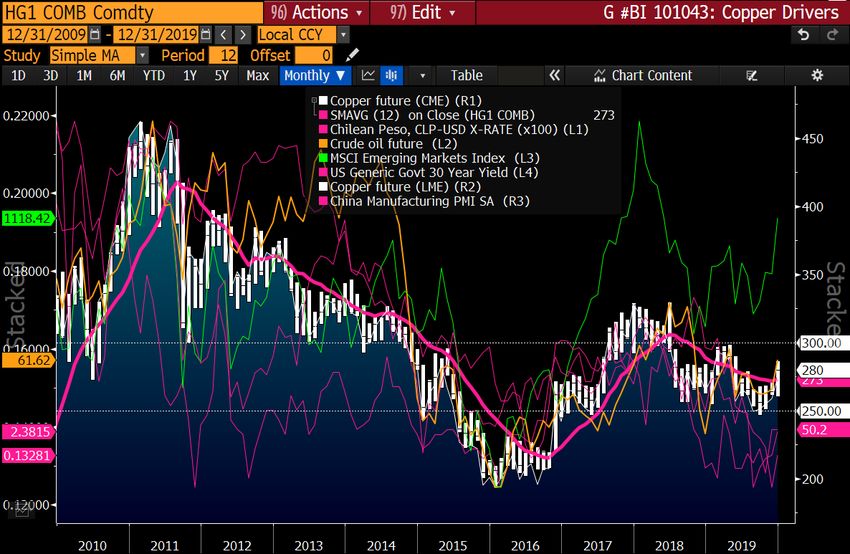
Bloomberg Commodity Outlook – January 2020 Edition
Bloomberg Commodity Index (BCOM)

of Fed easing. If history is a guide, lower equity prices are a
primary catalyst for more Fed rate cuts, another tailwind for
                                                                       Agriculture
gold.                                                                  (Index weight: 30% of BCOM)
                                                                       Performance: Dec.+5.8%, 2020 +1.7%, Spot +8.8%
Fed Easing Sparked Gold Above $1,400
                                                                       Grains (Index Weight: 24% of BCOM)
                                                                       Performance: Dec.+4.6%, 2020 -1.1%, Spot +5.7%

                                                                       Softs (Weight: 6% of BCOM)
                                                                       Performance: Dec.+6.2%, 2020 +4.3%, Spot +14.0%

                                                                       Green Shoots

                                                                       Corn to Sugar: Agriculture Prices on Sound Footings for
                                                                       2020s. Green shoots at the end of the 2010s support
                                                                       agriculture-price appreciation in the decade ahead, in our
                                                                       view. The period of sustained low prices is akin to the onset
                                                                       of the 2000s, when the ags advanced as the dollar
                                                                       depreciated. A peak greenback is a primary prerequisite to
Downside risks for the metal may be less severe if the punch           boost U.S. grain exports and agriculture prices.
bowl is taken away, the old adage for rate hikes. The
willingness of the Fed to cut rates with unemployment                  Agriculture Set to Bottom When Dollar PeaksReturn to
historically low may signal tolerance of inflation, a typical          Top. An increase in U.S. grain exports will support
companion for advancing gold prices.                                   agriculture prices, but a peak greenback is required for a
                                                                       sector bottom, if history is a guide. Ags are showing
Coming Decade Set to Shine on Gold vs. Stocks. The gold-               divergent strength vs. the dollar. Our graphic depicts the
to-S&P 500 relationship should be more inverse in the                  Bloomberg Agriculture Spot Index ending the decade at
2020s, similar the 2000s, in our view. Our graphic depicts             about the same level as in 2014, just as the dollar started its
the most stable, near-zero correlation since 1971, when                big bull run. In the 2010s, our gauge of the dollar value of
President Richard Nixon unlinked the dollar and gold. A                U.S. grain exports is tops among correlation measures vs. the
mirror opposite of the peak in the 10-year correlation just            ag index at about 0.93, measured annually. The trade-
above 0.40 in 2012 is likely in the coming decade, if history is       weighted broad dollar leads negative correlations at about
a guide. Gold typically performs best when the stock market            0.60.
peaks and is moribund for a period.
                                                                       Ags' Divergent Strength vs. the Greenback
Gold Correlation to Equities Set For Negative

The quasi-currency began its historic 12-year run higher in            Dominated by U.S.-traded grain futures, agriculture prices
2001 as the internet bubble burst. In the 1970s and 1980s,             peaked in 2011 as the dollar bottomed. At all-time highs,
gold's upward trajectory was similar vs. the weak stock                greenback mean-reversion risk vs. limited further upside is a
market. On a 50-year annual basis, the metal is minus 0.25             price tailwind.
correlated to the S&P 500 Index. Since 1999, the relationship
has been closer to zero.

                                                                   8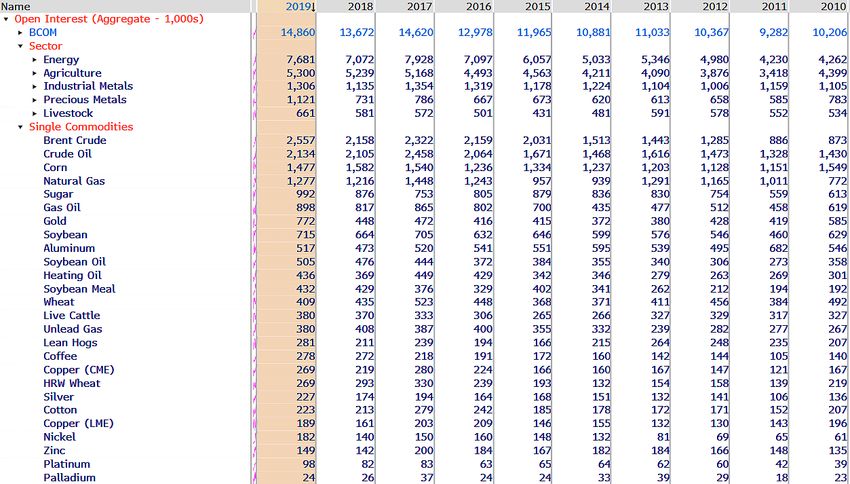
Bloomberg Commodity Outlook – January 2020 Edition
Bloomberg Commodity Index (BCOM)

Corn Eyes Recovery From Sustained Low Prices. Mean-                 Wheat Price Recovery Is Gaining Legs
reversion potential favors higher corn prices in the coming
decade, in our view. At a steep discount to its 10-year
median, the grain appears in the early days of following the
old axiom that low prices are the cure for low prices. Our
graphic depicts corn's 100-week moving average beginning
to turn higher following prolonged consolidation at
depressed levels. Ending the decade near the elevated apex
of its bell curve of traded prices from the past 10 years --
about $3.70 a bushel -- the extreme distance to get to its
halfway mark of about $5.70 tilts our price bias upward.
Corn Price Mean Reversion Risks Point Higher

                                                                    Soybean Recovery Likely Needs to Ripen More. Soybeans
                                                                    have more work to do -- notably vs. corn -- for a sustainable
                                                                    price recovery, in our view. If past performance and the 100-
                                                                    week moving average are guides, the oilseed's trend and
                                                                    path of least resistance remain down. Our graphic depicts
                                                                    the moribund soybean-price condition since the peak in
                                                                    2012. The deep discount of the Dec. 13 price about $9.20 a
                                                                    bushel, vs. the halfway mark to the 2019 low and 10-year
                                                                    average of $11.22, nudge mean-reversion potential to the
                                                                    upside. Typically highly correlated, corn and wheat should
                                                                    provide guidance for beans.
Typically such tightly coiled markets spring higher,
particularly when they're at or below cost of production. The
                                                                    Trend Is Down, Mean-Reversion Risks Elevated
10-year average price about $4.65, which held resistance in
2019, is set to become support.

Wheat Set to Lead 2020s Grain Recovery. Wheat is the
most likely among the grains to retrace its bear market from
most of the past decade, in our view. Prices bottomed in
2016 and are on a clear recovery trajectory. Our graphic
depicts the upward sloping 100-week average and the wheat
price on the cusp of breaching resistance at its 10-year
average of $5.68 a bushel. Appearing similar to gold, until
the metal's breakout higher this year, an extended
consolidation period is solidifying a foundation for the
wheat-price recovery. The most traded price area of the past
decade, which is also about the 100-week mean at just below
$5 a bushel, is good support.

                                                                9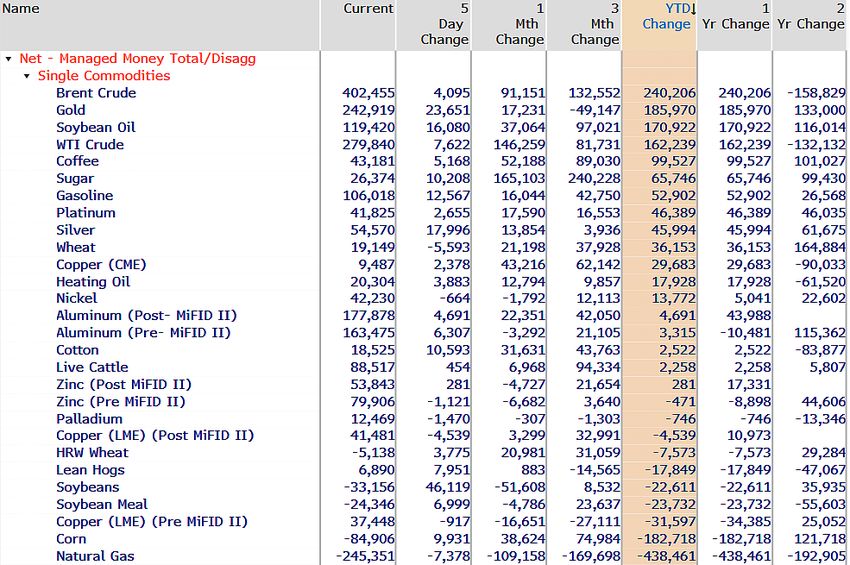
Bloomberg Commodity Outlook – January 2020 Edition
Bloomberg Commodity Index (BCOM)

PERFORMANCE DRIVERS
Grain Gains Set to Lead Agriculture in 2020. The biggest
annual gain for grain prices since the 2012 peak is the start of
a more enduring agriculture-sector recovery, in our view. For
the second year, the Bloomberg Grains Spot Subindex is up
about 5%. Led by soybean oil, with rallying palm oil and
strong wheat, a thaw in U.S.-China trade tension is price
supportive, but the underpinnings are broader. Grains'
stocks-to-use measures appear to be peaking from
multidecade highs, with sustained low prices becoming the
cure, according to the old adage.

2019 Is Second Year For Recovering Grain Prices

A key to reversing the ags' price decline is ending the retreat
in the Brazilian real. Down about 4% vs. the dollar in 2019,
primary related commodities -- soybeans, sugar and coffee --
are showing divergent strength to that nation's currency.

                                                                   10
Bloomberg Commodity Outlook – January 2020 Edition
Bloomberg Commodity Index (BCOM)
DATA on BI COMD
Performance - Overview
Key Metrics
Historical Performance may vary from above due to delayed end date
11Bloomberg Commodity Outlook – January 2020 Edition
Bloomberg Commodity Index (BCOM)
Performance – Commodity Total Returns
Key Metrics
Historical
12Bloomberg Commodity Outlook – January 2020 Edition
Bloomberg Commodity Index (BCOM)
Performance – Prices
Key Metrics
Historical
13Bloomberg Commodity Outlook – January 2020 Edition
Bloomberg Commodity Index (BCOM)
Performance - Volatility
Key Metrics
14Bloomberg Commodity Outlook – January 2020 Edition
Bloomberg Commodity Index (BCOM)
Curve Analysis – Contango (-) | Backwardation (+)
Key Metrics
Measured via the one-year futures spread as a percent of the first contract price. Negative means the one-year out future is higher (contango). Positive
means the one-year out future is lower (backwardation.
Historical
15Bloomberg Commodity Outlook – January 2020 Edition
Bloomberg Commodity Index (BCOM)
Curve Analysis – Gross Roll Yield
Key Metrics
Historical
16Bloomberg Commodity Outlook – January 2020 Edition
Bloomberg Commodity Index (BCOM)
Curve Analysis – Forwards / Forecasts
Spread %
Data Set
17Bloomberg Commodity Outlook – January 2020 Edition
Bloomberg Commodity Index (BCOM)
Market Flows – Open Interest
Key Metrics
Historical
18Bloomberg Commodity Outlook – January 2020 Edition
Bloomberg Commodity Index (BCOM)
Market Flows – Commitment of Traders
Key Metrics
Historical
19Bloomberg Commodity Outlook – January 2020 Edition
Bloomberg Commodity Index (BCOM)
Market Flows – ETF Flows (annual)
20PERFORMANCE: Bloomberg Commodity Indices
Composite Indices * Click hyperlinks to open in Bloomberg
2019
Index Name Ticker
Dec YTD 1-Year 3-Year 5-Year 10-Year 20-Year 30-Year 40-Year 50-Year
Bloomberg Commodity ER BCOM 4.90% 5.44% 5.44% -7.57% -22.47% -41.89% -12.34% -13.16% -41.17% 408.21%
Bloomberg Commodity TR BCOMTR 5.04% 7.69% 7.69% -2.79% -18.14% -38.41% 22.64% 99.57% 234.96% 5418.44%
Bloomberg Commodity Spot BCOMSP 4.90% 10.37% 10.37% 6.20% 6.72% -2.57% 223.49% 265.00% 217.44% 1912.59%
Bloomberg Roll Select BCOMRST 5.06% 6.09% 6.09% -2.89% -14.84% -28.66% 157.66%
1 Month Forward BCOMF1T 5.17% 8.18% 8.18% -0.69% -14.45% -30.78% 111.83%
2 Month Forward BCOMF2T 5.36% 7.84% 7.84% 2.79% -11.17% -28.74% 156.43%
3 Month Forward BCOMF3T 5.32% 8.42% 8.42% 2.44% -10.90% -26.33% 167.15%
4 Month Forward BCOMF4T 5.31% 8.11% 8.11% 2.90% -7.50% -20.52%
5 Month Forward BCOMF5T 5.28% 8.93% 8.93% 4.61% -5.87% -19.57%
6 Month Forward BCOMF6T 5.15% 8.14% 8.14% 4.54% -5.22% -18.27%
Energy BCOMENTR 6.89% 11.78% 11.78% -6.63% -33.64% -71.15% -51.24% 5.13%
Petroleum BCOMPETR 9.57% 33.76% 33.76% 18.41% -15.93% -45.68% 70.28%
Agriculture BCOMAGTR 5.75% 1.72% 1.72% -19.28% -30.45% -33.25% -21.31% -13.89% 16.26% 1473.03%
Grains BCOMGRTR 4.63% -1.12% -1.12% -17.12% -37.15% -37.58% -32.63% -43.47% -31.22% 415.75%
Industrial Metals BCOMINTR 3.06% 6.98% 6.98% 11.42% -2.30% -30.31% 97.03%
Precious Metals BCOMPRTR 3.88% 17.02% 17.02% 23.89% 20.13% 22.95% 321.43% 263.55% 83.36%
Softs BCOMSOTR 6.23% 4.26% 4.26% -30.94% -29.55% -43.79% -48.35% -25.03% 17.68% 2966.54%
Livestock BCOMLITR 1.55% -5.99% -5.99% -1.71% -24.72% -16.58% -50.52% -27.52%
Ex-Energy BCOMXETR 4.25% 6.01% 6.01% -0.54% -11.81% -18.69% 45.71%
Ex-Petroleum BCOMXPET 3.66% 1.09% 1.09% -8.64% -21.22% -39.99%
Ex-Natural Gas BCOMXNGT 5.58% 12.16% 12.16% 3.85% -10.79% -22.24%
Ex-Agriculture BCOMXAGT 4.75% 10.28% 10.28% 4.93% -13.30% -42.67%
Ex-Grains BCOMXGRT 5.12% 9.52% 9.52% 0.49% -13.97% -40.33%
Ex-Industrial Metals BCOMXIMT 5.46% 7.74% 7.74% -6.13% -21.58% -40.56%
Ex-Precious Metals BCOMXPMT 5.29% 5.88% 5.88% -7.17% -24.49% -46.24%
Ex-Softs BCOMXSOT 4.95% 7.90% 7.90% -0.55% -17.80% -38.77%
Ex-Livestock BCOMXLIT 5.27% 8.60% 8.60% -2.99% -17.85% -39.73%
Ex-Agriculture & Livestock BCOMXALT 5.05% 11.87% 11.87% 5.28% -12.49% -44.96%
Bloomberg Dollar Spot BBDXY -2.00% -0.93% -0.93% -6.51% 4.75% 19.28%
Bloomberg US Large Cap TR B500T 2.94% 31.76% 31.76% 53.84% 73.90% 256.90%
US Aggregate LBUSTRUU -0.07% 8.72% 8.72% 12.58% 16.20% 44.45% 166.22% 460.17% 1707.47%
US Treasury LUATTRUU -0.56% 6.86% 6.86% 10.27% 12.35% 36.11% 146.55% 406.58% 1497.43%
US Corporate LUACTRUU 0.32% 14.54% 14.54% 18.83% 25.23% 71.54% 223.74% 614.04% 2302.36%
US High Yield LF98TRUU 2.00% 14.32% 14.32% 20.34% 34.66% 107.47% 297.45% 999.80%
Single Commodity Indices
2019
Index Name Ticker
Dec YTD 1-Year 3-Year 5-Year 10-Year 20-Year 30-Year 40-Year 50-Year
Natural Gas BCOMNGTR -2.97% -37.24% -37.24% -60.11% -73.57% -95.81% -99.38%
Low Sulfer Gas Oil BCOMGOT 7.25% 23.99% 23.99% 31.15% 1.27% -21.24% 222.88%
WTI Crude BCOMCLTR 11.05% 34.44% 34.44% 12.38% -33.03% -63.18% 0.86% 167.23%
Brent Crude BCOMCOT 10.43% 35.57% 35.57% 31.81% -10.04% -29.19% 242.75%
ULS Diesel BCOMHOTR 7.96% 24.61% 24.61% 20.79% -7.86% -28.35% 147.48% 259.11%
Unleaded Gasoline BCOMRBTR 6.13% 44.49% 44.49% 6.54% -0.94% -7.62% 252.09% 727.36%
Corn BCOMCNTR 1.84% -5.21% -5.21% -20.48% -42.03% -44.88% -76.47% -84.00% -80.93% -34.40%
Soybeans BCOMSYTR 7.41% -0.57% -0.57% -19.35% -20.94% 15.55% 242.11% 246.86% 289.08% 3546.60%
Wheat BCOMWHTR 3.28% 9.36% 9.36% -0.94% -41.48% -66.12% -82.79% -90.23% -87.59% -22.12%
Soybean Oil BCOMBOTR 12.88% 19.90% 19.90% -9.92% -10.78% -43.75% 2.40% -8.20% -3.93% 2507.76%
Soybean Meal BCOMSMT 2.76% -6.52% -6.52% -14.89% -17.56% 87.57% 946.54%
HRW Wheat BCOMKWT 8.87% -9.58% -9.58% -25.44% -62.48% -69.45% -72.05%
Copper BCOMHGTR 5.24% 7.27% 7.27% 9.12% -5.45% -25.98% 254.25% 717.39%
Alumnium BCOMALTR 1.76% -3.78% -3.78% 4.87% -11.31% -46.01% -31.97%
Zinc BCOMZSTR -0.08% -1.17% -1.17% 0.82% 14.33% -20.98% 39.86%
Nickel BCOMNITR 2.58% 32.57% 32.57% 39.19% -10.70% -31.55% 183.42%
Gold BCOMGCTR 3.56% 18.03% 18.03% 29.38% 24.24% 30.38% 366.34% 260.37% 158.34%
Silver BCOMSITR 4.91% 13.87% 13.87% 8.19% 7.65% -4.99% 175.48% 182.16% -54.75%
Sugar BCOMSBTR 3.85% 1.92% 1.92% -43.78% -34.18% -65.41% 0.96% 14.53% -68.93% 151.87%
Coffee BCOMKCTR 9.09% 12.19% 12.19% -30.74% -53.22% -61.20% -91.24% -79.51% -72.58%
Cotton BCOMCTTR 5.79% -6.46% -6.46% -2.42% 11.07% 29.29% -63.13% -40.57% 149.24% 1135.46%
Live Cattle BCOMLCTR -0.08% 1.18% 1.18% 13.27% -10.13% 13.93% 4.21% 83.35% 704.76% 3670.55%
Lean Hogs BCOMLHTR 4.91% -19.18% -19.18% -26.04% -46.94% -53.80% -86.04% -87.49%
21PERFORMANCE: Bloomberg Commodity Roll Select Indices
Composite Roll Select Indices * Click hyperlinks to open in Bloomberg
2019
Index Name Ticker
Dec YTD 1-Year 3-Year 5-Year 10-Year 20-Year 30-Year 40-Year 50-Year
BCOM Roll Select BCOMRST 5.06% 6.09% 6.09% -2.89% -14.84% -28.66% 157.66%
Roll Select Agriculture BCOMRAGT 5.88% 0.85% 0.85% -16.77% -28.15% -23.89% 42.45%
Roll Select Ex-Ags & Livestock BBURXALT 5.00% 10.02% 10.02% 4.72% -6.87% -34.79%
Roll Select Grains BCOMRGRT 4.81% -1.93% -1.93% -13.83% -33.64% -30.20% 28.41%
Roll Select Softs BCOMRSOT 6.33% 2.04% 2.04% -32.99% -32.98% -33.82% -9.86%
Roll Select Livestock BCOMRLIT 1.81% -8.92% -8.92% -10.41% -37.48% -15.37% 33.89%
Roll Select Energy BCOMRENT 6.78% 8.50% 8.50% -6.63% -22.61% -58.77% 96.15%
Roll Select Ex-Energy BCOMRXET 4.33% 5.16% 5.16% -0.47% -11.95% -12.80% 139.89%
Roll Select Petroleum BCOMRPET 9.04% 28.33% 28.33% 17.12% -4.38% -27.85% 385.04%
Roll Select Industrial Metals BCOMRINT 3.04% 6.12% 6.12% 10.13% -2.80% -27.50% 185.10%
Roll Select Precious Metals BCOMRPRT 3.92% 17.16% 17.16% 24.10% 20.76% 24.22% 337.59%
Single Commodity Roll Select Indices
2019
Index Name Ticker
Dec YTD 1-Year 3-Year 5-Year 10-Year 20-Year 30-Year 40-Year 50-Year
Natural Gas RS BCOMRNGT -1.68% -36.46% -36.46% -56.03% -64.58% -91.44% -90.31%
Low Sulfer Gas Oil RS BCOMRGOT 7.07% 20.10% 20.10% 24.04% -0.68% -22.04% 257.39%
WTI Crude RS BCOMRCLT 9.59% 30.23% 30.23% 13.59% -9.75% -37.64% 356.38%
Brent Crude RS BCOMRCOT 10.43% 29.84% 29.84% 28.18% -4.26% -20.43% 441.09%
ULS Diesel RS BCOMRHOT 7.99% 21.78% 21.78% 11.11% -9.05% -31.41% 301.84%
Unleaded Gasoline RS BCOMRRBT 6.39% 33.62% 33.62% 13.47% 12.73% 9.03% 475.69%
Corn RS BCOMRCNT 2.90% -6.30% -6.30% -17.61% -38.33% -39.90% -56.28%
Soybeans RS BCOMRSYT 6.84% 1.43% 1.43% -8.78% -8.81% 42.60% 419.04%
Wheat RS BCOMRWHT 3.28% 4.91% 4.91% -8.00% -46.79% -64.77% -45.86%
Soybean Oil RS BCOMRBOT 12.86% 19.62% 19.62% -10.51% -10.17% -38.29% 47.78%
Soybean Meal RS BCOMRSMT 2.82% -5.36% -5.36% -3.90% -9.88% 115.68% 1391.06%
HRW Wheat RS BCOMRKWT 8.38% -14.20% -14.20% -27.41% -62.11% -67.27% -36.86%
Copper RS BCOMRHGT 5.22% 7.12% 7.12% 9.65% -5.41% -23.56% 394.78%
Alumnium RS BCOMRALT 1.66% -5.27% -5.27% 1.17% -12.49% -43.32% -2.52%
Zinc RS BCOMRZST -0.08% -3.00% -3.00% -2.08% 11.35% -18.76% 113.11%
Nickel RS BCOMRNIT 2.65% 32.21% 32.21% 39.23% -9.85% -27.95% 344.42%
Gold RS BCOMRGCT 3.65% 18.21% 18.21% 29.64% 25.03% 31.36% 371.70%
Silver RS BCOMRSIT 4.82% 13.87% 13.87% 8.31% 7.97% -3.01% 207.92%
Sugar RS BCOMRSBT 4.47% -1.04% -1.04% -48.34% -42.05% -59.54% 103.08%
Coffee RS BCOMRKCT 8.59% 9.49% 9.49% -32.02% -53.01% -57.18% -85.80%
Cotton RS BCOMRCTT 5.77% -6.37% -6.37% 1.84% 15.51% 58.57% -39.71%
Live Cattle RS BCOMRLCT 1.14% -4.05% -4.05% 4.73% -18.99% 10.59% 62.93%
Lean Hogs RS BCOMRLHT 2.84% -16.24% -16.24% -33.42% -60.24% -49.06% -20.89%
22BCOM Constituent Weights
BCOM Index MEMB * Click hyperlinks to open in Bloomberg
Dec 2019
Dec 2019 Contrib Dec 31 2019 Nov 29 2019 2020 Target
Group Commodity Ticker Weight%
to Return % Weight % Weight % Weight
Change
Natural Gas NG -0.19 5.81 6.44 (0.63) 7.96%
Low Sulfer Gas Oil QS 0.19 2.74 2.69 0.05 2.60%
WTI Crude CL 0.92 8.85 8.42 0.42 7.99%
Energy Brent Crude CO 0.77 7.84 7.46 0.38 7.01%
ULS Diesel HO 0.17 2.28 2.23 0.05 2.11%
Gasoline XB 0.16 2.68 2.62 0.05 2.26%
Subtotal 2.03 30.20 29.87 0.33 29.93%
Corn C 0.10 5.55 5.72 (0.17) 5.83%
Soybeans S 0.41 5.78 5.56 0.22 5.64%
Wheat W 0.10 3.15 3.20 (0.05) 3.04%
Grains Soybean Oil BO 0.41 3.51 3.24 0.27 2.90%
Soybean Meal SM 0.08 3.02 3.05 (0.03) 3.30%
HRW Wheat KW 0.09 1.16 1.12 0.04 1.49%
Subtotal 1.18 22.17 21.90 0.27 22.19%
Copper HG 0.37 7.20 7.19 0.01 6.96%
Aluminum LA 0.06 3.93 4.02 (0.09) 4.33%
Industrial
Zinc LX -0.01 2.70 2.85 (0.15) 3.43%
Metals
Nickel LN 0.08 3.17 3.23 (0.07) 2.75%
Subtotal 0.51 17.00 17.28 (0.28) 17.46%
Gold GC 0.46 13.41 13.61 (0.19) 13.62%
Precious
Silver SI 0.19 4.10 4.11 (0.01) 3.78%
Metals
Subtotal 0.65 17.52 17.72 (0.20) 17.40%
Sugar SB 0.12 3.10 3.13 (0.04) 3.01%
Coffee KC 0.26 2.90 2.79 0.11 2.71%
Softs
Cotton CT 0.07 1.25 1.24 0.01 1.49%
Subtotal 0.44 7.25 7.17 0.08 7.21%
Live Cattle LC -0.01 3.88 4.08 (0.20) 4.02%
Livestock Lean Hogs LH 0.09 1.98 1.98 (0.00) 1.78%
Subtotal 0.08 5.86 6.06 (0.20) 5.80%
Total 4.90 100.00 100.00 100.00%
23BLOOMBERG INTELLIGENCE: COMMODITY DASHBOARDS
BI * Click hyperlinks to open in Bloomberg
BI provides analysis on several key drivers of BCOM performance; industrial and precious metals mining, oil and natural gas production, and
agricultural chemicals. The dashboards include key macro data libraries and interactive charting and commentary from analysts with an average
of seventeen years of experience.
Crude Oil Production: BI OILS Natural Gas Production: BI NGAS
Precious Metal Mining: BI PMET Agricultural Chemicals: BI AGCH
Copper: BI COPP Aluminum: BI ALUM
24COMMODITY CHEAT SHEET FOR THE BLOOMBERG PROFESSIONAL® SERVICE
The data provided in this report can be easily accessed on the Bloomberg Professional® service along with numerous news
and analytical tools to help you stay on top of the commodity markets.
* Click hyperlinks to open in Bloomberg
Broad Commodities Energy
Top commodity news CTOP Top energy news ETOP
Global commodity prices GLCO Top oil news OTOP
Commodity playbook CPLY Crude Oil Production Dashboard BI OILS
Commitments of traders report COT First Word oil NI BFWOIL
Calendar of commodity events ECO17 News on oil inventories TNI OIL INV
Commodity arbitrage calculator CARC Oil Buyer's Guide newsletter NI OBGBRIEF
Commodity fundamental data explorer FDM Pipes & Wires newsletter NI PAWSBRIEF
Commodity futures overview CMBQ Oil market analysis BOIL
Security finder SECF Nat gas spot prices BGAS
Commodity data contributors & broker CDAT Forward European utility markets EUM
Contract table menu CTM News on oil markets NI OILMARKET
Seasonality chart SEAG News on OPEC NI OPEC
Commodity curve analysis CCRV OPEC production and prices OPEC
Commodity fair values CFVL Oil markets menu OIL
Commodity price forecasts CPFC Crude stored in tankers NOON
Commitments of Traders Report COT Refinery outages REFO
Commodity maps BMAP Oil’s decline EXT5
Commodity options monitor OMON Oil versus inflation expectations SWIF
Commodities charts COSY
Commodity Investors menu CMNV Metals
US exchange traded product fund flows ETF Top metal news METT
Precious metal dashboard BI PMETG
Base metals dashboard BI BMET
Commodity Indices Metals prices and data MINE
Index description BCOM Index DES Precious metals prices and rates MTL
Index constituent weights BCOM Index MEMB Metals Bulletin MB
Listed index futures BCOM Index CT COMEX inventories COMX
Option volatility surface BCOM Index OVDV LME monitor LME
Seasonality chart BCOMNG Index SEAG LME implied volatilities LMIV
Commodity index futures movers FMV LME warehouse inventories LMEI
Commodity index ranked returns CRR
Agriculture
Weather Top agriculture news YTOP
Global weather database WETR Agriculture calendar AGRI
US snow monitor SNOW Agriculture spot prices AGGP
EU weather & utility models EUMM Agriculture supply & demand AGSD
Crop calendar CCAL
BCOM QUICK FACTS Index Methodology
Weighting Bias 2/3 market liquidity and 1/3 world production
No. of Commodities 20
Re-balancing Frequency Annual
Roll Schedule Monthly (5 day roll)
Caps/Limits Single commodity: max 15%
Single commodity and its derivatives: max 25%
Related commodity groups: max 33%
First Value Date 30 December 1990
25The data included in these materials are for illustrative purposes only. The BLOOMBERG
TERMINAL service and Bloomberg data products (the “Services”) are owned and distributed by
Bloomberg Finance L.P. (“BFLP”) except (i) in Argentina, Australia and certain jurisdictions in
the Pacific islands, Bermuda, China, India, Japan, Korea and New Zealand, where Bloomberg
L.P. and its subsidiaries (“BLP”) distribute these products, and (ii) in Singapore and the
jurisdictions serviced by Bloomberg’s Singapore office, where a subsidiary of BFLP distributes
these products. BLP provides BFLP and its subsidiaries with global marketing and operational
support and service. Certain features, functions, products and services are available only to
sophisticated investors and only where permitted. BFLP, BLP and their affiliates do not
guarantee the accuracy of prices or other information in the Services. Nothing in the Services
shall constitute or be construed as an offering of financial instruments by BFLP, BLP or their
affiliates, or as investment advice or recommendations by BFLP, BLP or their affiliates of an
investment strategy or whether or not to “buy”, “sell” or “hold” an investment. Information
available via the Services should not be considered as information sufficient upon which to base
an investment decision. The following are trademarks and service marks of BFLP, a Delaware
limited partnership, or its subsidiaries: BLOOMBERG, BLOOMBERG ANYWHERE,
BLOOMBERG MARKETS, BLOOMBERG NEWS, BLOOMBERG PROFESSIONAL,
BLOOMBERG TERMINAL and BLOOMBERG.COM. Absence of any trademark or service
mark from this list does not waive Bloomberg’s intellectual property rights in that name, mark or
logo. All rights reserved. © 2020 Bloomberg.
Bloomberg Intelligence is a service provided by Bloomberg Finance L.P. and its affiliates.
Bloomberg Intelligence shall not constitute, nor be construed as, investment advice or investment
recommendations (i.e., recommendations as to whether or not to “buy”, “sell”, “hold”, or to enter
or not to enter into any other transaction involving any specific interest) or a recommendation as
to an investment or other strategy. No aspect of the Bloomberg Intelligence function is based on
the consideration of a customer's individual circumstances. Bloomberg Intelligence should not be
considered as information sufficient upon which to base an investment decision. You should
determine on your own whether you agree with Bloomberg Intelligence.
Bloomberg Intelligence Credit and Company research is offered only in certain jurisdictions.
Bloomberg Intelligence should not be construed as tax or accounting advice or as a service
designed to facilitate any Bloomberg Intelligence subscriber's compliance with its tax,
accounting, or other legal obligations. Employees involved in Bloomberg Intelligence may hold
positions in the securities analyzed or discussed on Bloomberg Intelligence.
26You can also read