Road Cycling TV Viewing Report 2019 - Prof. Dr. Daam Van Reeth KU Leuven, Faculty of Economics & Business Campus Brussels, Belgium mail: ...
←
→
Page content transcription
If your browser does not render page correctly, please read the page content below
Road Cycling TV Viewing Report 2019

Prof. Dr. Daam Van Reeth
KU Leuven, Faculty of Economics & Business
Campus Brussels, Belgium

mail: daam.vanreeth@kuleuven.be
twitter: @vrdaam
INTRODUCTION
•   This report presents an analysis of TV viewership for professional road cycling in 14 major TV markets
    (13 countries) for cycling: Australia, Belgium (Flanders / Wallonia), Denmark, France, Germany, Italy,
    the Netherlands, Norway, Spain, Sweden, Switzerland, the United Kingdom and the United States.
    This is the same number of countries as last year because, in spite of many efforts, we were unlucky
    to find sources or contact persons in new markets. Any help in this respect is very welcome.

•   The analysis is based on a self‐constructed dataset containing detailed TV viewership information for
    about 1900 broadcasts of cycling races in 2019 including over 70 broadcasts of women’s pro cycling
    races and approximately 400 Tour de France broadcasts. Our dataset contains about 200 observations
    more than in 2018.

•   Information for this report was mainly collected from public sources. For some markets though the
    inside help from journalists and media people was needed and highly appreciated. I want to explicitly
    thank all of them for their contribution.

•   For regular updates on TV audiences, follow my twitter‐account @vrdaam. If you have any questions,
    found some mistakes or if you would like to get in touch with me, send me a mail:
    daam.vanreeth@kuleuven.be.

•   The report contains 4 parts while the main findings are summarized on page 50:
    o   Tour de France TV report (pages 3‐16)
    o   Women’s pro cycling TV report (pages 17‐26)
    o   TV audience dashboards per country (pages 27‐46)
    o   Overview tables (pages 47‐49)
1. TOUR DE FRANCE TV REPORT
DATASET:

• TV viewing for the 2019 Tour de France was monitored for:
   o   12 countries (13 territories): Australia, Belgium (Flanders / Wallonia),
       Denmark, France, Germany, Italy, the Netherlands, Norway, Spain, Sweden,
       the United Kingdom and the United States.
   o   24 daily Tour de France broadcasts (19 race broadcasts and 5 Tour
       talkshows) on 18 TV channels.

• Detailed viewing data for the 21 individual stages were collected for all 13 TV
   markets. For Australia (data missing on 6 stages) and for the United States (data
   missing on 11 stages) the information is incomplete though.

• The data refer to ‘viewing on same day as live’ (‘VOSDAL’), excluding time‐
   shifted viewing on later days. This is not an issue since for live sports broadcasts
   time‐shifted TV viewing is marginal (1 to 2%). It can make a larger difference
   though for Tour talkshows (10 to 20%).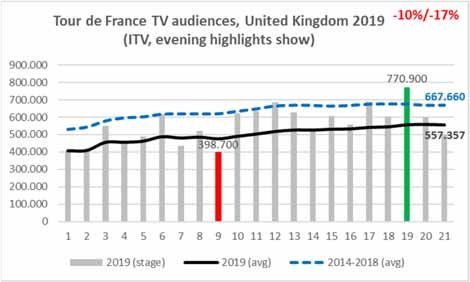
AVERAGE TV AUDIENCES PER TOUR DE FRANCE STAGE
(international comparison, 2010-2019)
% change
Rank (last % change vs. peak
Markets with almost complete information 2010 2011 2012 2013 2014 2015 2016 2017 2018 2019 10 years) vs. 2018 (since 2010)
Australia (SBS One) 310.000 502.000 398.000 228.000 205.000 262.500 227.000 258.000 239.000 195.000 10 -18% -61%
Belgium (Flanders, VRT) 561.000 597.000 504.500 471.500 477.000 592.500 482.000 493.500 424.000 565.000 3 33% -5%
Belgium (Wallonia, RTBf) 231.500 293.000 252.000 207.500 200.500 238.500 209.000 248.000 202.000 254.000 2 26% -13%
Denmark (TV2) 412.000 463.500 321.500 299.000 262.000 296.000 266.500 258.000 278.500 263.500 8 -5% -43%
France (France 2, after 15h) 3.500.000 4.300.000 3.400.000 3.980.000 3.900.000 4.028.500 3.523.500 3.795.000 3.311.000 3.700.000 6 12% -8%
France (France 3, before 15h) 1.900.000 2.700.000 2.260.000 2.800.000 2.400.000 2.528.000 2.400.000 2.300.000 2.100.000 2.400.000 4 14% -14%
Germany (ARD) 1.257.000 1.268.000 no bc no bc no bc 1.147.500 1.132.500 1.328.500 1.276.500 1.345.000 1 5% 1%
Germany (Eurosport) 380.000 360.000 430.000 431.500 349.000 350.000 235.000 322.000 n.a. n.a. / /
Italy (Rai 3, final part, "all'arrivo") n.a. 716.000 767.500 919.000 1.375.000 1.198.000 1.066.000 1.307.000 1.251.000 1.427.500 1 14% 4%
Italy (Rai 3, full broadcast, "diretta") n.a. n.a. n.a. n.a. 938.000 699.000 749.000 900.000 966.048 917.118 3 -5% -5%
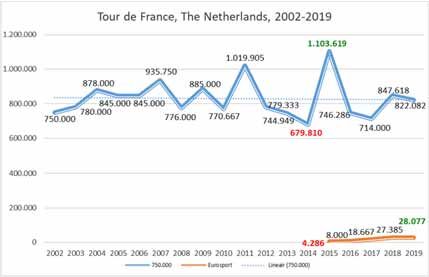
The Netherlands (NPO) 770.500 1.020.000 779.500 745.000 680.000 1.103.500 746.000 714.000 847.500 822.000 4 -3% -26%
Norw ay (TV2) 145.000 174.500 127.000 147.000 139.500 172.000 140.500 124.000 100.500 106.500 9 6% -39%
Spain (final part, "La llegada") 1.271.000 1.351.000 1.262.000 1.022.500 1.218.500 1.320.000 982.000 999.000 962.000 893.000 10 -7% -34%
Spain (Teledeporte, first part) n.a. n.a. n.a. 436.000 277.500 495.000 351.500 375.000 357.500 374.500 4 5% -24%
Sw eden (Eurosport) 32.000 35.500 38.000 34.000 24.000 31.000 27.500 24.000 26.500 31.000 5 17% -18%
United Kingdom (ITV4) 434.000 562.500 705.500 606.000 625.000 687.000 698.000 709.000 617.500 557.500 9 -10% -21%
United States (NBC/NBCSN) 456.000 334.000 290.000 287.000 288.000 365.000 296.000 331.000 323.500 359.000 3 11% -21%
Total 9.760.000 11.977.000 9.275.500 9.378.000 9.743.500 11.792.000 10.031.500 10.911.000 9.859.500 10.519.000 4 7% -12%
Adjusted total (without Germany) 8.123.000 10.349.000 8.845.500 8.946.500 9.394.500 10.294.500 8.664.000 9.260.500 8.583.000 9.174.000 5 7% -11%
% change
Markets with missing information for many years 2010 2011 2012 2013 2014 2015 2016 2017 2018 2019 vs. 2018
Europe (Eurosport overall total) n.a. n.a. n.a. n.a. n.a. n.a. 714.000 785.000 n.a. n.a. /
France (Eurosport) n.a. n.a. n.a. n.a. n.a. n.a. n.a. n.a. 79.500 115.000 45%
Germany (One) n.a. n.a. n.a. n.a. n.a. n.a. n.a. 140.000 240.000 n.a. /
Italy (Rai Sport) n.a. 307.000 356.000 426.500 700.000 656.000 534.000 n.a. n.a. n.a. /
Italy (Eurosport) n.a. n.a. n.a. n.a. 75.000 104.000 n.a. n.a. 88.000 n.a. /
Portugal n.a. n.a. n.a. n.a. n.a. n.a. 210.000 n.a. n.a. n.a. /
The Netherlands (VRT) n.a. 90.000 n.a. 94.000 118.000 n.a. n.a. n.a. n.a. n.a. /
The Netherlands (Eurosport) n.a. n.a. n.a. n.a. n.a. 4.000 8.000 18.500 27.500 28.000 2% 2%
Slovakia n.a. n.a. n.a. n.a. n.a. n.a. 215.000 n.a. n.a. n.a. /
Sw eden (public channel) n.a. n.a. n.a. n.a. n.a. n.a. 71.000 43.000 12.500 13.000 4% -82%
Sw itzerland (French region, RTS) n.a. n.a. n.a. n.a. n.a. n.a. n.a. 33.000 n.a. n.a. /
Sw itzerland (German region, SRF) n.a. n.a. n.a. n.a. n.a. n.a. 53.000 54.000 n.a. n.a. /
Sw itzerland (Italian region, RSI) n.a. n.a. n.a. n.a. n.a. n.a. n.a. 5.000 n.a. n.a. /
United Kingdom (Eurosport) n.a. 96.500 n.a. n.a. n.a. n.a. n.a. n.a. 55.000 40.000 -27% -59%
(Best scores for a market are underlined and got a blue background.)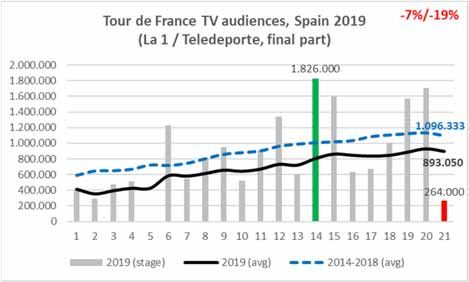
AVERAGE TV AUDIENCES PER STAGE
                              key insights 2019
•   The 2019 Tour de France was the 4th best‐watched edition of the decade, behind 2011, 2015 and 2017. Compared to
    the disappointing 2018 audiences, global Tour de France TV ratings increased by 7%: from 9,86 million to 10,52
    million viewers on average per stage for the 13 territories in our dataset. They are now only 12% below the 11,98
    million record audience of 2011. Taking into account that the 2019 number does not include the German Eurosport
    TV audience (estimated at about 300.000 viewers), in comparison to the well‐watched 2015 edition the loss is
    reduced to about million TV viewers on average per stage.
•   In 7 countries Tour de France TV audiences were up in 2019. Boosted right from the start by strong audiences for Le
    Grand Départ in Brussels, TV audiences in Belgium showed the biggest increase: up 33% in Flanders and up 26% in
    Wallonia. Tour TV audiences were 10 to 15% larger than last year in France (+12% for the broadcasts on France 2,
    +14% for the broadcasts on France 3), in Italy (but only for the final part of the race), in the United States and in
    Sweden (+17% for the broadcasts on Eurosport, + 4% for he broadcasts on the public channel). In Germany and in
    Norway, the audience growth is a bit smaller and below 10%.
•   Five countries had smaller Tour de France TV audiences in 2019. The biggest drops were observed in Australia (‐18%),
    in the United Kingdom (‐10%) and in Spain (‐7%). In Denmark and in the Netherlands, the audiences decrease is
    relatively small (5% or less). Remarkably, the 7% drop in Spain is only for the final part of the race (on either La1 or on
    Teledeporte), while the TV audience for the first part of the race (always on Teledeporte) actually increased by 5%.
    The opposite was the case in Italy, where the first part of the race lost 5% of its audience and the final part won 14%.
•   A new feature in our overview table is the viewership rank of the latest edition over the past decade, for each
    country. In 4 countries, the 2019 edition is on the podium of the last 10 years: it was the best‐watched edition in
    Germany and in Italy, the second‐best watched in Wallonia and the third‐best watched in Flanders and in the United
    States. But at the same time it was amongst the 3 worst‐watched editions of the past decade in Australia (rank 10), in
    Spain (10), in Norway (9), in the United Kingdom (9) and in Denmark (8). We can not recall such strong differences
    between countries before.
•   For Eurosport, we found TV audience information for 4 countries. In three of these countries, Eurosport TV audiences
    for the Tour de France were up: +45% in France, +17% in Sweden and +2% in the Netherlands. Eurosport audiences
    still only represent 3% of the total Tour de France TV audience in France and in the Netherlands though, while in
    Sweden it is 70%. In the United Kingdom, Eurosport TV audiences were down 27%. In the UK, Eurosport audiences
    represent 7% of the total Tour de France TV audience.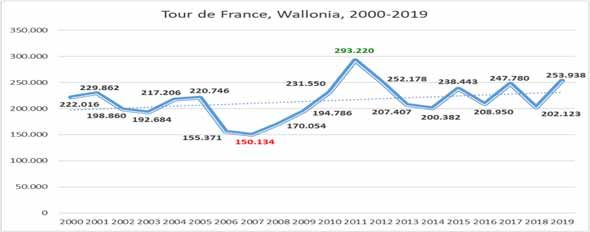
COUNTRY GRAPHS TOUR 2019 (1)
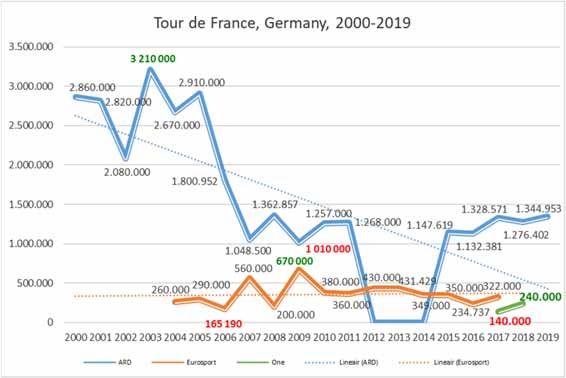
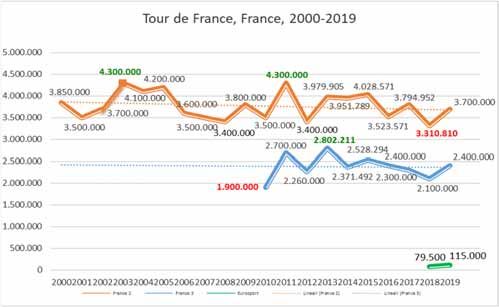
• In four countries, the
average 2019 Tour de
France TV audiences (black
line) are higher relative to
the 2018 average (first
green percentage in the
top right corner) as well as
relative to the 5‐year
average over the 2014‐
2018 period (second green
percentage in the top right
corner and the blue dotted
line).
• In Belgium (Flanders & Wallonia) and in Italy, the average 2019 TV
audience is about 15% up on the 5‐year average. In both countries
average audiences were higher already from the first stages on. For
Belgium this comes as no suprise, given the fact that Brussels hosted Le
Grand Départ.
• In France and in Germany, 2019 TV audiences were initially below the 5‐
year average, but steadily grew and exceeded the historic average
halfway the Tour in Germany and at the very end of the Tour in France.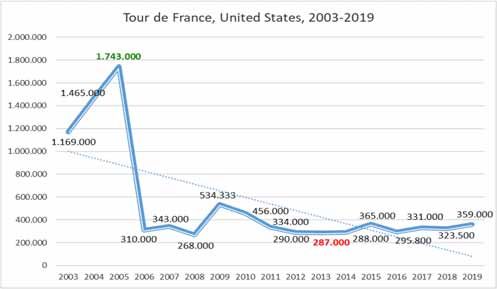
COUNTRY GRAPHS TOUR 2019 (2)

• In Denmark and in the Netherlands, 2019 Tour de France TV audiences
  were slightly below last year’s level and almost equal to the 5‐year
  average. It is worth noting that both countries were the only ones last
  year to show an opposite trend and actually had higher Tour de France
  TV audiences in 2018 than in 2017, which partly explains the small loss
  in 2019. In Denmark the 2019 Tour de France started with higher than
  average TV audiences and became about equal to the average from
  the 9th stage on. In the Netherlands TV audiences remained below the
  5 year average until the last couple of stages.
• In Norway and in Sweden the 2019 TV audiences are a bit up on last
  year (6% in Norway, 9% in Sweden), but the average is still about 20%
  below the 2014‐2018 historic average. It should be noted that Norway
  started broadcasting all stages from start to finish in 2017. Longer
  broadcasts lower the average audience and therefore one should be
  cautious in comparing Norwegian pre and post 2017 TV audiences. For
  Sweden, the difference can be attributed to the fact that the Tour was
  broadcast on a major public channel for 2 years (2016, 2017) and has
  since then been shown a minor public (sports) channels.
COUNTRY GRAPHS TOUR 2019 (3)

• In only two countries the average 2019 Tour de France TV audiences (black line) are lower relative to the 2018
  average as well as relative to the 5‐year average over the 2014‐2018 period.
• In Spain, TV audiences were down 7% versus 2018 and 19% versus the 5‐year average. The average Tour de
  France audience is below 900.000 for the first time and in the Tour de France viewership ranking by country
  Spain may soon lose its fourth place (behind France, Italy and Germany) to the Netherlands or even Belgium
  (Flanders and Wallonia combined).
• In the United Kingdom, Tour de France TV audiences were down 10% versus 2018 and 17% versus the 5‐year
  average. Maybe the fact that for the first time in 5 years there was no British winner nor a British Yellow Jersey
  wearer, reduced viewership interest for the evening highlights show. And although the eventual winner Egan
  Bernal was indeed part of the British Ineos team, it could very well be that the new sponsor has not been able
  so far to create the same British identity as Sky did.

AVERAGE AUDIENCE SHARE PER STAGE 2019

Rank Market (channel)                 Average audience share            Highest audience share stage                  Lowest audience share stage

1 (=) Denmark (TV2)                         51,4% (‐1,6)                             65,0%                                        34,6%
                                                                         (Stage 14: Tarbes–Tourmalet)                 (Stage 21: Rambouillet–Paris)

2 (=) The Netherlands (NPO)                 45,2% (+2,2)                              61,5%                                       23,9%
                                                                   (Stage 19: St.‐Jean‐de‐Maurienne–Tignes)         (Stage 09: Saint‐Étienne–Brioude)

3 (=) Norway (TV2)                          43,2% (+5,2)                              58,3%                                       30,9%
                                                                   (Stage 19: St.‐Jean‐de‐Maurienne–Tignes)            (Stage 03: Binche–Épernay)

4 (=) France (France 2)                     38,2% (+3,2)                             51,2%                                        23,4%
                                                                         (Stage 14: Tarbes–Tourmalet)                  (Stage 02: Brussels‐Brussels)

5 (=) Italy (Rai3)                          14,0% (+1,4)                             20,4%                                        4,7%
                                                                         (Stage 14: Tarbes–Tourmalet)                 (Stage 21: Rambouillet–Paris)

6 (=) Germany (ARD only)                    11,2% (+0,6)                            17,4%                                         +6,9%
                                                                      (Stage 20: Albertville–Val Thorens)              (Stage 03: Binche–Épernay)

7 (+1) Sweden (TV12, Sportkanalen +         9,1% (+0,6)                               16,0%                                        2,9%
       Eurosport)                                                  (Stage 19: St.‐Jean‐de‐Maurienne–Tignes)            (Stage 02: Brussels‐Brussels)

8 (‐1) Spain (Teledeporte / La1)            8,1% (‐0,7)                              16,2%                                        2,8%
                                                                         (Stage 14: Tarbes–Tourmalet)                 (Stage 21: Rambouillet–Paris)

(Note: no information on audience share was found for Australia, Flanders, the United Kingdom, the United States and Wallonia)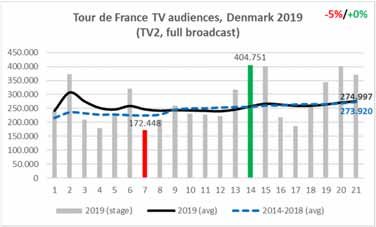
AVERAGE AUDIENCE SHARE PER STAGE
                                          key insights 2019
•   Traditionally, the highest audience shares for cycling races are found in Flanders. For example, the 2017 Tour de
    France recorded an average per stage audience share of 59%, which implied that on a typical July afternoon, 6 out of
    10 Flemish TV viewers were watching the tour de France. We did not get the Flemish audience share data for the
    2019 Tour de France, however, which is why Denmark is now topping this list.
•   In Denmark, this year’s audience share was slightly down to 51,4%, which remains in the 47‐53% range it used to be
    the last couple of years, but still a long way from the 61% shares of 2010 and 2011. Just like last year, in the
    Netherlands (45%), Norway (43%) and France (38%) the audience shares are between 35 and 45% and they are well
    up in all three countries: +5,2 percentage points in Norway (the biggest market share increase for all countries in our
    dataset), +3,2 percentage points in France and +2,2 in the Netherlands.
•   There is quite a large gap in audience share between the aforementioned countries and the four other countries. In
    Italy (14,0%), Germany (11,2%), Sweden (9,1%) and Spain (8,1%), roughly speaking only about one person out of ten
    watching TV was watching the Tour de France. Except for Spain, the audience shares are slightly up in each of these
    countries (0,6 to 1,4 percentage points). As a result, the Tour’s audience share in Sweden is now higher than in Spain.
    Given Spain’s rich cycling legacy, this is truly remarkable.
•   The difference between the two group sof four countries becomes very clear as well when the stages with the
    highest and lowest shares for each country are compared. The stages with the lowest audience share in the top 4
    countries all still have higher TV audience shares than the stages with the highest audience share in the bottom 4
    countries.
•   Stage 14, a mountain stage from Tarbes to the Tourmalet had the highest audience share in 4 countries, with a share
    of 65% in Denmark and over 50% in France. Another mountain stage (stage 19) had the highest audience share in 3
    countries. The closing stage was the stage with the lowest share in 3 countries with a share of just 2,8% in Spain and
    less than 5% in Italy. Stages 2 and 3 had the lowest share in 2 countries each.
GLOBAL TV AUDIENCES PER STAGE 2019
Stage‐by‐stage global TV audiences 2019 (10 countries, 11 TV‐markets, Australia & US not included)
16.000.000
15.133.184
14.051.622 14.063.832
14.000.000 13.429.770 13.245.745
12.000.000
10.293.963 10.400.756
10.000.000 9.757.980 9.507.701 11.013.409
10.151.801
8.000.000 7.656.549 8.671.776
7.912.036 8.376.568 8.400.961 8.200.842
7.299.679 7.082.8777.078.852 7.338.441
6.000.000
4.000.000
2.000.000
0
1 2 (TTT) 3 4 5 6 (M) 7 8 9 10 11 12 (M) 13 (ITT) 14 (M) 15 (M) 16 17 18 (M) 19 (M) 20 (M) 21
• The 2019 Tour de France shows the usual pattern of growth in TV audiences: about a third up in the second week and
almost 50% extra in the final week. In 2018, both the 2nd and 3rd week TV audiences were up 50% on the first week
but that edition had no mountain stage in the first week and no time trial stage in the second week.
• There is a clear weekend effect, except for the opening stages. As in previous years, the global TV impact of organizing
Le Grand Départ is relatively small, especially in comparison to the audiences for the other stages.
• In line with observations from previous years, mountain stages attract higher TV audiences than flat stages (+ 49%),
while the opposite is the case for (team) time trial stages (‐ 8%). This difference is remarkably stable: last year’s
mountain stages recorded a similar 51% extra audience and time trial stages an almost equal 9% smaller audience.
Stage type Average audience Stage timing Average audience
Flat stage 8.623.761 (reference) First week (up to 1st rest day) 8.319.770 (reference)
Mountain stage 12.817.974 (+49%) Second week (between 1st & 2nd rest day) 10.718.179 (+29%)
(Team) Time trial stage 7.928.696 (‐8%) Third week (after 2nd rest day) 12.046.624 (+45%)RANKING OF 2019 STAGES BY GLOBAL TV
VIEWERSHIP
Total
Rank Stage viewers Best / worst watched stage in…
1 Stage 20 (M): Albertville – Val Thorens 15.133.184 Germany, Italy, Wallonia
2 Stage 19 (M): Saint‐Jean‐de‐Maurienne – Tignes 14.063.832 Sweden, United Kingdom
3 Stage 14 (M): Tarbes – Tourmalet 14.051.622 Denmark, Spain
4 Stage 15 (M): Limoux – Foix 13.429.770 Wallonia
5 Stage 18 (M): Embrun – Valloire 13.245.745 Flanders, France
6 Stage 17: Pont du Gard – Gap 11.013.409
7 Stage 09: Saint‐Étienne – Brioude 10.400.756 United Kingdom
8 Stage 06 (M): Mulhouse – La Planche des Belle Filles 10.293.963
9 Stage 21: Rambouillet – Paris 10.151.801 The Netherlands, Norway, Spain, Italy
10 Stage 08: Mâcon – Saint‐Étienne 9.757.980
11 Stage 12 (12): Toulouse – Bagnères‐de‐Bigorre 9.507.701
12 Stage 16: Nîmes – Nîmes 8.671.776
13 Stage 11: Albi – Toulouse 8.400.961
14 Stage 10: Saint‐Flour – Albi 8.376.568
15 Stage 13 (ITT): Pau – Pau 8.200.842
16 Stage 07: Belfort – Chalon‐sur‐Saône 7.912.036 Denmark
17 Stage 02 (TTT): Brussels – Brussels 7.656.549 France, Sweden
18 Stage 05: Saint‐Dié‐des‐Vosges – Colmar 7.338.441
19 Stage 01: Brussels – Brussels 7.299.679 The Netherlands
20 Stage 03: Binche – Épernay 7.082.877 Germany, Norway
21 Stage 04: Reims – Nancy 7.078.852 FlandersBEST AND LEAST-WATCHED STAGES
key insights 2019
• Based on detailed TV audience data at the individual stage level from 10 countries and 11 TV‐markets, we
conclude that stage 20 (from Albertville to Val Thorens) was this year’s best‐watched stage. A global
audience of 15,13 million viewers is 1,55 million viewers (11%) more than last year’s best‐watched stage (in
the same markets). Yet, it was the best‐watched stage in only three markets (Germany, Italy and Wallonia).
• Just like in 2018 the 5 best‐watched stages are mountain stages. Stage 19 (the aborted stage to Tignes) was
the best‐watched stage in Sweden and the United Kingdom and ranks second, ahead of the Tourmalet stage,
third in the stage viewership ranking and the best‐watched stage in Denmark and Spain. In France and in
Flanders ‐ the Tour’s biggest TV markets measured in, respectively, total viewership and local market share ‐
stage 18 (Embrun‐Valloire) was the best‐watched stage.
• Remarkably, the 4th best‐watched stage, a mountain stage from Limoux to Foix was nowhere the best‐
watched stage but on the contrary was the least‐watched stage in Wallonia. This is because the stage was
scheduled on the Belgian National Day and the Walloon broadcaster traditionally demotes the live Tour de
France broadcast to its smaller secondary channel on that day.
• There is one stage that is at the same time the best‐watched stage in two countries and the least‐watched
stage in two more countries. The final stage was the best‐watched stage in the Netherlands and in Norway
while in Spain and Italy out of all stages it did generate the least TV interest. This phenomenon is far from
new: the last stage has been the best‐watched stage in Norway 6 times in the last 7 years, and 4 times in the
last 9 years in the Netherlands. In Spain, the last stage has been the least‐watched stage 6 times in the last 9
years and in Italy 3 times in the last 5 years. It points to an interesting intercultural different view on that
final stage between Northern and Southern Europe.BEST AND LEAST-WATCHED STAGES
key insights 2019
• The first 5 stages of the 2019 Tour de France were the 5 stages with the lowest global audiences as
well. Stage 4 (Reims‐Nancy) was the least‐watched stage worldwide, totalling just 7,08 million TV
viewers, 47% of the best‐watched stage audience. This is 1,16 million viewers (20%) more than the
least‐watched stage last year (which equaled 44% of that year’s maximum audience).
• While only 5 stages are best‐watched stages in anyone of the TV markets in our dataset, no less
than 8 stages are the least‐watched stage somewhere. We already mentioned stages 21 (Spain &
Italy) and 15 (Wallonia). In Flanders, stage 4 was the least‐watched stage, while in Germany and
Norway it was stage 3, in the Netherlands stage 1, in France and Sweden stage 2 (the TTT in
Brussels), in Denmark stage 7 and in the UK stage 9.
• When the per stage best audiences for all TV markets are summed (i.e. if in all countries the same
stage had been the best‐watched stage), a hypothetical maximum per stage TV audience for the
2019 Tour de France of 16,41 million TV viewers is found, which is 1,28 million more than the
actual audience for the best‐watched stage. Similarly, a hypothetical minimum per stage TV
audience for the 2019 Tour de France (i.e. if in all countries the same stage had been the least‐
watched stage) of 5,94 million can be computed, which is 1,14 million less than the actual
audience for the least‐watched stage.AVERAGE 2019 AUDIENCES PER STAGE TYPE
(international comparison)
• In all TV markets, mountain stages attract higher TV Country Flat Mountain (Team) Time trial
audiences than flat stages. Just like in 2018 the difference
is relatively small in Norway: only 7% more TV viewers. Denmark 227.461 336.450 345.128
(+48%) (+52%)
Conversely, especially in France, Germany and Italy,
Flanders 520.604 657.383 506.629
mountain stages attract much more TV viewers than flat (+26%) (‐3%)
stages: over 40% extra viewers. The most significant 3.382.500 4.877.143 2.715.000
France
difference can be found in Spain, with audiences for (+44%) (‐20%)
mountain stages about two and a halve times as large. Germany 1.148.097 1.660.000 1.325.000
This is due to the fact that such spectacular stages are (+45%) (+15%)
broadcast on the main and well watched Spanish La1 Italy 1.264.083 1.810.714 1.066.000
(+43%) (‐16%)
channel while the other stages are broadcast on the
The Netherlands 763.642 975.429 636.010
smaller Teledeporte sports channel. (+28%) (‐17%)
• Unlike expectations, time trial stages do not lead to lower Norway 103.500 110.714 109.500
TV audiences in all countries. The strongest positive (+7%) (+6%)
impact is found in Denmark (+52%, last year it was +15% Spain 609.636 1.466.857 443.500
as well), while in Germany, Norway and Wallonia a smaller (+141%) (‐27%)
positive impact of up to 15% is observed. In Sweden (‐ Sweden 43.226 49.714 26.000
(+15%) (‐40%)
40%), Spain (‐27%) and France (‐20%), time trial stages 521.775 628.957 520.250
United Kingdom
have the largest negative impact on TV audiences. (+21%) (‐0%)
Compared to last year, there was a change in impact for Wallonia 231.878 295.987 239.122
the Netherlands and Sweden (from positive to negative), (+28%) (+3%)
and for Norway and Wallonia (from negative to positive).
Remarkably, for the second year running there was no
almost difference in UK TV audiences for flat stages and
time trial stages.AVERAGE TV VIEWERSHIP TOUR TALKSHOWS (2011-2019)
Market Talkshow 2011 2012 2013 2014 2015 2016 2017 2018 2019
Flanders Vive le Vélo 770.209 751.661 769.703 613.000 752.839 719.093 647.625 633.176 771.079
(Eén) (+22%)
France Village Départ / +/- 1.000.000 1.234.000 +/- 1.000.000 +/- 1.150.000 +/- 1.000.000 No broadcast No broadcast No broadcast
(France 3)
France Vélo Club / +/- 2.000.000 1.840.000 +/- 2.000.000 +/- 1.850.000 +/- 1.700.000 +/- 2.000.000 +/- 1.900.000 +/- 2.300.000
(France 2) (+21%)
France Le journal du Tour / / / / / / +/- 1.500.000 +/- 1.300.000 +/- 2.100.000
(France 3) (+62%)
Italy Tour replay / / / / 613.316 536.188 667.700 690.550 /
(Rai)
The De Avondetappe 1.076.000 877.000 953.000 917.000 856.087 870.957 961.478 943.957 995.450
Netherlands (NPO1) (+5%)
The Tour du Jour 482.000 591.000 424.000 314.000 301.958 No broadcast 187.257 192.095 180.524
Netherlands (RTL 7) (-6%)
The exciting daily developments in the Tour de France resulted in excellent TV ratings for almost all Tour de
France talkshows. Vive le Vélo (Flanders, +22%) and Vélo Club (France 2, +21%) both recorded the highest TV
audiences ever, while De Avondetappe (the Netherlands, NPO, +5%) had its second best average audience of
the last 10 years and Le Journal du Tour (France 3, +62%) its highest audience since 2014. Only Tour du Jour
(the Netherlands, RTL7) lost a small part of its audience (6%). Vive le Vélo had the highest local market share
(40,8%, one of the highest ever), followed by De Avondetappe (25,8%), Vélo Club (23,2%), Le journal du Tour
(12,0%) and Tour du Jour (4,0%).2. WOMEN’S PRO CYCLING TV REPORT
• In most countries, up to four years ago only two or three women’s races were broadcast live: La Course by le
Tour de France, the World Championships road race and/or the national Championships race. Things started to
change in 2017‐2018 with more women’s racing than ever before broadcast live on TV. This trend was
continued in 2019. In several European countries the coverage of women’s pro cycling has increased to about
10 races being broadcast live on major public channels and many more either streamed or being broadcast on
smaller (niche) channels, like Eurosport 2 (all over Europe), La Chaine l’Équipe (France) and RaiSport (Italy).
• With the increased number of broadcasts, more information on TV viewership for women’s cycling becomes
available as well. Therefore, just like last year, we include a separate section on women’s racing in this TV
report on professional road cycling. We hope this section will continue to grow in size and importance over the
years and that the information it provides will help the further development of women’s professional cycling.
• The statistics in this section are based on the still fairly limited amount of data on TV viewership for women’s
pro cycling we were able to collect over the past couple of years. Averages and percentages are therefore
sometimes based on a very small number of observations. Many countries and races are still missing as well.
The picture that is sketched is thus far from complete and it is therefore dangerous to draw strong conclusions
from the findings in this section. The results should rather be seen as a first insight into the dynamics of TV
viewership for women’s cycling, potentially signalling any trends or patterns for such viewership.
• This section provides the following information:
o The composition of our dataset on women’s road cycling by year and by country
o TV viewership for the 2019 UCI women’s WorldTour races
o TV viewership for the non‐UCI WorldTour women’s races in 2019
o Top 10 TV audiences for women’s cycling races in 2019
o A comparison of TV audiences for women’s races by country and by scheduling of the broadcastCOMPOSITION OF THE DATASET
• In 2019, we recorded 75 TV audiences for women’s cycling, 10 more than in 2018. We also received
some older data which lead to a dataset of now 216 TV audiences, but with two thirds of the
observations for the last two years.
• In total, we have viewership information from 14 territories, although for 3 TV markets the information
is extremely limited to a single observation only. The largest number of observations were collected for
the Netherlands (76, including 25 for 2019), while we have 33 observations for Flanders, 32 for
Sweden, and 28 for Spain. Those 4 countries represent 78% of the dataset.
• Unfortunately, our dataset does not reflect very well the strong increase in broadcasts of women’s
cycling races in 2019 since the information we were able to collect is mainly from broadcasts on well‐
watched major public channels. Streaming data are much harder to find while TV audiences for niche
channels are seldom communicated to the public. As a result, it is not possible to adequately report
about the dozens of women’s races that are now broadcast on e.g. RaiSport or La Chaine l’Équipe.UCI Women's World Tour 2019 TV market Channel TV-audience Broadcast information
Women 2019 Women 2018 % change Men 2019 % of men
March 9 Strade Bianche Denmark Eurosport2NON-UCI WORLDTOUR WOMEN’S RACES 2019
TV VIEWERSHIP
UCI World Championships 2018 TV market Channel TV-audience Broadcast information
Women 2019 Women 2018 % change Men 2019 % of men
September 24 World Championships: ITT Flanders EEN 294.883DISCUSSION OF 2019 TV VIEWERSHIP FOR
WOMEN’S CYCLING
• One of the conditions for being in the Women’s WorldTour is the guarantee of live television coverage of at least 45
minutes. Still, in 2019 several Women’s WorldTour races did not get any TV coverage at all, as was the case with the
Walloon classics organized by ASO, Flèche Wallonne and Liège‐Bastogne‐Liège. In fact, in our research we only found
viewership data for (live) coverage for 10 of the 23 women’s WorldTour competitions (43%). We were, of course,
unable to monitor all markets and it is likely that some of the 13 other races did get some tv coverage in smaller non‐
monitored markets or on niche sports channels. If that were the case, however, it would have been to relatively small
audiences.
• In addition to the 10 WorldTour races, we have TV viewership information on another 11 races: the Jayco Herald Sun
Tour, the SPAR Omloop van het Hageland, the Vuelta a Burgos Feminino and no less than 8 championships races (3
National Championships, 3 Continental Championships and 2 World Championships). Viewership information was
found for 7 countries: the Netherlands, Belgium, Sweden, Spain, Denmark, France and the UK.
• The 8 women’s races that got the widest TV coverage across Europe are Strade Bianche, Amstel Gold Race, la Course
by le Tour de France, the European and World Championships (ITT and road race) and the Madrid Challenge. Most of
these races were covered live by major public channels in at least a handful of countries. Other races like e.g. Ronde
van Vlaanderen were only broadcast on smaller channels and/or in a limited number of countries.
• Based on the information we collected, we conclude there are 4 races that have had over a million TV viewers. The
World Championships Road Race was the best‐watched women’s race with already 1,665 million TV viewers in France,
Spain, the Netherlands, Flanders and Sweden. The race was broadcast live on BBC2 in the United Kingdom as well, but
viewership for this broadcast is unknown. Adding the UK viewership, and the viewership in countries like Norway,
Denmark and Italy will undoubtedly lift the global audience well over the 2 million mark. The Amstel Gold Race has a
combined TV audience of 1,204 million in the Netherlands, France, Flanders and Denmark. Adding smaller audiences
from other TV markets will bring its global TV audience to about 1,5 million, making in the second best‐watched
women’s race in 2019. The European Championships road race and the World Championships ITT are two more races
for which the global TV audience can be estimated between 1 and 1,5 million.STREAMING OF WOMEN’S CYCLING
Race Date Feed source Provider Audience
Omloop Het Nieuwsblad 2/03/2019 Facebook Proximus 2500 avg
Omloop Het Nieuwsblad 2/03/2019 Facebook Proximus 218.000 views / 480.000 minutes
SPAR Omloop van het Hageland 3/03/2019 n.a. n.a. 4100 avg
Trofeo Alfredo Binda 24/03/2019 YouTube PMG Sport 2000 avg
Dwars door Vlaanderen 3/04/2019 Facebook Proximus 2500 avg
Brabantse Pijl 17/04/2019 Facebook Proximus 1200 avg
• Many women’s races that did not get live TV coverage have instead been streamed in 2019. For some
streams we recorded the number of online viewers for the final part of the race (up to one hour). Of
course, many more races were streamed than the ones presented in the table above.
• The data show that although those streams allow viewership from all over the world, the actual
audience is very small: between 1000 and 4000 on average. It remains relatively difficult for cycling
fans to find their way to streamed cycling races, a problem that Velon is confronted with as well when
it streams the Hammer Series.
• We found only one official communication on audiences for streamed women’s races. The stream of
the Omloop Het Nieuwsblad got 218.000 views and 480.000 viewing minutes. Although this seems
much, it is in line with our personal observation on small viewership interest in these streams. Dividing
the total minutes by the total views tells us the average viewing time per view is in fact 2 minutes and
12 seconds only. If the stream lasted for one hour, these numbers represent a streaming audience of
just 8000 viewers on average (480.000 divided by 60 minutes). But the stream was probably much
longer. If the stream lasted for two hours, the average streaming audience is further reduced to 4000
(480.000 divided by 120 minutes).TOP 10 TV AUDIENCES WOMEN’S CYCLING 2019
2019 Top 10 TV audiences (by total audience)
Race TV market Channel Women Men % vs. men Broadcast information
1. Dutch National Championships The Netherlands NPO1 1.353.000 317.000 427% summary broadcast after a game of the Dutch women's football team
2. World Championships: RR France France 3 522.000 1.103.000 47% race was broadcast live the day before the men's race
3. Gent–Wevelgem in Flanders Fields Flanders (part 2) EEN 516.499 694.477 74% race was broadcast live prior to the men's race
4. World Championships: RR The Netherlands NPO1 478.000 590.000 81% race was broadcast live the day before the men's race
5. Amstel Gold Race France France 3 473.000 743.000 64% race was broadcast live prior to the men's race
6. Amstel Gold Race The Netherlands NPO1 393.000 567.000 69% race was broadcast live prior to the men's race
7. European Championships: road race The Netherlands NPO1 382.000 355.000 108% race was broadcast live the day before the men's race
8. World Championships: RR Flanders EEN 378.252 830.560 46% race was broadcast live the day before the men's race
9. World Championships: ITT The Netherlands NPO2 355.000 280.000 127% race was broadcast live the day before the men's race
10. Strade Bianche Flanders (2) EEN 344.721 547.440 63% rebroadcast of final prior to the men's race
• Within our dataset, the broadcast of the Dutch National Championships on the public channel NPO1 had the highest
audience with over 1,35 million TV viewers. It should be noted though that viewership for this broadcast was boosted
heavily by the fact that it followed the well watched FIFA Women’s World Cup quarter final game by the Dutch women’s
football team. From the 2,7 million TV viewers watching that game, about half remained in their seats for the summary
broadcast of the women’s Dutch National Championships.
• The World Championships road race broadcast in France and the Flemish broadcast of Gent‐Wevelgem are the other
broadcasts in the top three. It is the second year running they are on the podium of this list and for both races the
audiences have increased by about 100.000 from just over 400.000 to just over 500.000 TV viewers.
• Only broadcasts from 3 countries are present in this list since the rest of the top 10 also consists of Dutch (4), Flemish
(2) and French (1) broadcasts. The list counts 7 different races. The World Championships road race is three times in the
top 10 (broadcasts in France, the Netherlands and Flanders), the Amstel Gold Race twice (France and the Netherlands)
while 5 other races only appear once.
• The top 10 consists of 8 live broadcasts and 2 summary broadcasts or rebroadcasts. The average audience for the 8 live
broadcasts is about 437.000. This is 21% and 76.000 viewers more than the 361.000 TV audience for the 8 best‐watched
live broadcasts in 2018, a clear indication of the increased viewership interest for top races in women’s cycling.TOP 10 TV AUDIENCES WOMEN’S CYCLING 2019
2019 Top 10 TV audiences (as a % of men's audience)
Race TV market Channel Women Men % vs. men Broadcast information
1. Dutch National Championships The Netherlands NPO1 1.353.000 317.000 427% summary broadcast after a game of the Dutch women's football team
2. Jayco Herald Sun Tour: all stages The Netherlands Eurosport 10.000 3.500 286% summary broadcast of 2 stages of race held in the days before
3. World Championships: ITT The Netherlands Eurosport 87.000 36.000 242% race was broadcast live the day before the men's race
4. European Championships: road race Sweden Eurosport 2 4.000 2.000 200% race was broadcast live the day before the men's race
5. World Championships: ITT The Netherlands NPO2 355.000 280.000 127% race was broadcast live the day before the men's race
6. World Championships: RR The Netherlands Eurosport 126.000 112.000 113% race was broadcast live the day before the men's race
7. European Championships: road race The Netherlands NPO1 382.000 355.000 108% race was broadcast live the day before the men's race
8. World Championships: RR Sweden svt1 143.000 136.740 105% race was broadcast live the day before the men's race
9. Strade Bianche Sweden Eurosport 2 7.000 7.000 100% race was broadcast live prior to the men's race
10. Strade Bianche United Kingdom Eurosport 2 29.100 32.100 91% race was broadcast live prior to the men's race
• When compared to the men’s audience for the same race, the well‐programmed summary broadcast of the Dutch
National Championships again tops the list, its TV audience being over 4 times larger than the audience for the live
broadcast of the men’s National Championships the next day. A summary broadcast of the Jayco Herald Sun Tour and
the live broadcast of the World Championships ITT race complete the podium. All top three broadcasts are Dutch.
• Again, only 3 countries are present in the list, but two of them are different from the absolute viewership top 10 on
the previous slide: the Netherlands (6 times) are now accompanied by Sweden (3) and the United Kingdom (1). Four
races are twice present in the top 10: the World Championships road race, the World Championships ITT, the
European Championships road race and Strade Bianche.
• The top 9 races all have TV audiences that are equal or better than the audience for the equivalent men’s race. It
should be noted though that for 3 races both the men’s and women’s audiences are too small (< 10.000) to conclude
that the difference is meaningful.
• Ignoring the exceptional case of the Dutch National Championships broadcast, the most relevant results are no doubt
related to the 4 World Championships races. For these races, TV audiences for the women’s competitions are tens of
thousands higher than for the men’s competitions. The biggest difference is recorded for the World Championships
ITT race in the Netherlands: 126.000 TV viewers more, combined on public channel NPO1 (75.000) and Eurosport
(51.000).WOMEN’S TV AUDIENCES BY COUNTRY
Country Obs. Women Men % Avg of % Note: The first percentage (%) in the tables is the average
United Kingdom 3 20.967 22.400 94% 93% women’s TV audience for all races as a percentage of the
Sweden 22 40.950 46.715 88% 78% average audience for all the equivalent men’s races. The
Switzerland 6 97.000 112.163 86% 76% second percentage (Avg of %) is the average of all the
The Netherlands 51 253.565 320.270 79% 99% percentages for the individual races. This second
Germany 1 100.000 160.000 63% 63% percentage is less affected by the weight of well watched
Austria 1 63.650 108.000 59% 59% races like the World Championships that might distort the
Flanders 19 321.468 571.429 56% 61% overall average. The difference between the two measures
France 6 769.271 1.354.682 57% 57% is usually rather small though.
Denmark 7 27.348 54.081 51% 50%
Italy 3 503.000 1.190.292 42% 56%
Spain 23 88.892 228.161 39% 48%
Australia 1 38.000 248.000 15% 15%
• In four countries, TV viewership for women’s pro cycling races is over 70% of the TV audience for
the equivalent men’s races. Especially the high scores for the Netherlands and Sweden are
relevant since they are based on a significant number of observations (51 and 22, respectively). In
contrast, in Denmark, in Spain and in Italy the audience for women’s races seems to be only half
the audience for the men’s events. The extremely low number for Australia is based on one
observation only and should not be given much attention.
• It is dangerous to compare the actual average audiences across countries. The high scores for
France (over 750.000 TV viewers) or Italy (over half a million TV viewers) are the result of the fact
that for these countries the dataset only contains TV viewership on large public channels while in
other countries, such as Sweden or the Netherlands, the large number of observations for the
lesser‐watched Eurosport channel in the dataset, reduce the average significantly.WOMEN’S TV AUDIENCES BY
SCHEDULING OF THE BROADCAST
Timing of race broadcast Obs. Women Men % Avg of %
In the afternoon, shortly after the men's race (not live) 3 59.333 61.333 97% 95%
On another day of the men's race 80 232.445 315.264 74% 86%
Same day prior to the men's race 57 179.038 348.910 51% 61%
Simultaneously with men's race on smaller channel or late night summary 3 56.316 502.359 11% 18%
• The analysis of the scheduling of the broadcast yields the expected results. The finding that summary
broadcasts of women’s races once the men’s race has finished leads to high audiences (over 90% of
the men’s audiences) or the conclusion that a simultaneous broadcast of a women’s race on a
smaller channel results in very small audiences (less than 10% of the men’s audience) can hardly be
called a surprise. (Note: these results are based on an extremely small number of just 3
observations)
• The more interesting result, however, seems to be that broadcasts of women’s races on another day
than the men’s race attract more interest than races that are broadcast the same day, prior to the
men’s race. Still, we think this could as well be a statistical side‐effect resulting from a selection bias
rather than a reliable measurement of the differences between the two types of broadcasts. Races
that are broadcast on another day are typically World or European Championships competitions,
which attract higher audiences for the women’s competitions than most of the classics races that are
usually broadcast on the same day. Therefore, our assumption for now is that no real significant
difference in TV interest for women’s races can be found between races broadcast the same day or
races broadcast on another day (usually, but not always, the day before).3. TV AUDIENCE DASHBOARDS PER
COUNTRY
• For each of the 14 TV markets in this report a TV audience dashboard is produced. The
dashboard includes:
o A graph representing historical Tour de France TV viewership, with the underlying short
term, medium term and long term trend
o A table containing TV audiences for cycling races broadcast in 2019, and, if available,
the TV audiences for these races in the recent past
o A table with the percentage change in TV-viewership (versus 2018) for the Tour de
France and for the other cycling races combined (if available)
o Some key insightsTV-AUDIENCE DASHBOARD AUSTRALIA
How to watch pro cycling in Australia
Short-term trend (1 year) Down SBS is firmly established as the home of cycling in Australia.
Medium-term trend (5 years) Down
In 2019 it did broadcast live (with online streaming) a
Long-term trend (> 5 years) Down
selection of ASO races, major races like the Tour of
Flanders and the UCI Road World Championships, as well
as a selection of smaller races such as the Tour of Turkey,
the CRO race or the Tour de Yorkshire.
After being broadcast for some years on Nine Network, TV
coverage of the most important Australian cycling race, the
Santos Tour Down Under, returned to Seven Network in
2019. Seven is a major sports broadcaster in Australia and
Average TV‐viewership % change 2019 it holds the rights to the Olympics, but it does not
Tour de France ‐18% broadcast many other cycling races.
Other races No data to compare
Apart from these races, most of professional road cycling is
Key insights: only available to cycling fans via subscription based sports‐
• Although many road cycling races are broadcast in themed channels.
Australia, just like in previous years we only managed
to find information on Tour de France TV audiences. For none of these races, reliable TV audience data were
• Australian Tour de France TV viewership is down 18% found.
on last year and is at the lowest level in over 10
years. With less than 200,000 viewers on average per CALL FOR HELP: Australian TV audience data for
stage, it now equals only 40% of the record audience
of the 2011 edition won by Australian Cadel Evans. professional road cycling races are extremely hard to find.
If anyone can help, please get in touch with me.TV-AUDIENCE DASHBOARD DENMARK
Races on Eurosport 2019 2018 % change 2017
Key insights:
Giro di Lombardia 28.000 10.000 180% 24.000
Kuurne - Brussel - Kuurne
Giro d'Italia (all stages)
24.000
21.500
n.a.
18.000 19%
7.000
• A mixed picture emerges in Denmark. While Tour de France TV audiences are
Gent - Wevelgem 17.000 25.000 -32% 15.000 down by 5%, other cycling broadcasts are up 26% on TV2 or TV2 Sport, and
Itzulia Basque Country (all stages)
Milano - San Remo
16.500
16.000
13.000
30.000
27%
-47% 25.000 down 18% on Eurosport.
Omloop Het Nieuwsblad 16.000 17.000 -6% 30.000
Nokere Koerse - Danilith Classic
Tour de Romandie
15.000
13.333
7.000
16.833
114%
-21%
4.000 • On the public channel, the World Championships road race won by Danish
Tirreno - Adriatico (all stages) 12.500 12.833 -3% rider Mads Pedersen was the best‐watched non Tour de France race with an
Strade Bianche
Dwars door Vlaanderen
12.000
10.000
14.000
15.000
-14%
-33%
6.000
3.000
audience increase of 79% over last year. For 8 out of the 10 races where
Critérium du Dauphiné (all stages)
E3 Binckbank Classic
10.000
9.000
8.000
22.000
25%
-59% 11.000
viewership could be compared, TV audiences were higher in 2019.
Gran Piemonte
Primus Classic
9.000
9.000
n.a.
n.a. • On Eurosport, the average audience per race decreased by about 2000
Vuelta a Andalucia / Ruta del Sol (all stages
Volta a la Comunitat Valenciana (all stages)
8.500
8.000
n.a.
n.a.
viewers from 12.800 to 10.600 viewers. The Giro di Lombardia and the Giro
Volta ao Algarve (all stages) 8.000 n.a. d’Italia (both not broadcast on public TV) recorded the highest Eurosport
Paris - Tours
Bredene Koksijde Classic
8.000
8.000
8.000
n.a.
0% 12.000
audiences. Those two races and Kuurne‐Brussel‐Kuurne are the only ones
Famenne Ardenne Classic
Milano - Torino
8.000
8.000
n.a.
5.000 60% 10.000
with over 20.000 TV viewers. Overall, 13 races had bigger Eurosport TV
Flèche Wallonne
Vuelta a España (all stages)
8.000
7.500TV-AUDIENCE DASHBOARD FLANDERS (1)
Key insights:
• TV‐viewership for professional road cycling was very much up in Flanders in 2019.
Le Grand Départ in Brussels and an exciting Tour de France lead to a 33% increase in
the Tour de France TV audience, making it the 3rd best‐watched Tour of the decade
in Flanders. TV viewership for the other races broadcast on public channel VRT
increased by 10% as well, with 20 races reaching a bigger audience then last year
and 10 races having a smaller audience.
• Both the Ronde van Vlaanderen and Paris‐Roubaix were once again watched by
over one million Flemish cycling fans. Six more races had higher audiences than the
yet well‐watched Tour de France. This happens nowhere else and it illustrates how Short-term trend (1 year) Up
Flanders is one of the few regions in the world where professional road cycling is
much more than just the Tour. Medium-term trend (5 years) Up
• Public broadcaster VRT did increase its portfolio of races being broadcast live by a Long-term trend (> 5 years) Up
third in 2019: from 32 to 43. It is now higher than ever before. Most of the newly
broadcast races were smaller Belgian races from the Bingoal Cycling Cup, previously
aired by commercial broadcaster VTM. Obviously, the number of live cycling
broadcasts on VRT (races can have multiple days of racing) increased as well, from
103 to 119. This is 31 less than the record 150 cycling broadcasts in 2008 when still
all three Grand Tours (63 broadcasts!) were being covered live by VRT. The focus on
one‐day races (37 in total) is remarkable. Only 6 stage races are still broadcast by
VRT: the Tour de France, the Vuelta a España, the Belgian stage races Baloise
Belgium Tour and the Binckbank Tour, and the two French stage races Paris‐Nice
and Critérium du Dauphiné.
• There were 3 more notable cycling broadcasts on VRT. The live coverage of the
successful world hour record attempt by Victor Campenaerts was watched by over
400.000 Flemish TV viewers while the ceremonial team presentation at the start of
the Tour de France attracted 309.000 cycling fans. But the most remarkable result
was the viewership for a rerun of the 2018 Strade Bianche. Over 306.000 persons
watched the 2018 race again, which is more than the TV audience for the live
broadcast of the 2019 edition in many countries.
• After losing the broadcasting rights of the Bingoal Cycling Cup, VTM reduced its live Average TV-viewership % change 2019
cycling broadcasts from 12 to just 2: the RCS races Milan – San Remo and the Giro
di Lombardia. For both races, audiences were low compared to previous years. Tour de France +33%
• Like in many other European countries, Eurosport covered up to 100 cycling races in Other races (20 up / 10 down) +10%
Flanders. In addition, a small number of races was broadcast on pay sports channel
Telenet Play Sports. For both channels no TV audience data were made public but,
except for the Giro d’Italia, they are in the tens of thousands only.Races on public channel VRT / Sporza 2019 2018 % change 2017 2016 2015 2014 2013 2012 2011 2010 2009
Ronde van Vlaanderen
Paris - Roubaix
1.072.321
1.006.965
1.218.348
919.202
-12%
10%
1.095.333
1.003.874
993.842
923.765
1.143.414 1.106.714 1.066.564
1.006.658 867.947 826.472
933.168
912.107
1.165.306 1.108.291
667.759 1.147.525
800.652
801.206
TV-AUDIENCE
DASHBOARD
World Championships: Road race 830.560 552.335 50% 520.149 718.132 599.139 358.917 502.117 595.977 275.705 139.406 357.453
Omloop Het Nieuwsblad 777.946 718.417 8% 738.799 728.145 680.047 853.295 887.021 705.293 841.900 709.214 621.995
Kuurne - Brussel - Kuurne 742.753 694.566 7% 808.605 788.890 899.574 691.610 675.780 674.623 865.008 570.088
Liège - Bastogne - Liège 732.108 520.358 41% 594.418 905.423 869.238 608.643 669.197 887.348 637.056 602.557 523.416
FLANDERS (2)
Gent - Wevelgem 694.477 698.478 -1% 738.666 950.072 1.083.315 605.170 1.084.892 436.684 492.082 764.245 528.489
National Championships Belgium: Road race 580.160 343.084 69% 617.072 414.439 600.755 682.037 880.773 786.010
Strade Bianche 547.440 614.835 -11% Eurosport 403.600 345.538 325.007 338.516 313.279
Amstel Gold Race 516.484 660.653 -22% 835.807 603.483 730.762 632.385 525.991 728.963 536.985 449.072 468.361
European Championship: Road race 441.400 379.796 16% 230.802 310.865 VRT - Special race broadcasts 2019
World Championships: ITT race 436.007TV-AUDIENCE DASHBOARD FRANCE
Channel Races 2019 2018 % change 2017
La chaine l'Équipe Strade Bianche 534.000
France 3 Paris - Nice: étape 7 907.000
France 3 Paris - Nice: étape 8 1.140.000
La chaine l'Équipe Milano - Sanremo 891.000 600.000 49% 500.000
France 3 Ronde van Vlaanderen 1.125.000 850.000 32% 1.170.000
France 3 Paris - Roubaix 1.930.000 2.250.000 -14% 1.710.000
France 3 Liège - Bastogne - Liège 1.460.000 1.140.000 28% 916.000
France 3 Amstel Gold Race 743.000
La chaine l'Équipe Brabantse Pijl 293.000 231.000 27%
France 3 Critérium du Dauphiné: étape 8 1.300.000
Eurosport Critérium du Dauphiné (all stages) 106.000
Eurosport National Championships: France 147.000
La Chaine l'Equipe Mont Ventoux dénivelé challenge 410.000
France 3 World Championships: RR men 1.103.000 1.340.000 -18%
France 3 Bretagne Classic 561.000
Average comparison 1.133.667 1.068.500 6%
Comparison Spring Monuments 1.351.500 1.210.000 12% 1.074.000 Short‐term trend (1 year) France 2: Up France 3: Up
Average TV-viewership % change 2019 Medium‐term trend (5 years) France 2: Stable France 3: Stable
Long‐term trend (> 5 years) France 2: Stable France 3: Stable
Tour de France +12% (Fr. 2) / +14% (Fr. 3) / +45% (ES)
Other races (4 up, 2 down) +6%
Key insights:
• The French cycling fan is amongst the best served in the world. On free‐to‐air TV
(France Télévisions + La chaine l’Équipe) over 60 races can be watched while pay
channel Eurosport offers an even larger (but largely non‐exclusive) package. This
evolution resulted in significantly higher TV interest in cycling in recent years (before
2017 many races were exclusively shown on the BeIN sports channel for TV
audiences of less than 100.000 viewers).
• French Tour de France TV audiences recovered from the 2018 all time low and were
12% to 14% up on France 2 and France 3 in 2019. On Eurosport, viewership even
increased by 45%. Viewership for the other races was much stronger as well. In spite
of a loss of 320.000 viewers for Paris‐Roubaix, the 4 Spring Monuments averaged CALL FOR HELP: French TV
12% more TV viewers than in 2018 and even 26% more than in 2017. Meanwhile, the audience data for professional
men’s World Championships road race lost 18% of its audience this year. road cycling races are extremely
• While Tour de France stages average a market share of 40%, classics races only hard to find. If anyone can help,
manage a market share of 10 to 15% in France. This is much lower than in many please get in touch with me.
other countries. Paris‐Roubaix, for example, had a 16,2% market share in France,
while in the Netherlands it is 40% and in Flanders it has been up to 80% in the past.TV-AUDIENCE DASHBOARD GERMANY
Key insights:
• In Germany, live TV broadcasts of professional
cycling races are almost exclusively on Short-term trend (1 yr) ARD: Up
Eurosport, with only the Tour de France, the
Deutschland Tour and a couple of German Medium-term trend (5 yrs) ARD: Up
races (also) on ARD (public TV). However, in
2019, for the first time in many years, Paris‐ Long-term trend (> 5 yrs) ARD: Down
Roubaix was again broadcast live by ARD.
• The Tour de France TV audience for public
broadcaster ARD grew by 5% and was even a
fraction higher than for the successful 2017
edition with the Düsseldorf Grand Départ. It
was in fact the best‐watched edition of the
decade and the third‐best watched in the post
Ullrich era. We found no information on Tour
de France TV audiences for the digital public
channel One that broadcasts large parts of Tour
de France stages as well.
• In addition to the Tour de France TV audience
information, for only two more road cycling
broadcasts on ARD viewership information was Average TV-viewership % change 2019
found: 920.000 TV viewers for Paris‐Roubaix
and 570.000 for the German Eschborn‐
Frankfurt classic. The market share for both of Tour de France +5% (ARD)
these races was about 5%.
• We did not manage to find any TV audiences Other races Not enough data to compare
for cycling broadcasts on German Eurosport for
2019, not even for the Tour de France. But from
historical data we know such broadcasts usually CALL FOR HELP: German TV audience data for professional road
have an average audience of 100.000 to cycling races are extremely hard to find. If anyone can help, please
200.000 viewers, with the Tour de France
audience being about twice as big. get in touch with me.You can also read