The Weekly Focus A Market and Economic Update - 4 June 2018 - Stanlib
←
→
Page content transcription
If your browser does not render page correctly, please read the page content below
The Weekly
Focus
A Market and Economic Update
4 June 2018
Contents
Newsflash ..................................................3
 Market Comment ...................................................................................................................... 3
 Other Commentators ............................................................................................................... 4

Economic Update ......................................7
Rates .......................................................12
 STANLIB Money Market Fund............................................................................................... 12
 STANLIB Enhanced Yield Fund............................................................................................ 12
 STANLIB Income Fund .......................................................................................................... 12
 STANLIB Extra Income Fund ................................................................................................ 12
 STANLIB Flexible Income Fund ........................................................................................... 12
 STANLIB Multi-Manager Absolute Income Fund................................................................ 12
Newsflash
As bad as May was for our market and most EM, June has started very well
with the ALSI +3.2% so far in June
Market Comment
The global share index, the MSCI World Index, gained +0.7% in May in dollars to be +0.8%
so far in 2018 (total return) and +12.2% over the past 12 months.
The US S&P 500 Index gained +2.4% in May to be +2% in 2018, while the Nasdaq 100
Index gained a highly impressive +5.7% in May to be +9.5% in 2018, the best of the
lot…and +21.7% over the past 12 months! The S&P 500 is +14.4% over the past 12
months.
Partly because of weaker currencies (except China) and partly because of risk aversion
with money leaving emerging markets, the MSCI Emerging Markets Index fell -3.5% in
dollar terms in May to be -2.5% in 2018 and +14.4% over the past 12 months.
The MSCI China Index (31% of the MSCI EM Index, by far the biggest) was the best EM in
May, returning a positive +1.9%, while the MSCI Brazil Index was the worst with -17%.
The rand lost -1.8% versus the dollar in May to be -2% in 2018, but still +3.7% over the past
12 months.
But the rand gained +1.8% versus the euro in May (flat in 2018) and gained +1.7% versus
the pound to be -0.8% in 2018.
Along with most emerging markets, the JSE ALSI lost -3.5% in rands in May to be -4.4% in
2018 (including dividends), but +8% over the past 12 months.
The All Bond Index lost -1.95% in May as bond yields rose (foreign selling), but remains the
best asset class in SA so far in 2018 with a return of +5.2% (+10.4% over the past 12
months).
Foreign investors sold R30bn of SA bonds in May and are now -R5.5bn in 2018.
SA Listed Property lost -5.9% in May to be -18.5% in 2018 and -6.4% over the past 12
months.
Cash gained +0.6% in May to be +3% so far in 2018 and +7.4% over the past 12 months.
The ALSI 40 Index lost -3.1% in May to be -4% in 2018, while the JSE Mid-Cap Index got
hit in May, losing -8.4% to be -8.3% so far in 2018. The JSE Small-Cap Index fell -2.4% in
May to be -2.5% in 2018, so is the best of the three.
While General Retailers lost -12.6% in May, General Industrials lost -12%, Food Producers
-11%, Banks -7% and Life Insurers -7%.
Banks are -2.3% in 2018, but still +32% over the past 12 months. General Retailers are
also still +18.3% over the past 12 months, despite losing -12.6% in May.
Mining (+4% in May and +8.5% in 2018) and Resources (+3.8% in May and +8.4% in 2018)
did well in May.
Naspers fell -1% in May to be -12.3% in 2018 and +11.7% over the past 12 months.
As bad as May was for our market and most EM, June has started very well with the ALSI
+3.2% so far in June (-2.8% now in 2018, including dividends), although it is still trading at
last October levels, but that was +12% up from June 2017 levels.
Naspers is up an amazing +8.6% so far in June at its highest level since March. It is up
+2.7% so far today, Monday, after jumping +6.2% on Thursday/Friday.
RMB Morgan Stanley says the good news is SA share valuations are now at 3 year lows.
SA equity consensus 12-month forward PE ratios are now at 14.5 times for the ALSI and
14.4 times for the MSCI SA Index.
There have recently been small upgrades to forward SA earnings for the first time in 5
months, mostly thanks to Resources though, in particular Sasol.
Sasol is +5.9% so far in June and +14.5% in 2018 at a 2 year high. Of course, unfortunately the petrol price is to rise by +5.5% tomorrow to a record high, nice
for Sasol, but not good for South African consumers. Both the weaker rand and the higher
dollar oil price are to blame.
The dollar oil price is +15.2% so far in 2018 at its highest level in 3.5 years, while the rand
oil price is +17.3%.
The big question on currencies now concerns the future movement of the US dollar. The
dollar has jumped from $1.25 to the euro back in February to $1.15 last week (now down a
bit at $1.173). This has caused trouble for emerging markets and for commodities, except
oil.
Hopefully the dollar is now turning weaker after this big run. This may coincide with a
revival in the European and Japanese economies.
On the US stock market the IT sector rose by +3% last week to be +11.2% so far in 2018,
followed by Consumer Discretionary +7.9% and Energy +5.7%, then Health Care +0.8%.
All other seven sectors are negative in 2018, including Financials at -1.5%.
Meanwhile the smaller share index, the Russell 2000 Index of 2,000 shares, has been
hitting record highs of late, beating the bigger shares. Since end April this index is +6.3%
and that is in stronger dollars too.
It is a good sign for the US economy and market when the smaller shares are leading the
way, because they are more sensitive to the economy than the bigger shares.
Now……we just need our smaller shares (and mid-caps) to start rising……in anticipation of
a pickup in our economy.
The SA Listed Property Index, that had such a difficult May (-5.9%), hit bottom in early April
before bouncing - and almost sank to that level again at end May.
Despite issues out there (weak economy, too many shopping malls and Edgars looking to
close down as much as 30% of its floor space), the chart is showing some early signs of
having formed a “double bottom” (early April and late May), implying that a recovery is
possibly and hopefully now on the cards.
The index is +2.1% so far in June.
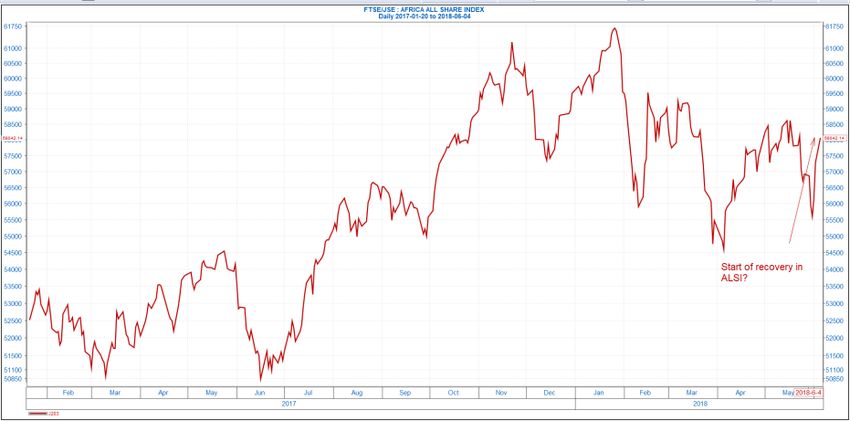
Below we show a chart of the JSE ALSI. The chart shows what is hopefully the ‘green
shoots’ of a recovery. It’s about time - after 5 months of messing around in negative
territory.
Source: I-Net Bridge
Other Commentators
US Market Analyst, Elaine Garzarelli
Garza’s quants model remains bullish at 73.5% (a level below 30% would be a bearish
signal).
The S&P 500 Index is currently down -4.8% from its record high on 26th January, but is
+2.3% in 2018.
Concerns about Italian debt are the latest on investors’ minds. Garza recommends full exposure to shares and believes corrections will be limited.
She would be concerned about a steeper correction - or bear market - if the fed raises rates
aggressively, thereby engineering a recession.
The minutes from the May Fed meeting indicate that the fed funds rate in the near future
will rise and continue rising at a gradual pace for the next 2 years.
The minutes indicate that the upper end of the funds-rate target will reach 2.5% in
December and rise above 3% in 2019.
Using 2018’s earnings forecast of 156 for the S&P 500 Index and the model’s forecast of a
fair PE ratio of 18 times, fair value for the index is 2,808, or +2.8% above current levels.
Garza’s higher earnings forecast for 2019 will cause the S&P 500 index valuation levels to
be higher (from next month).
Meanwhile Italian politics are in flux and a confrontation between a populist government
and Brussels over the terms of Italy’s membership in the euro is likely.
Italy’s poor economic performance is partly the reason for its political turmoil. Italy’s real
GDP was up only +1.4% year-on-year in the 1st quarter versus the +2.3% for Germany’s
GDP.
Also Italy’s GDP is -5.5% below its prior peak a decade ago. In comparison, Germany is up
+12% and the US is up +16%.
The latest US unemployment rate of 3.8% is the lowest in 49 years, since December 1969!
This economic expansion in the US has had solid growth with restrained inflation - an ideal
scenario for the economy.
US first quarter real GDP growth was revised down 0.2% to 2.2%, while second quarter
GDP is projected at 3.6%.
Inflation remains low around the world, with year-on-year core CPIs in Tokyo up just +0.1%,
Eurozone +0.7%, Malaysia +1.4%, Hong Kong +1.8% and the UK +2.1%. However, rising
gasoline prices will push global inflation higher.
The Conference Board’s Consumer Confidence Index that measure consumers’ views of
the present situation rose to the highest levels in 17 years.
Economic stimulus continues in terms of consumer and company tax cuts, tax repatriation
(which will bring back overseas profits from US companies), deregulation and government
spending, which is unprecedented for this point in the economic cycle.
Stimulus is likely to continue with the house vote to roll back financial restraints, raise
government spending and Trump indicating he will propose new tax cuts.
BCA Research
The dollar’s recent gains are not yet a threat to US company profits or the stock market.
BCA thinks the dollar will advance by another 5% in the next 12 months. This would trim
company earnings by about 1-2%, although most of this would occur in 2019.
BCA’s view is that the slowdown in economies outside of the US is not the start of a more
significant downturn.
Monetary policy is still accommodative worldwide, US fiscal policy (government spending)
is loose and governments outside the US are no longer tightening policy.
So a big slide in global growth is unlikely and by the end of the summer global growth will
probably re-accelerate, which will be good for equity markets.
This could set the scene for a blow-off rally in shares.
Despite expecting the dollar to gain over the next 12 months by just 5%, BCA thinks most
of the dollar’s gains are over.
BCA thinks trade-related uncertainty will probably continue until the midterm November
elections.
Meanwhile BCA expects three more rate hikes this year in the US. They believe the US
economy and market can withstand further rate hikes. Neither economic nor financial
imbalances are especially elevated, while fiscal stimulus (government spending and tax
cuts) will offset much of the sting from tighter monetary policy.
But a stronger dollar has been undermining emerging markets, which are already under
pressure from slower Chinese growth and the looming prospect of trade wars. The Italian issue is hurting the euro because the Italian government debt market is the
biggest in Europe and the 4th biggest in the world after the US, Japan and China.
The Italian 10-year yield is up +1% since the middle of April. There are concerns that Italy
may in time wish to leave the euro. The stress in Europe from Italy is unlikely to fade soon.
Italian public support for the euro is lower than elsewhere.
Paul Hansen
Director: Retail InvestingEconomic Update 1. SA trade account recorded a surplus of only R1.14 billion in April 2018, below market expectations. The growth in SA’s exports has slowed meaningfully in the first four months of 2018. 2. SA petrol price to increase by 82c/l on 6 June 2018. The increase reflects the combination of a weaker exchange rate and a higher oil price. Another reason for the Reserve Bank to keep rates on hold. 3. ABSA PMI dipped back to just below the neutral 50-point mark to 49.8 index points in May 2018. 4. US added a further 223 000 jobs in May, above expectations. Unemployment rate fell to 3.8%, while wages rose 2.7%y/y. Solid labour market report, except for the lower labour market participation rate. 5. Central Bank of Kenya keeps rates on hold. A theme that is building across the SSA region. 6. Ghana cuts interest rates by an aggressive 100 basis points, however the window for further cuts is closing. 1. In April 2018, South Africa’s trade balance recorded a surplus of R1.14 billion. This compares with a revised trade surplus of R9.3 billion in March 2018 and market expectations for a surplus of around R4.7 billion. The monthly trade data is notoriously difficult to forecast accurately, especially since the data is not seasonally adjusted and prone to revisions. Although South Africa has recorded a trade surplus in ten out of the past twelve months, which is an impressive turnaround relatively to prior years, the size of the surplus has tended to narrow in recent months. During April 2018 exports declined by a massive –R9.6 billion (-9.8%m/m), while imports fell by a more modest –R1.4 billion. The decline in exports was broad-based and included a –R2.16 billion fall-off in vehicle exports, a –R1.38 billion drop in metal exports, a –R1.29 billion decline in coal exports and a –R1.26 billion slump in exports of precious metal. The drop in imports during April 2018 included modest declines in textiles, metals, chemicals and vehicle. This was partly offset by R1.45 billion rise in imports of oil. For 2017 as a whole South Africa’s trade surplus totalled an incredible R78.74 billion, compared with a mere R17.2 billion in 2016. The surge in South Africa’s trade surplus during 2017 clearly helped to support the Rand, especially towards the year. In contrast, during the first four months of 2018 South Africa’s trade account has recorded a deficit of – R17.7 billion, negatively impacted by the massive trade deficit in the first month of 2018. The average annual growth in imports over the past twelve months is 4.6%, although in the first four months of 2018, this has risen to annual average of 7.1%. The latest acceleration in imports, albeit off a low base, partly reflects the run-down of inventories during 2017. This will provide some relief to the fiscal authorities in terms of generating additional tax revenue (import duties). In contrast, over the past four months, exports have achieved an annual growth rate of only -0.1%, highlighting the more recent softening of global trade and the potential negative impact of additional trade protection measures around the world. In summary, it is fair to argue that the South African economy benefited – at least to some extent – from the buoyancy in the world economy in recent years, partly through an increase in exports. This was reflected in a narrowing of South Africa’s current account deficit to less than 3% of GDP a few years ago, remaining reasonably under-control since then. However, as the South African economy gains some momentum in 2018/2019 and level of global trade protection escalates, export growth is likely to remain sluggish and imports are likely to rise. This should lead to a modest widening of South Africa’s current account deficit to well over 3% of GDP by end 2018.
2. The Department of Energy announced that the petrol price for both grades of
   petrol 93 and 95 ULP and LRP will increase by a massive 82c/l with effect from
   Wednesday, 6 June 2018. The latest announcement means that the price of 95
   Octane (LRP, Gauteng) will now cost R15.79 per litre. This is the highest petrol price
   ever recorded in South Africa. The price of diesel (0.05% Sulphur) will increase by 85c/l
   while diesel (0.005% Sulphur) will increase by 87c/l. Paraffin will rise by R1.09/l (retail
   price), and gas will jump by a substantial 138c/kg.

   The latest surge in the petrol price reflects the combination of a higher oil price as well as a
   weaker exchange rate. In total, the weaker exchange rate added 30c/l to the monthly
   increase in the petrol price, while the higher oil price contributed the remaining 52c/l. (The
   oil price averaged $77/barrel in May compared with an average of $71/barrel in April.
   Similarly, the average Rand/US Dollar exchange rate for the period 25 April 2018 to 31 May
   2018 was R12.51 compared to R11.97 during the previous period. Back in April some
   financial market participants had expected the Rand to strengthen despite the US
   continuing to increase interest rates and US inflation moving somewhat higher – this might
   lead to a modest update revision to the consensus SA inflation forecast).

   The latest fuel price hike means that in the past three months the petrol price has increased
   by a very substantial R2.03c/l, after declining by R1.00/l in the preceding three months.
   Over the past year, the petrol is up R2.25/l or 16.6% (i.e. the cost of filling a 60 litre tank of
   petrol has increased by R135). The latest price increase will add a meaningful 0.3
   percentage points to the monthly inflation rate in June. This, together with the recent 1
   percentage point increase in the VAT rate, highlights that SA consumer inflation has started
   to drift higher, after reaching a lower turning point of 3.8%y/y in March 2018. The economic
   team currently expects SA consumer inflation to increase to above 5.5% in the final quarter
   of 2018 and the Reserve Bank to keep rates on hold for the remainder of the year.

   Lastly, while SA consumer spending remains a key underpin to SA’s economic growth
   forecast in 2018, a couple of factors have dampened the outlook somewhat including a
   range of tax increases in the February National Budget, larger than expected hikes in the
   petrol price, no further cuts in interest rates, subdued growth in household credit and a
   sluggish labour market.

3. The seasonally adjusted ABSA Purchasing Managers’ Index (PMI) slipped back by
   1.1 index points to 49.8 index points in May from 50.9 in April 2018 which brings the
   index back to just below the neutral 50-point mark.

   Among the PMI’s sub-components in May, the new sales orders index declined by 5
   points from 56.5 to 51.5 suggesting that exports decreased during the month. The business
   activity index declined to 47.2 from 49.1 index points in April. The apparent inability of
   output growth to gain traction is somewhat disappointing but should new sales orders be
   sustained at current levels, output should tick up in the coming months. Purchasing
   Commitments decreased to 45.0 from 48 in the previous month. The employment index
   edged slightly lower from 49.5 in April to 49.2 in May. The index tracking expected
   business conditions over the next six months’ time declined to 65.3 from 69.6. The
   purchasing prices index moderated in May to 65.5 from 66.9 despite an, on average
   weaker rand exchange rate and a higher Brent crude oil price.

   Inventories rose for a second month in a row in May and reached 49.4 index points from
   46.4 in April which is the highest level since March 2017. Despite the 3 point increase, the
   index is still below the new sales orders index which means that the PMI leading indicator is
   above 1, which usually bodes well for output growth going forward.
Overall, the latest decrease in the PMI reading is a little discouraging; however,
   despite the fall-off in the index, the average level of 50.4 points recorded during the
   first two months of the second quarter is not only above the neutral 50-point mark,
   but also higher than the 49.2 index points registered in the first quarter. With Cyril
   Ramaphosa continuing his pledge to fight corruption and implement reforms,
   optimism for an improved South African economy should remain relatively positive.

4. In May 2018, the US unemployment rate fell further to 3.8%. This was fractionally better
   than market expectations, which was for the unemployment rate to remain unchanged at
   3.9%. The US unemployment rate is at its lowest level since early 2000. Unfortunately, the
   labour market participation rate edged lower to 62.7% from 62.8%. Overall, the participation
   rate remains extremely low on a trend basis, which means that the decline in the
   unemployment rate is still somewhat misleading given that the participation rate remains
   well below its historical average.

   Non-farm payrolls rose by a robust 223 000 jobs in May 2018, which was above
   market expectations for an increase of 190 000 (Bloomberg). Over the past 6 months,
   job gains have averaged a remarkable 202 000 per month. The level of US employment is
   an impressive 10.0 million above the peak prior to the global financial market crisis. During
   the financial market crisis the US lost a total of 8.7 million jobs. Consequently, the US has
   created well over 18 million jobs since the financial crisis ended. The payroll data for
   March and April 2018 was revised up by a combined 15 000 jobs.

   The private sector gained 218 000 jobs in May 2018, after gaining a revised 162 000 jobs in
   April 2018. The private sector had gained employment in each of the past 99 months at an
   average of 193 000 jobs a month and is at a record high, comfortably surpassing the
   previous peak in January 2008.

   In May 2018, average hourly earnings for all employees on private nonfarm payrolls rose by
   8 cents to $26.92. Over the year, average hourly earnings have increased by 71 cents,
   or 2.7%. The growth in US wages remains modest given the low unemployment rate,
   record number of job openings and ongoing rate of monthly job gains. However, wages are
   expected to continue to trend higher, leading to a sustained upward bias in consumer
   inflation and interest rates. In that regard it is interesting to see that the number of job
   openings now exceeds the number of people that are unemployed.

   Overall, the latest US labour market report is solid, with gains in almost every key
   area of measurement, except the labour market participation rate. The trend growth in
   the labour market coupled with solid business activity data, strong confidence indicators, as
   well as Trump’s fiscal stimulus package, should encourage the Federal Reserve to continue
   to hike interest rates. Especially since the US inflation rate is now up at 2.5% and expected
   to maintain a slight upward bias over the coming months given the higher oil
   price. Consequently, we expect the US Federal Funds Target Rate to increase at least two
   or possibly three more times in 2018, and by 25bps on each occasions, with the next rise
   taking pace in June 2018.

5. The Monetary Policy Committee of the Central Bank of Kenya decided to leave
   interest rates unchanged at 9.5% at their meeting last week. The bank made the
   decision on the basis that the 50 basis point cut from the previous meeting in March is still
   to be fully transmitted. They also further commented that inflation expectations were well-
   anchored within the target range. The market was expecting a 25 basis point cut even
   though it was really unclear the decision the bank would take. This is even as inflation is
   well within control, credit extension in the private sector is low and the economy had its
   weakest annual growth figure in 5 years in 2017.
Inflation dropped to 3.7% in April 2018 from 4.2% in March and was the lowest reading
   in nearly 4 years. This was driven by lower food prices as weather conditions continued to
   improve from last year’s drought, even though that has now turned to floods in some
   regions. Recent surveys point toward the possibility of inflation moderating even further.
   Even though higher oil prices were driving energy inflation higher other items were well
   within the 5% ±2.5% target range on aggregate.

   The current account deficit narrowed to 6.1% of GDP by the end of the first quarter of
   the year. This is down from the 6.7% recorded in 2017 and is expected to narrow further as
   capital imports are expected to decline as the Standard Gauge Railway project is nearing
   completion. There is a risk however that the increase in oil prices could derail the
   improvements and increase the import bill meaningfully.

   Foreign Exchange Reserves in Kenya are still at all-time highs at USD 9 Billion which
   equates to 6.1 months of import cover. The precautionary arrangement with the IMF
   adds an additional buffer to the tune of USD 989 million.

   Worryingly private sector credit extension still remains low at 2.8%, slightly higher
   than the 2.1% recorded in February 2018 however still way off from the 20% growth
   rates recorded in the year before the interest rate caps. The Transport and communication
   sectors recorded negative credit growth. This is having a negative effect on the banking
   sector as NPL ratios increased to 12.4% in April 2018 from 11.4% in February. This could
   also be attributed to government arrears build-up to contractors.

   Even though inflation is below the mid-point the central bank felt that the interest rate cap
   regulation had created perverse outcomes for monetary policy. By placing a maximum limit
   on lending rates and a minimum on deposit rates monetary policy objectives become
   nullified by having the reverse effect of lowering credit extension. A higher interest rate
   increases eligibility for credit which now has the reverse effect of increasing credit
   extension. So calling the direction of interest rates in Kenya has become uncertain however
   the bias is still to the downside.

   There has been a change in rhetoric amongst central banks in the Sub-Saharan
   Africa (SSA) region and many are pulling back from monetary policy easing. This is
   likely to have been prompted by the more hawkish stance by developed markets and
   the waning momentum of the search for yield. It is likely that we are close to
   reaching or have reached the end of the interest rate easing cycle for SSA as central
   banks try to limit the risk of capital outflows.

6. The Bank of Ghana’s Monetary Policy Committee decided to cut its interest rate by an
   aggressive 100 basis points to 17%. The committee felt that the risks to the inflation outlook
   are subdued within the forecast horizon whilst the real interest rate is still high.
   The decision was weighted against global credit conditions - which were becoming less
   favourable, rising oil prices as well as a strengthening US Dollars on the downside. On the
   upside, improving domestic fiscal conditions, a current account surplus and declining
   inflation were supportive for a cut.

   Inflation in Ghana slowed to 9.6% in April 2018 from 10.4% in March. This is the lowest
   inflation has been in 5 years which puts it back within the target range of 6 – 10%. Inflation
   was as high as 19% as recently as 2016. Current inflation expectations suggest that
   inflation could stabilize at current levels. Both consumer and business confidence indices
   are now positive however preliminary data suggests a softer first quarter GDP figure.
   Ghana’s major exports – cocoa, gold and oil recorded higher prices which should continue
   to support the current account. We are still worried about the debt to GDP figure which has
   moderated but is still high at 60%. The improved exports as well as Eurobond issuances
   have helped gross international reserves to climb to $6.9 Billion which equates to 3.8
   months of import cover.
Ghana’s real rate is still high at 7.4 percentage points so there is some room for further
cuts. However further monetary policy easing is expected to slow in Sub-Saharan Africa
Markets with the normalization exercise in developed markets. To limit the amount of
capital outflow Ghana could also halt its interest cuts especially considering that the
majority of its debt is denominated in foreign currency.

Please follow our regular economic updates on twitter @lingskevin

Kevin Lings, Laura Jones & Kganya Kgare
(STANLIB Economics Team)
Rates
These rates are expressed in nominal and effective terms and should be used for
indication purposes ONLY.

  STANLIB Money Market Fund
  Nominal:                                                      6.50%
  Effective:                                                    6.70%

STANLIB is required to quote an effective rate which is based upon a seven-day rolling average yield for Money Market
Portfolios. The above quoted yield is calculated using an annualised seven-day rolling average as at 1 June 2018.
This seven- day rolling average yield may marginally differ from the actual daily distribution and should not be used
for interest calculation purposes. We however, are most happy to supply you with the daily distribution rate on request,
one day in arrears. The price of each participatory interest (unit) is aimed at a constant value. The total return to the
investor is primarily made up of interest received but, may also include any gain or loss made on any particular
instrument. In most cases this will merely have the effect of increasing or decreasing the daily yield, but in an extreme
case it can have the effect of reducing the capital value of the portfolio.

  STANLIB Enhanced Yield Fund
  Effective Yield:                                              7.79%

STANLIB is required to quote a current yield for Income Portfolios. This is an effective yield. The above quoted yield
will vary from day to day and is a current yield as at 1 June 2018. The net (after fees) yield on the portfolio will be
published daily in the major newspapers together with the “all-in” NAV price (includes the accrual for dividends and
interest). This yield is a snapshot yield that reflects the weighted average running yield of all the underlying holdings
of the portfolio. Monthly distributions will consist of dividends and interest. Interest will also be exempt from tax to the
extent that investors are able to make use of the applicable interest exemption as currently allowed by the Income Tax
Act. The portfolio’s underlying investments will determine the split between dividends and interest.

  STANLIB Income Fund
  Effective Yield:                                              8.38%
  STANLIB Extra Income Fund
  Effective Yield:                                              7.91%
  STANLIB Flexible Income Fund
  Effective Yield:                                              6.20%
  STANLIB Multi-Manager Absolute Income Fund
  Effective Yield:                                              7.20%

Collective Investment Schemes in Securities (CIS) are generally medium to long term investments. The value of
participatory interests may go down as well as up and past performance is not necessarily a guide to the future. A
schedule of fees and charges and maximum commissions is available on request from the company/scheme. CIS can
engage in borrowing and scrip lending. Commission and incentives may be paid and if so, would be included in the
overall costs.” The above quoted yield will vary from day to day and is a current yield as at 1 June 2018.

For the STANLIB Extra Income Fund, Fluctuations or movements in exchange rates may cause the value of underlying
international investments to go up or down. The historical yield over the last 12 months is reported for the STANLIB
Multi-Manager Absolute Income Fund.
Disclaimer
The price of each unit of a domestic money market portfolio is aimed at a constant value. The total return to the investor
is primarily made up of interest received but, may also include any gain or loss made on any particular instrument. In
most cases this will merely have the effect of increasing or decreasing the daily yield, but in an extreme case it can
have the effect of reducing the capital value of the portfolio. Collective Investment Schemes in Securities (CIS) are
generally medium to long term investments. The value of participatory interests may go down as well as up and past
performance is not necessarily a guide to the future. An investment in the participations of a CIS in securities is not
the same as a deposit with a banking institution. CIS are traded at ruling prices and can engage in borrowing and scrip
lending. A schedule of fees and charges and maximum commissions is available on request from STANLIB Collective
Investments (RF) (Pty) Ltd (the Manager). Commission and incentives may be paid and if so, would be included in the
overall costs. A fund of funds is a portfolio that invests in portfolios of collective investment schemes, which levy their
own charges, which could result in a higher fee structure for these portfolios. Forward pricing is used. Fluctuations or
movements in exchange rates may cause the value of underlying international investments to go up or down. TER is
the annualised percent of the average Net Asset Value of the portfolio incurred as charges, levies and fees. A higher
TER ratio does not necessarily imply a poor return, nor does a low TER imply a good return. The current TER cannot
be regarded as an indication of future TERs. Portfolios are valued on a daily basis at 15h00. Investments and
repurchases will receive the price of the same day if received prior to 15h00. Liberty is a full member of the Association
for Savings and Investments of South Africa. The Manager is a member of the Liberty Group of Companies.

As neither STANLIB Wealth Management (Pty) Limited nor its representatives did a full needs analysis in respect of
a particular investor, the investor understands that there may be limitations on the appropriateness of any information
in this document with regard to the investor’s unique objectives, financial situation and particular needs. The
information and content of this document are intended to be for information purposes only and STANLIB does not
guarantee the suitability or potential value of any information contained herein. STANLIB Wealth Management (Pty)
Limited does not expressly or by implication propose that the products or services offered in this document are
appropriate to the particular investment objectives or needs of any existing or prospective client. Potential investors
are advised to seek independent advice from an authorized financial adviser in this regard. STANLIB Wealth
Management (Pty) Limited is an authorised Financial Services Provider in terms of the Financial Advisory and
Intermediary Services Act 37 of 2002 (Licence No. 26/10/590).

Compliance No.: HX2978

17 Melrose Boulevard, Melrose Arch, 2196
P O Box 202, Melrose Arch, 2076
T: 0860123 003 (SA Only)
T: +27 (0) 11 448 6000
E: contact@stanlib.com
Website: www.stanlib.com
STANLIB Wealth Management (Pty) Limited
Reg. No. 1996/005412/07
Authorised FSP in terms of the FAIS Act, 2002 (Licence No. 26/10/590)
STANLIB Collective Investments (RF) (Pty) Limited
Reg. No. 1969/003468/07
You can also read