"Recovery on track" 2021 Outlook - April 19, 2021 Alex Oxenham, CFA Co-Chief Investment Officer - Hilton Capital Management
←
→
Page content transcription
If your browser does not render page correctly, please read the page content below
“Recovery on track”
 2021 Outlook
 April 19, 2021

 PRESENTED BY       Alex Oxenham, CFA
                    Co-Chief Investment Officer

 C O N TA C T U S   1010 Franklin Avenue, Suite 300A
                    Garden City, NY 11530
                    (516) 693-5380
                    info@hiltoncm.com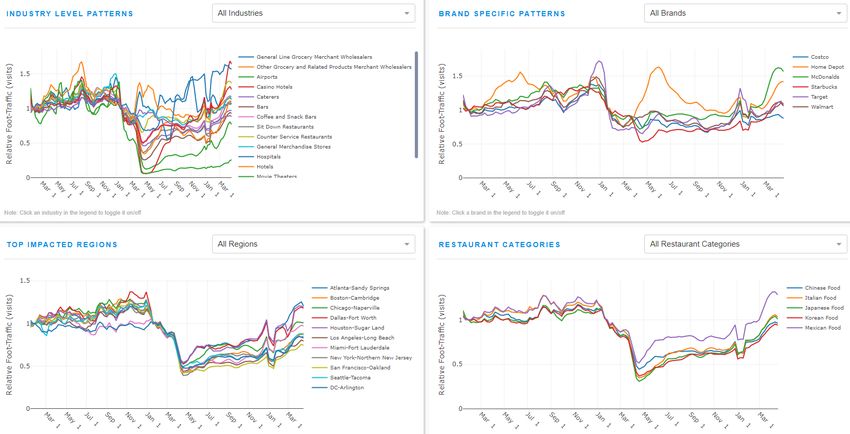
HILTON CAPITAL: 2021 OUTLOOK
Here is our Economic Outlook as of April 19, 2021. It has been 101 days since our last update. Over the past 101 days US & Global economic data has
surged into overdrive especially in the United States. The recovery has been broad-based as the service side of the economy begins to catch up with
the goods side as the vaccine begins to allow for improved mobility. The economy of the United States has been the primary beneficiary carried by an
effective and highly organized vaccination campaign. As movement restrictions are being lifted consumers are eager to catch-up on lost time. Google
search trends for vacations are slowly beginning to displace searches for unemployment. Globally, vaccination campaigns have been mixed and thus
the recovery is slower outside of the United States. The global recovery should be strong but it will lag the recovery we are seeing in our domestic
economy. Another large stimulus package is adding further fuel to the recovery at the same time the economy is beginning to achieve normalization.
The Labor market healing process is picking up steam which is great news for 8.2 million workers still displaced from the Covid recession. We are
optimistic they will be employed within the next 10 months as we expect continued accelerated employment gains in the months ahead.

Over the next two months the economic data is likely to further accelerate to what will quite likely end up being the “peak” for this economic cycle.
Importantly this acceleration will be compared to April and May of 2020 which were effectively disasters thus it will mark some of the best data
we have even seen in our careers. Beyond June the comparisons will get much tougher as we begin to anniversary the start of the initial stimulus
plan and the gradually reopening opening that occurred last summer. We would expect economic data to remain robust later this summer but we
are aware that it is likely to rollover a bit as comparing to one of the sharpest economic recoveries of all time is not a normal occurrence.

Over the past three months we have made only small changes within our portfolio because we’ve fortunately already been constructed very
optimistically. Our allocation to equities continues to remain near maximum levels. We also continue to favor somewhat more cyclical names
over traditional income oriented names. As reopening continues to occur we expect to methodically begin to reposition the portfolio toward our
more traditional state with a focus on less cyclicality and more quality. We continue to believe interest rates are biased higher and while we have a
heightened state of awareness regarding inflation we are not concerned about significant above trend inflation. With elevated levels of money supply
in the financial system coupled with global interest rates essentially cut to zero and expected to remain low for the foreseeable future the environment
remains very constructive for risk taking in the near term.

Newer observations/comments are highlighted in red.

2 Slides Removed / 1 Slide Updated

Page 3- The central tendency midpoint was increased in the March 2021 meeting. Long run GDP projection was increased to 1.90% from 1.85%. Not
really a big deal.

Page 4- ISM Services and Manufacturing indices; are absolutely soaring as a very strong recovery is occurring in the United States. We expect the data
to remain strong and possibly strengthen further into June of 2021. Thereafter we are likely to retrace some of these gains as the economy normalizes.
The market reaction to a slowdown (rate of change) will be interesting.

                                     1010 Franklin Avenue, Suite 300A
                                     Garden City, NY 11530
                                     (516) 693-5380
                                     info@hiltoncm.com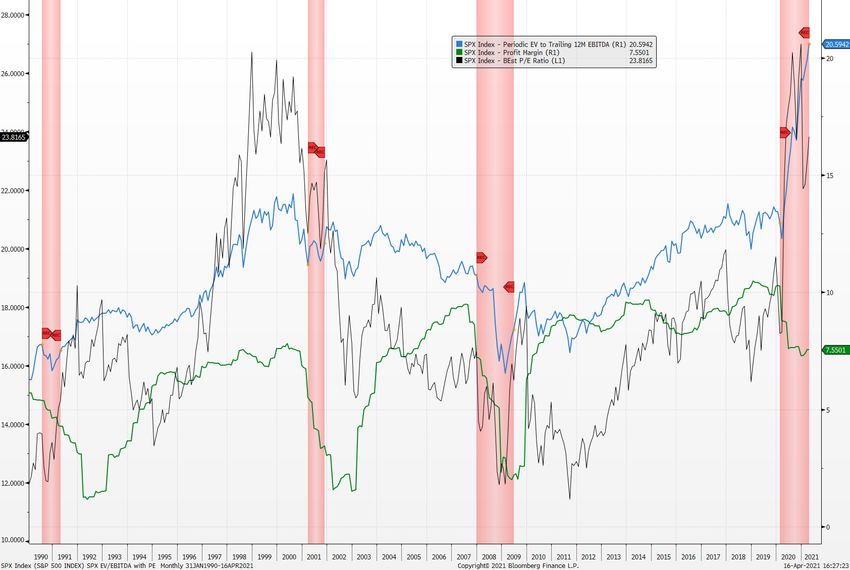
HILTON CAPITAL: 2021 OUTLOOK
Page 5 – ISM manufacturing: Global Manufacturing PMIs - A much stronger rebound in US manufacturing data vs. global data. The US is seeing better
growth than the international segment most likely associated with more fiscal and monetary support from authorities in addition to an effective and
highly organized vaccination campaign taking place.

Page 6- Atlanta FED Q12021 GDP forecast is +8.3%. Q22021 will be even better.

Page 7- GDP estimates from a variety of sources. GDP for 2021 probably comes in around +6.0% to +8.0%. The economy probably full healed itself GDP
wise from the Covid recession at the end of Q12021. Now we need to catch-up for lost time.

Page 8 – Conference Board US leading Indicators immediately contracted signaling a recession. It took than 1 month. This is a very unusual situation as
it usually contracts for an average of 15 months before the onset of a recession. Very quick recovery suggesting the recession is likely already over.

Page 9 - Inflation has bottomed. Inflation should increase significantly in the short term as commodity prices increase and we compare versus the 2020
inflation lows. It’s tough for us to suggest inflation is going to surge over the long-run but within the next six months it will look elevated. We will remain
vigilant in regards to needing to protect against higher levels of sticky long-term inflation.

Page 10- Oil Prices drive inflation expectations. Here you can compare the price of WTI (West Texas Crude) with 10 year Inflation. The correlation
between oil and inflation expectations is strong at times. If oil prices remain firm, as a result of global supply cuts, we may have seen the worst of the
deflationary shock associated with the pandemic. So far it looks like we were correct. From here, oil prices look like they will continue to increase into
the middle of 2021. Inflation break evens are back to 2013 levels.

Page 11- Initial Claims & JOLTS Layoffs and Discharges: Unemployment according to initial jobless claims has been an outlier of negative data since
the pandemic first took place. In the current state the signal it’s giving is dubious at best. State unemployment claims systems were overloaded with
filings on top of obsolete technology systems. They were not designed for a pandemic. Additionally there is massive fraud taking place with bogus
unemployment claims. Case in point, today I received notice that someone filed an unemployment claim on me 5 months ago. Looking at the newly
added data set, JOLTs layoffs and Discharges, there is a much cleaner signal. Employment layoffs have already normalized to 2019 levels and we are
very likely to see very strong employment results through the remainder of the year.

Page 12-US Continuing Jobless Claims- This chart looks at the people who continue to receive unemployment benefits. This chart compares the job
market losses with those during the global financial crisis. With vaccine deployment we should see improvement in this data series in the months
ahead. Improvement has been significant but more work is needed to get back to a more satisfactory level. While still elevated we are making solid
progress toward normalization and the labor market is much stronger this time around versus what we were dealing with after the global financial crisis.

                                      1010 Franklin Avenue, Suite 300A
                                      Garden City, NY 11530
                                      (516) 693-5380
                                      info@hiltoncm.com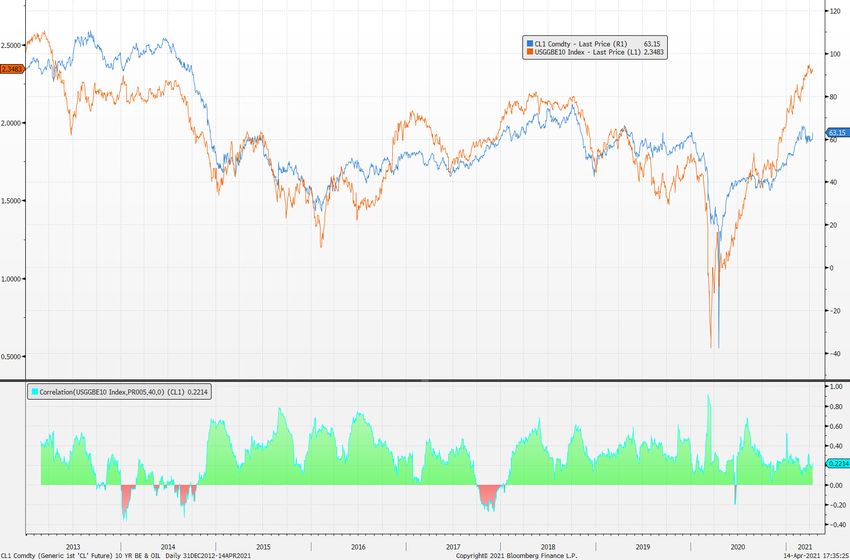
HILTON CAPITAL: 2021 OUTLOOK
Page 13- US Unemployment Permanent Job Losers: This chart looks at the people who have transitioned to permanent joblessness from temporary
unemployment. More permanent job losses will have second order effects of reducing future GDP growth in the years ahead as labor market skills
atrophy for those experiencing extended unemployment. The labor market has exceeded our expectations. Permanent claims are declining and only
ended up being half as bad as during the global financial crisis.

Page 14- Comparing “Job openings” in blue versus actual “Hires” in black. The level of job openings improving will be an early indicator of the labor
market healing. This data series is much more optimistic than the “official” labor market data. After the global financial crisis it took over 7 years for job
openings to reach prior levels. This time around it took 14 months. The labor market looks ready to soar!

Page 15- Labor Participation Rates by Gender: The nature of the pandemic has had a more negative effect on women workforce participation rates. We
suspect fully remote and hybrid schooling is forcing more women than men to leave the workforce. Notice the data series between men and women
begins to widen in August as the school year begins. The damage to female participation is healing fast. This is a great sign.

Page 16- U.S. Small Business Optimism Index. Small Businesses data has improved from the initial dip and is above pre-covid levels. Recent weakness
is centered on labor shortages and government regulation in additional to lingering concerns about Covid.

Page 17- US Average Hourly Earnings of production and non-supervisory employees versus the Year over Year growth rate in non-farm payrolls. Notice
that prior to each of the last six recessions Average hourly earnings (AHE) tend to peak before rolling over. Peak AHE is a late cycle phenomenon. The
last 3 years of declining payroll growth was probably the best indicator of a pending recession. AHE has been boosted by fiscal support while the growth
rate in jobs is still very much depressed. We expect the AHE figured to decline as lower wage workers, who were primarily hurt during covid, get back
into the workforce. It’s more a function of math at this point versus being a negative data point.

Page 18- New single family homes sold in the United States. In the past thirty years a rollover in the number of new homes sold from the “then cycle
high” has preceded every recession by around 1-2 years. Lower interest rates have had significant positive impacts on the number of new single family
homes. The housing market is probably one of the most resilient major segments of the US Economy at the moment. Lower rates, demographics and
de-urbanization should continue to support housing in the coming years. New home construction remains incredibly strong. Strong demand and low
inventory are very positive attributes.

Page 19- Alternative Data- Business Foot Traffic: SafeGraph data provides unique and valuable insights particularly with foot-traffic to businesses and
consumer points-of-interest. Here we show data from recent months on commercial activity (foot traffic trends) compared to the same time period from
previous years to share insights into how the ongoing pandemic is impacting the US economy and disrupting daily life. Massive surge in business foot
traffic associated with vaccination coupled with “stimmy” checks.

Page 20- Alternative Data- Google Trends: Frequency of Google search terms give us an idea of the prevailing conditions in the US Labor Market. Here
we can see that recent searches for vacation are overtaking searches for unemployment. A welcome development.

                                      1010 Franklin Avenue, Suite 300A
                                      Garden City, NY 11530
                                      (516) 693-5380
                                      info@hiltoncm.com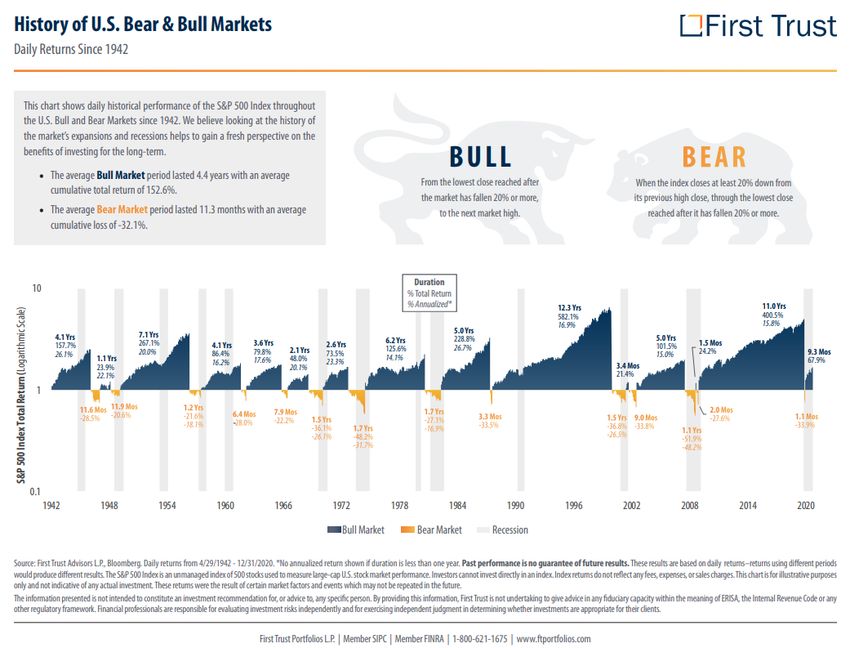
HILTON CAPITAL: 2021 OUTLOOK
Page 21- Alternative Data- OpenTable US Seated Diners: The data looks at aspects of the economic recovery. It highlights the overall impact of Covid
19 on the restaurant industry by showing year-over-year seated diners at a sample of restaurants on the OpenTable network across all channels: online
reservations, phone reservations, and walk-ins. Significant rebound in open table diners is occurring but we still have a long way to go.

Page 22- Dallas Fed Mobility and Engagement Index: summarizes the information in seven different variables based on geolocation data collected from
a large sample of mobile devices to gain insight into the economic impact of the pandemic. Significant rebound in mobility and engagement but we still
have a long way to go.

Page 24– Higher Crude Oil prices encouraged production and then the Pandemic destroyed global demand forcing prices to collapse. Now producers
will cut back supply in a major way as many marginal production companies will go bankrupt. As production is cut we would expect the price of crude
oil to find its bottom if it has not already. Crude Oil continued to rebound while production remains stagnant. Energy companies do not have the same
strong access to capital as they used to enjoy.

Page 25 –Commodity prices have surged as the US Dollar continues its downtrend.

Page 26- Emerging Market Equities have rallied VERY strongly as the USD has significantly weakened. A stronger USD (recently) and surging Covid
cases in EM have broken the uptrend.

Page 27- S&P 500 versus the S&P 500 Equal Weighted Index: Leadership is still somewhat narrow in 2021 but the equal weighted index is keeping close
to the influence of the tech giant’s impact on the S&P 500.

Page 28- It’s an excellent visualization of exactly how much stronger US equities have been versus the rest of the developed world. The US markets
are back to 5 year highs of relative outperformance. Interestingly, foreign equities outperformed the US during the selloff in March. With the help of
a somewhat disorganized vaccination campaign in Europe international equities have been unable to keep pace with the recovery unfolding in the
United States.

Page 29- Junk Bonds were +4.96% in 2020. Up 1.36% YTD 2021: Junk bonds have become somewhat unattractive due to incredible levels of spread
tightening. How much outperformance is left as the spread seems to have fully narrowed?

Page 30- When High Yield spreads widen the S&P 500 normally experiences a significant drawdown. Due to the sudden nature of this crisis there was
absolutely no warning from credit spreads prior to the recession. The speed of spread compression has been very remarkable. HY spreads have almost
collapsed to cycle lows.

Page 31- Credit spreads have narrowed considerably and are very near at pre Covid cycle lows. We think this will probably mark the cycle low in
credit spreads.

                                    1010 Franklin Avenue, Suite 300A
                                    Garden City, NY 11530
                                    (516) 693-5380
                                    info@hiltoncm.com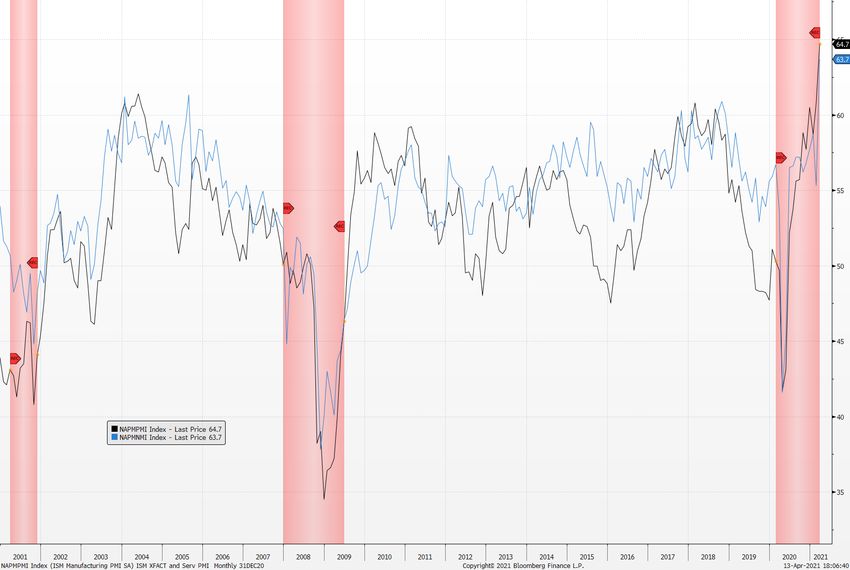
HILTON CAPITAL: 2021 OUTLOOK
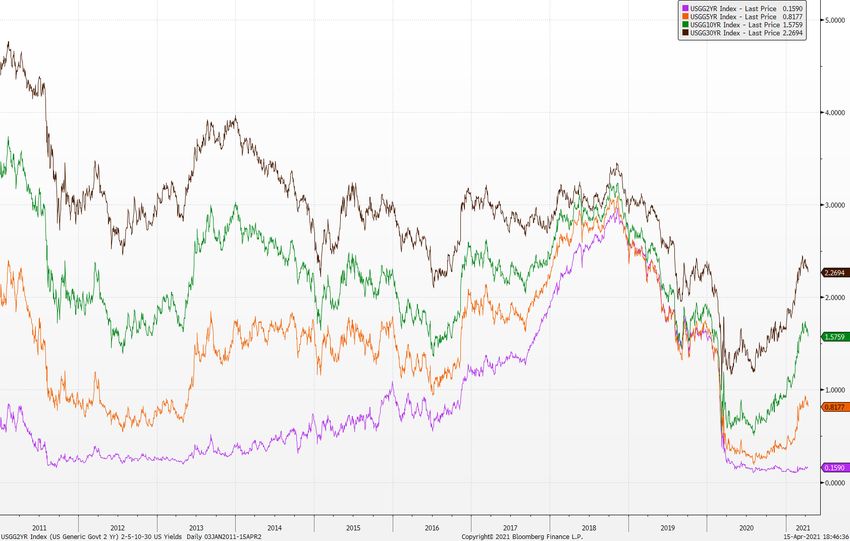
Page 32- US interest rates have meaningfully declined (collapsed) across all maturity ranges. The FED has shorter rates somewhat pinned due to their
massive QE program. The 30 year rate is now a very good barometer of longer term inflation trends while other longer term rates are also being dragged
higher. Inflation?
Page 33- 10 to 2 yield spread- The inverted yield curve in the middle of 2019 was a correct harbinger once again. The curve is getting steeper which is
normal in recessions. We would expect the yield curve to steepen further during a recovery.
Page 34 – The S&P 500 is overvalued on basically every metric. Valuations are not attractive under almost all traditional scenarios. Corporate margins
are likely to increase thus the market may not look as expensive as it does now later in 2021. EV/EBITDA is very elevated as most large companies
feasted on debt during the crisis. The recent up move in the market has been offset by higher earnings. PE multiples have not really expanded lately.
Page 35 – Size of the Federal Reserve’s Balance Sheet - The Fed’s balance sheet has grown by almost 3.6 Trillion dollars in the last twelve months. The
size and scope of the Federal Reserve’s intervention in the markets is staggering but was needed. We would assume any further economic malaise will
be met with aggressive Fed action. We added M2 money supply growth as a new chart on the bottom half of the page. M2 US money supply is up 27.1%
YoY which is the highest level of money supply growth since the FED has kept records back to 1960! MMT is here although no one in the government
would utter the phrase. M2 velocity was added, which collapsed by 18% in 2020 which does somewhat limit the impact of money supply increases on
inflation. Opportunities to spend money during a pandemic are much harder to come by.
Page 36 - Highlights the Duration and Magnitude of Historical Bull and Bear Markets. The average recession lasts around 15 months. Updated for 2020;
which makes one of the most challenging markets barely noticeable.
Page 37- Important Legal Notes and Disclosures.
Thank you.
The presentation is approved for distribution.
1010 Franklin Avenue, Suite 300A
Garden City, NY 11530
(516) 693-5380
info@hiltoncm.com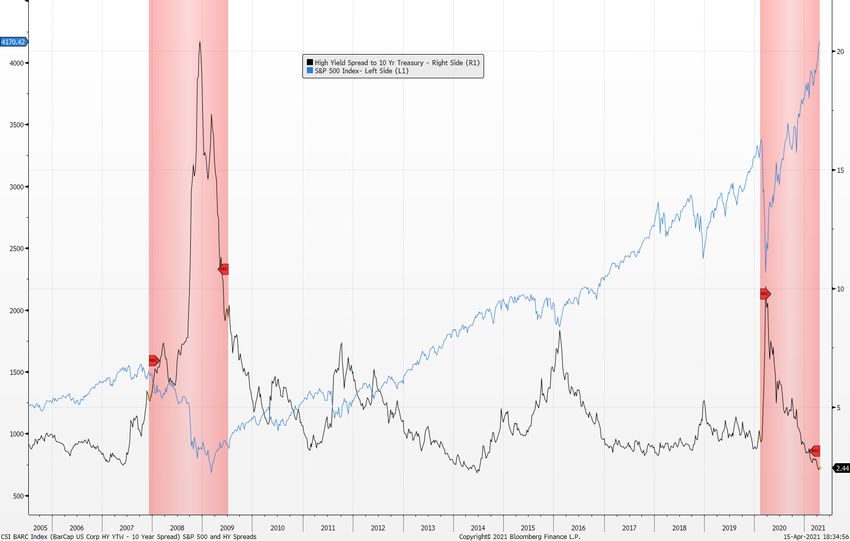
The Economy

              www.hiltoncm.com
    2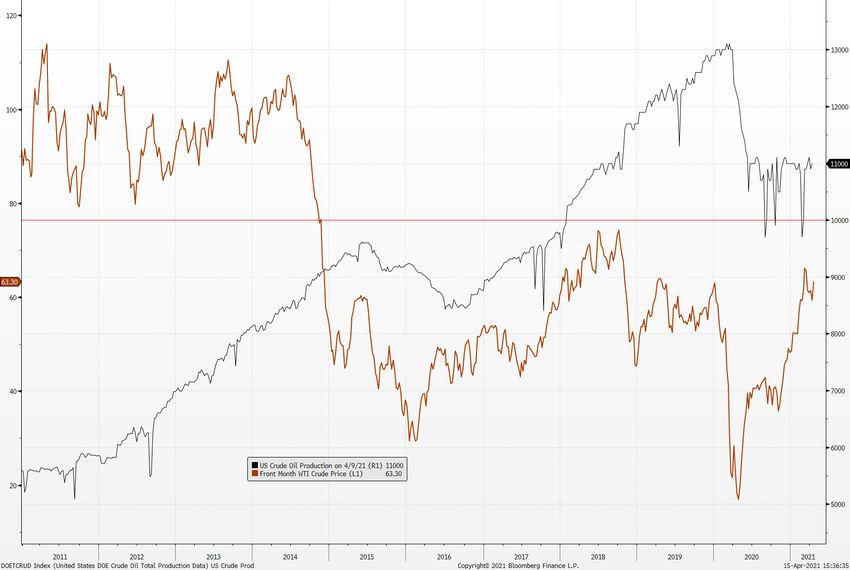
Longer Run FOMC Real GDP Projection
Central Tendency, Midpoint as of March 17, 2021

         Source: Federal Reserve Bank of St. Louis and US. Federal Open Market Committee, Longer Run FOMC Summary of Economic Projections for the Growth Rate of Real
         Gross Domestic Product, Central Tendency, Midpoint [GDPC1CTMLR], retrieved from FRED, Federal Reserve Bank of St. Louis; https://fred.stlouisfed.org GDP = Gross
         Domestic Product is the amount of goods and services produced within a given country.

Please see “Important Legal Information” at the end of this presentation for important information regarding the information contained and the views and opinions expressed in this presentation.

                                                                                                                                                                             www.hiltoncm.com
                                                                                                    3
ISM Manufacturing and Services PMI
December 31, 2000 to April 19, 2021

                                                                                                                            * Shaded areas indicate recession

         Source: Bloomberg/Hilton Capital Management
         ISM Manufacturing = an index based on surveys of more than 300 manufacturing firms by the Institute of Supply Management. It monitors employment, production, inventories, new orders and
         supplier deliveries. PMI = Purchase Managers Index is an indicator of the economic health of the manufacturing sector of the economy. You cannot invest directly in an index.

Please see “Important Legal Information” at the end of this presentation for important information regarding the information contained and the views and opinions expressed in this presentation.

                                                                                                                                                                             www.hiltoncm.com
                                                                                                    4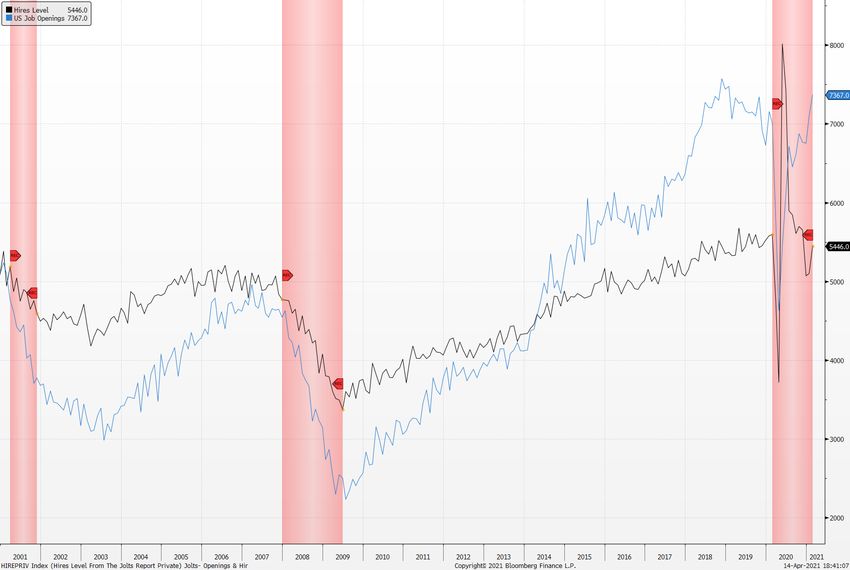
ISM Manufacturing and Global Manufacturing PMI
December 31, 2003 to April 19, 2021

         Source: Bloomberg/Hilton Capital Management
         ISM Manufacturing = an index based on surveys of more than 300 manufacturing firms by the Institute of Supply Management. It monitors employment, production, inventories, new orders and
         supplier deliveries. LHS = left hand side. YoY = Year over Year. GDP = the amount of goods and service produced within a given country. Nominal GDP = a gross domestic product (GDP) figure that
         has not been adjusted for inflation. You cannot invest directly in an index. MPMIGLMA= JPM Global Manufacturing PMI Index.
Please see “Important Legal Information” at the end of this presentation for important information regarding the information contained and the views and opinions expressed in this presentation.

                                                                                                                                                                             www.hiltoncm.com
                                                                                                    5
Atlanta Fed GDP Now Q1: 2021 Forecast
December 31, 2013 to April 15, 2021
Source: Atlanta Federal Reserve
GDP = Gross Domestic Product is the amount of goods and services produced within a given country. Blue-chip consensus = is a monthly survey associated publication by the Blue Chip Publications
division of Aspen Publishers collecting macroeconomic indicator of the health of the US economy. SAAR = Seasonally Adjusted Annual Rate. You cannot invest directly in an index.
Please see “Important Legal Information” at the end of this presentation for important information regarding the information contained and the views and opinions expressed in this presentation.
www.hiltoncm.com
6Consensus and Alternate Views of Real GDP YoY
April 9, 2021
United States
Real GDP YoY
15.0% Hedgeye Estimates - Nowcast Model
12.06%
Hedgeye Estimates - Enhanced Comparative Base Effects Model 11.70%
10.0% Bloomberg Consensus Estimates
Atlanta Fed GDPNow Model
5.77% 6.00%
5.70% 5.43%
5.0%
3.33% 3.12%
2.70% 3.08% 2.48% 2.27% 1.96% 2.08% 2.34%
0.32% 0.22%
0.0%
-0.00%
-0.10%
-2.85% -2.44%
-5.0%
-10.0% -9.03%
-15.0%
4Q17 1Q18 2Q18 3Q18 4Q18 1Q19 2Q19 3Q19 4Q19 1Q20 2Q20 3Q20 4Q20 1Q21E 2Q21E 3Q21E 4Q21E
Data Source: Bloomberg © Hedgeye Risk Management
Source: Hedgeye, Bloomberg, Census Bureau
GDP = Gross Domestic Product is the amount of goods and services produced within a given country. Blue-chip consensus = is a monthly survey associated publication by the Blue Chip Publications
division of Aspen Publishers collecting macroeconomic indicator of the health of the US economy. SAAR = Seasonally Adjusted Annual Rate. You cannot invest directly in an index.
Please see “Important Legal Information” at the end of this presentation for important information regarding the information contained and the views and opinions expressed in this presentation.
www.hiltoncm.com
7Conference Board US Leading Indicators December 31, 1974 to April 19, 2021
Major core inflation readings- Bottomed out:
October 11, 2006 to April 14, 2021

 Source: Bloomberg/Hilton Capital Management
 US CPI Urban Consumers Rent of Shelter YoY NSA
 US CPI Urban Consumers Services Less Energy Services YoY NSA
 US Personal Consumption Expenditure Core Price Index YoY SA
 US PPI Finished Goods Less Foods & Energy YoY NSA

Please see “Important Legal Information” at the end of this presentation for important information regarding the information contained and the views and opinions expressed in this presentation.

                                                                                                                                                                             www.hiltoncm.com
                                                                                                    9
Oil prices drive inflation expectations
January 2013 to April 14, 2021
Source: Bloomberg/Hilton Capital Management
USGGBE10 – US 10 Year breakeven inflation rates
CL1- Crude Oil WTI Price
Please see “Important Legal Information” at the end of this presentation for important information regarding the information contained and the views and opinions expressed in this presentation.
www.hiltoncm.com
10US Initial Jobless Claims SA – Stubbornly elevated: JOLTS Normal
December 31, 2000 to April 15, 2021
Source: Bloomberg/Hilton Capital Management; Department of Labor; Bureau of Labor Statistics
Please see “Important Legal Information” at the end of this presentation for important information regarding the information contained and the views and opinions expressed in this presentation.
www.hiltoncm.com
11US Continuing Jobless Claims SA – Making solid progress:
December 31, 2006 to April 15, 2021
Source: Bloomberg/Hilton Capital Management; Department of Labor
This concept tracks the total number of people who have filed jobless claims with the appropriate government labor office; typically, in order to receive unemployment benefits. This is also sometimes
referred to as registered unemployment.
Please see “Important Legal Information” at the end of this presentation for important information regarding the information contained and the views and opinions expressed in this presentation.
www.hiltoncm.com
12US Unemployment Permanent Job Losers SA –
December 31, 1999 to April 14, 2021
Source: Bloomberg/Hilton Capital Management, Bureau of Labor Statistics
Unemployment measures the number of people who are without work (not in paid employment or self-employed), currently available for work and seeking work (taking specific steps to find work).
Please see “Important Legal Information” at the end of this presentation for important information regarding the information contained and the views and opinions expressed in this presentation.
www.hiltoncm.com
13Job Openings vs Actual Hiring : Reopening distortion:
December 31, 2000 to April 14, 2021
Source: Bloomberg/Hilton Capital Management/Bureau of Labor Statistics
HIREPRIV – Hires Level From The Jolts Report Private SA
JOLTTOTL- US Jobs Openings By Industry Total Seasonally Adjusted
Please see “Important Legal Information” at the end of this presentation for important information regarding the information contained and the views and opinions expressed in this presentation.
www.hiltoncm.com
14The Pandemic’s unusual labor market impacts: Gender Participation
December 31, 2000 to March 31, 2021
Source: Hilton Capital Management, BLS
Please see “Important Legal Information” at the end of this presentation for important information regarding the information contained and the views and opinions expressed in this presentation.
www.hiltoncm.com
15U.S. Small-Business Optimism Index
January 1974 to April 15, 2021
* Shaded areas indicate recession
Source: National Federation of Independent Business, Bloomberg
NFIB Small Business Optimism Index= based on a survey of 619 small-business owners through December 28, 2016.
Please see “Important Legal Information” at the end of this presentation for important information regarding the information contained and the views and opinions expressed in this presentation.
www.hiltoncm.com
16US Average Hourly Earnings Growth & Payroll Growth:
January 1969 to April 15, 2021
* Shaded areas indicate recession
Sources: Bureau of Labor Statistics, Bloomberg
NFP TYOY: US Employees on Nonfarm Payrolls Total SA Year Over Year Percent Change.
USHEYOY: US Avg. Hourly Earnings of Production and Nonsupervisory Employees: Total Private YoY
Please see “Important Legal Information” at the end of this presentation for important information regarding the information contained and the views and opinions expressed in this presentation.
www.hiltoncm.com
17US New One Family Houses Sold – Supply Constrained:
November 1988 to April 15, 2021
* Shaded areas indicate recession
Sources: U.S. Census Bureau, Bloomberg
The Implicit US index is computed by taking the number of houses sold in the US and dividing it by the seasonally adjusted number of houses sold in the US..
Please see “Important Legal Information” at the end of this presentation for important information regarding the information contained and the views and opinions expressed in this presentation.
www.hiltoncm.com
18Alternative Data – Business foot-traffic: Vaccine Surge
Year over Year trends to April 1, 2021
Sources: Safegraph Covid19 Dashboard
Data from recent months on commercial activity (foot traffic trends) compared to the same time period from previous years to share insights into how the ongoing pandemic is
impacting the US economy and disrupting daily life.
Please see “Important Legal Information” at the end of this presentation for important information regarding the information contained and the views and opinions expressed in this presentation.
www.hiltoncm.com
19Alternative Data – Google Trends search term popularity:
Year over Year trends to April 15, 2021
Search: Unemployment
Search: Vacation
Source: Google Trends
Please see “Important Legal Information” at the end of this presentation for important information regarding the information contained and the views and opinions expressed in this presentation.
www.hiltoncm.com
20Alternative Data – OpenTable US Seated Diners YoY:
Year over Year trends to April 14, 2021
Sources: OpenTable, Bloomberg
This data shows year-over-year seated diners at restaurants on the OpenTable network across all channels: online reservations, phone reservations, and walk-ins. For year-over-
year comparisons by day, we compare to the same day of the week from the same week in the previous year.
Please see “Important Legal Information” at the end of this presentation for important information regarding the information contained and the views and opinions expressed in this presentation.
www.hiltoncm.com
21Alternative Data – US Dallas Fed Mobility & Engagement:
YTD 10 day moving average to April 15, 2021
Sources: The Dallas Fed, Bloomberg
The Dallas Fed Mobility and Engagement Index (formerly the “Social Distancing Index”) summarizes the information in seven different variables based on geolocation data
collected from a large sample of mobile devices to gain insight into the economic impact of the pandemic.
Please see “Important Legal Information” at the end of this presentation for important information regarding the information contained and the views and opinions expressed in this presentation.
www.hiltoncm.com
22The Markets
www.hiltoncm.com
23U.S. Crude Oil Production vs. Crude Oil Prices
December 31, 2010 through April 15, 2021
Production should
stabilize/increase with
higher prices.
Source: Bloomberg/Hilton Capital Management
DOETCRUD Index = DCE Crude Oil Total Production data tracks weekly barrels of petroleum status released by the Energy Information Administration. CL1 Comdty = generic crude oil futures
current contract. You cannot invest directly in an index
Please see “Important Legal Information” at the end of this presentation for important information regarding the information contained and the views and opinions expressed in this presentation.
www.hiltoncm.com
24Commodity Prices – Surging with lower USD:
5 years through April 15, 2021
Source: Bloomberg/Hilton Capital Management
BCOM = Bloomberg Commodity Index – rebalanced annually.
Please see “Important Legal Information” at the end of this presentation for important information regarding the information contained and the views and opinions expressed in this presentation.
www.hiltoncm.com
25Emerging Market Equities- Strong Performance:
April 13, 2006 through April 15, 2021
883 910
882
831
468
Source: Bloomberg/Hilton Capital Management
MXEF Index = The MSCI Emerging Markets Index:
USTWBGD Index = US Fed Trade Weighted Nominal Broad Dollar Index January 2006=100
Please see “Important Legal Information” at the end of this presentation for important information regarding the information contained and the views and opinions expressed in this presentation.
www.hiltoncm.com
26SPX 500 & SPX 500 Equal Weighted:
December 21, 2019 through April 15, 2021
Source: Bloomberg/Hilton Capital Management
SPXT= S&P 500 USD Total Return Index:
SPXEWTR Index = S&P500 Equal Weighted USD Total Return Index:
Please see “Important Legal Information” at the end of this presentation for important information regarding the information contained and the views and opinions expressed in this presentation.
www.hiltoncm.com
27US & International 5yr returns: US Outperformance
through April 15, 2021
Source: Bloomberg/Hilton Capital Management
EFA= iShares MSCI EAFE ETF – ETF that tracks the performance across the developed world excluding the US and Canada:
SPX Index = S&P500 Index:
Please see “Important Legal Information” at the end of this presentation for important information regarding the information contained and the views and opinions expressed in this presentation.
www.hiltoncm.com
28Junk Bonds: +4.95% 2020, +1.36% 2021 YTD
December 31, 2010 through April 15, 2021
Source: Bloomberg/Hilton Capital Management
JNK = SPDR Barclays High Yield Bond ETF in an exchange-traded incorporated in the U.S. It seeks investment results that correspond to the price and yield of the Barclays High Yield Very Liquid
Bond Index. Please see the appendix for prospectus link, description, expenses, etc. for JNK. You cannot invest directly in an index.
Please see “Important Legal Information” at the end of this presentation for important information regarding the information contained and the views and opinions expressed in this presentation.
www.hiltoncm.com
29S&P 500 vs. HY Spreads
July 15, 2005 to April 15, 2021
* Shaded areas indicate recession
Source: Bloomberg/Hilton Capital Management
S&P 500 Index is designed to measure performance of the broad domestic economy through changes in the aggregate market value of 500 stocks representing all major industries. U.S. High Yield
Index refers to the Barcap US Corporate HY YTW minus 10-YR Treasury Spread. You cannot invest directly in an index.
Please see “Important Legal Information” at the end of this presentation for important information regarding the information contained and the views and opinions expressed in this presentation.
www.hiltoncm.com
30U.S. Corporate Credit Spreads: Broad IG, BBB & High Yield
December 1, 2010 through April 15, 2021
Source: Deutsche Bank Credit Strategy Indices/ Hilton Capital Management
IG = Investment Grade. GOVT OAS = government option adjusted spreads is the yield spread which has to be added to a benchmark yield curve to discount a security’s payments to match its
market price using a dynamic pricing model that accounts for embedded options
Please see “Important Legal Information” at the end of this presentation for important information regarding the information contained and the views and opinions expressed in this presentation.
www.hiltoncm.com
31U.S. 2-5-10-30 Year Generic Treasury Yields
January 3, 2011 through April 15, 2021
Source: Bloomberg/Hilton Capital Management
US Generic 2,5,10,30 Year Treasury Bond. You cannot invest directly in an index
Please see “Important Legal Information” at the end of this presentation for important information regarding the information contained and the views and opinions expressed in this presentation.
www.hiltoncm.com
32U.S. 10 Year minus 2 Year Spread
January 1985 through April 16, 2021
* Shaded areas indicate recession
Source: Bloomberg/Hilton Capital Management
Index = Market Matrix US Sell 2 Year & Buy 10 Year Bond Yield Spread (USYC2Y10 Index)
Please see “Important Legal Information” at the end of this presentation for important information regarding the information contained and the views and opinions expressed in this presentation.
www.hiltoncm.com
33S&P 500 Valuation – Very elevated:
1990 through April 16, 2021
* Shaded areas indicate recession
Source: Bloomberg/Hilton Capital Management
Please see “Important Legal Information” at the end of this presentation for important information regarding the information contained and the views and opinions expressed in this presentation.
www.hiltoncm.com
34Size of Federal Reserve Balance Sheet & Money Supply –
January 2015 through April 16, 2021
* Shaded areas indicate recession
Source: Bloomberg/Federal Reserve/ Billions USD
Please see “Important Legal Information” at the end of this presentation for important information regarding the information contained and the views and opinions expressed in this presentation.
www.hiltoncm.com
35Bull and Bear Markets
1926 through 2020
Source: Bloomberg/Hilton Capital Management
Please see “Important Legal Information” at the end of this presentation for important information regarding the information contained and the views and opinions expressed in this presentation.
www.hiltoncm.com
36Important Legal Information & Disclosures
Any benchmark, index or financial indicator shown in this presentation have limitations when used for comparative, illustrative, or other purposes
because they may have volatility, credit, diversification or other material characteristics (such as number and types of securities or instruments
represented).This presentation is confidential, is not to be reproduced or recirculated, is for discussion purposes only is not and should not be
construed as personalized investment advice, is not an advertisement, and is intended for the exclusive use of the recipient receiving it directly
from HCM. This presentation is being provided solely for discussion purposes as to general economic and market trends, and not as an attempt to
recommend or provide advice regarding any investment strategy or securities purchase.
This presentation is not intended as, and does not constitute, an offer to sell any securities to any person or solicitation of any person of an offer to
purchase any securities. No offer to sell (or solicitation of an offer to buy) will be or is hereby made in any jurisdiction in which such offer or
solicitation would be unlawful. Neither this presentation nor anything in it shall form the basis of any contract or commitment. This presentation is
not intended to be relied upon as advice to investors or potential investors and does not take into account the investment objectives, financial
situation or needs of any investor. None of the content should be construed as specific investment advice, or replacement for investment advice
from HCM, or any other investment professional.
The information is provided as of the date of delivery hereof, is condensed and is subject to change without notice. Some information may have
been provided by or compiled based on information provided by third party sources. Although HCM believes the sources are reliable, it has not
independently verified any such information and makes no representations or warranties as to the accuracy, timeliness or completeness of such
information.
Certain information contained in this presentation may constitute forward-looking statements, which can be generally identified by the use of
language such as “may,” “will,” “should,” “expect,” “anticipate,” “target,” “project,” “estimate,” “believe,” or comparable terminology. Due to various
risks and uncertainties, actual events or the consequences of such events may differ materially from those reflected or contemplated in such
forward-looking statements. While the opinions expressed or implied herein are based on estimations and assumptions believed to be reasonable
(at the time this presentation was drafted), there are no assurances that any estimation or assumption has or will materialize. Furthermore,
information regarding market returns and market outlooks is based on the research, analysis and opinions of HCM, which are speculative in
nature, may not come to pass, and are not intended to predict the future performance of any specific investment. Actual investment practices may
vary depending on economic climate and investment opportunities. The reader should not rely on this information for investment purposes. Past
performance is not a guarantee of future results.
37 www.hiltoncm.comYou can also read