Presentation to Investors - June 2017 - Intralot

Page created by Arnold Lewis
 
CONTINUE READING
Presentation to Investors - June 2017 - Intralot
Presentation to Investors
June 2017
Presentation to Investors - June 2017 - Intralot
Disclaimer
By reading or attending the presentation that follows, you agree to be bound by the following limitations.
This presentation has been prepared by INTRALOT S.A. and its subsidiaries (the “Company” or “We”) solely for informational purposes and does not constitute, and should not be
construed as, an offer to sell or issue securities or otherwise constitute an invitation or inducement to any person to purchase, underwrite, subscribe to or otherwise acquire securities in
the Company. This presentation is intended to provide a general overview of the Company and its business and does not purport to deal with all aspects and details regarding the
Company.
For the purposes of this disclaimer, the presentation that follows shall mean and include the slides that follow, the oral presentation of the slides by the Company or any person on its
behalf, any question-and-answer session that follows the oral presentation, hard copies of this document and any materials distributed in connection with the presentation. By attending
the meeting at which the presentation is made, dialling into the teleconference during which the presentation is made or reading the presentation, you will be deemed to have agreed to all
of the restrictions that apply with regard to the presentation and acknowledged that you understand the legal regulatory sanctions attached to the misuse, disclosure or improper circulation
of the presentation.
The Company has included non-IFRS financial measures in this presentation. These measurements may not be comparable to those of other companies. Reference to these non-IFRS
financial measures should be considered in addition to IFRS financial measures, but should not be considered a substitute for results that are presented in accordance with IFRS.
The information contained in this presentation has not been subject to any independent audit or review. A significant portion of the information contained in this presentation, including all
market data and trend information, is based on estimates or expectations of the Company, and there can be no assurance that these estimates or expectations are or will prove to be
accurate. Our internal estimates have not been verified by an external expert, and we cannot guarantee that a third party using different methods to assemble, analyse or compute market
information and data would obtain or generate the same results. We have not verified the accuracy of such information, data or predictions contained in this presentation that were taken
or derived from industry publications, public documents of our competitors or other external sources. Further, our competitors may define our and their markets differently than we do. In
addition, past performance of the Company is not indicative of future performance. The future performance of the Company will depend on numerous factors, which are subject to
uncertainty, including factors which may be unknown on the date hereof.
Each attendee or recipient acknowledges that neither it nor the Company intends that the Company act or be responsible as a fiduciary to such attendee or recipient, its management,
stockholders, creditors or any other person. By accepting and providing this document, each attendee or recipient and the Company, respectively, expressly disclaims any fiduciary
relationship and agrees that each attendee or recipient is responsible for making its own independent judgment with respect to the Company and any other matters regarding this
document.
Certain statements contained in this presentation that are not statements of historical fact, including, without limitation, any statements preceded by, followed by or including the words
“targets,” “believes,” “expects,” “aims,” “intends,” “may,” “anticipates,” “would,” “could” or similar expressions or the negative thereof, constitute forward-looking statements, notwithstanding
that such statements are not specifically identified. Examples of forward-looking statements include, but are not limited to: (i) statements about future financial and operating results; (ii)
statements of strategic objectives, business prospects, future financial condition, budgets, projected levels of production, projected costs and projected levels of revenues and profits of the
Company or its management or boards of directors; (iii) statements of future economic performance; and (iv) statements of assumptions underlying such statements.
Forward-looking statements are not guarantees of future performance and involve certain risks, uncertainties and assumptions which are difficult to predict and outside of the control of the
Company. Therefore, actual outcomes and results may differ materially from what is expressed or forecasted in such forward-looking statements. We have based these assumptions on
information currently available to us, if any one or more of these assumptions turn out to be incorrect, actual market results may differ from those predicted. While we do not know what
impact any such differences may have on our business, if there are such differences, our future results of operations and financial condition, could be materially adversely affected. You
should not place undue reliance on these forward-looking statements. Forward-looking statements speak only as of the date on which such statements are made. The Company
expressly disclaims any obligation or undertaking to disseminate any updates or revisions to any forward-looking statement to reflect events or circumstances after the date on which such
statement is made, or to reflect the occurrence of unanticipated events.

                                                                                                                                                                                           June 2017 | Page 2
Presentation to Investors - June 2017 - Intralot
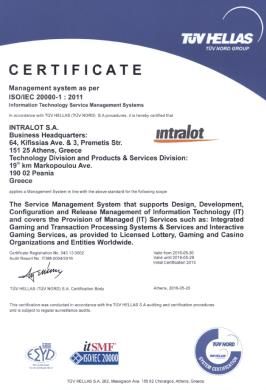
Agenda

1. Overview
2. Key Strengths
3. Company Strategy
4. Performance Overview & Financials
5. Conclusion
6. Appendix
Presentation to Investors - June 2017 - Intralot
1. Overview

              June 2017 | Page 4
Presentation to Investors - June 2017 - Intralot
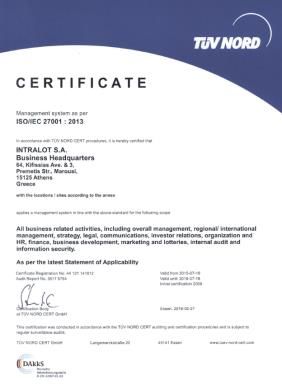
Global Gambling Market – 2016 Snapshot

      Global GGR, 2016E                                       Global GGR per region, 2016E

             11%                                   4%                  10%
                                                                                             19%
                                                   €117b
                €355b                                                    €110b                  €98b
                                                   North
                Global                                                    Asia                 Europe
                                                  America
                 GGR                                                      GGR                   GGR
                                                    GGR

                     89%                                                                                    81%
                                                       96%                    90%

             Bingo
             / Other
Betting
                13                               14%                     6%                    6%
           51                       Casino
                            122                                          €10b
                €355b                              €17b                                             €3b
                Global                                                   South
                                                  Oceania                                          Africa
      65         GGR                               GGR
                                                                        America
                                                                                                   GGR
                                                                         GGR

                  104                                   86%                  94%                     94%
 Gaming
 Machines
                   Lotteries                                                                       Interactive         Retail
    Source: H2 Gambling Capital Summary May’16

                                                                                                                  June 2017 | Page 5
Presentation to Investors - June 2017 - Intralot
Regulatory and Industry Trends Overview

                                 Key Sector Trends                                          INTRALOT’s Position

   Regulation Initiatives
    Global regulation changes, driven by country and state budget deficits and
    increased demands for social welfare spending fuel:                               Leading partner for organizations
                                                                                         that want to compete in a
       Liberalizations of gaming markets, mainly Internet and mobile markets         regulated interactive competitive
       Privatizations of state owned lotteries                                                 environment
       Crackdowns on illegal gaming
   End-to-End player experience
       New business models focus on growing consumer demand for entertainment
                                                                                        Offers a personalized player
       Personalized game offering and content                                                   experience
       Customer analytics
   Technology convergence
                                                                                        Robust, efficient and versatile
       An ‘All-in-one’ gaming platform delivering a unified customer experience       gaming platform that converges
       Convergence of land based and interactive channels                           land-based and interactive channels
   Distribution channels
       Mobile is now the primary access point to online retail for most consumers        Omni-Channel Approach

   Competition
                                                                                     Offers extensive business support
       Major international competitors shift focus to VLT market and achieving
                                                                                      for optimal customer experience
        synergies

                                                                                                                       June 2017 | Page 6
Global Presence - INTRALOT at a Glance

                                                                                    Europe
                          U.S.A.
                                                                                                                                                               €23.4bn wagers
                                                                                                                                                                  handled
 More than                            51,000 Retailer terminals                                    71,500 Retailer terminals      Oceania
                                        26,000 VLT Systems                                         36,000 Horizon Monitors         Asia
130 Patents                          8,200 Self-service terminals
                                       34,000 Horizon Monitors

                                                                                                                                             22,000 Retailer terminals
                                                                           Africa                                                             30,000 VLT Systems
          South                                                                                                                              11,500 Horizon Monitors
         America

                                                                                        3,400 Retailer terminals
                                                                                        2,300 Horizon Monitors
                      6,900 Retailer terminals
                         160 VLT Systems
                      3,500 Horizon Monitors
                                                                                                                                                             306,000

                                                                                                                                             INTRALOT     Retail
                                                                                                                                            Solutions WORLDWIDE
          32                         55                         87                        3,4501                     1.32 bn
   Countries                  Jurisdictions                 Contracts                  Employees               Revenues in 2016

   INTRALOT is the leading supplier of integrated gaming and transaction systems, innovative game content, sports betting, and interactive
                                                gaming services to state Lotteries worldwide
  1A   global workforce of approximately 5,300 employees (3,450 of which in subsidiaries and 1,850 in associates)
                                                                                                                                                                         June 2017 | Page 7
Overview of INTRALOT – A Global Gaming Technology
and Service Company
                         Business Description                                                                 Our Three Pillars
   INTRALOT is a global leader in the supply of integrated gaming systems
    and services

       Designs, develops, operates and supports customized software and
        hardware for the gaming industry
       Provides innovative technology and services to state and state-
        licensed lottery and gaming organizations worldwide                            Licensed Operations    Management Contracts             Technology
       Holds licences for full games operation

   Founded in 1992 and listed on the Athens Stock Exchange since 1999
   Operates a diversified and stable portfolio of 87 contracts and licenses
    across 55 jurisdictions and 5 continents                                          Operation and             Day to day               Provision of
   INTRALOT has a strong track record of contract renewal                             control over every         operations                hardware, software,
                                                                                       aspect of the gaming       management                and telecom
   Revenues of €1,323.6m and EBITDA of €175.8m (13.3% margin) in FY16                 offering                                             solutions to state or
                                                                                                                 Includes marketing,
   Average sovereign rating of operations in the high BBB/ Baa to low A area                                     POS optimisation,         state-licensed
                                                                                                                  risk management           operators
                      FY16 Revenue Breakdown                                                                                               Installation,
                                                                                                                                            maintenance and
               By Geography                        By Business Activity                                                                     support
                                                                 Technology
         RoW
                                                                   16%
                                                                                      Typical contract          Typical contract         Typical contract
         19%
                                                                                       structure                  structure                 structure
                              Europe                                                    Open-ended                 Multi-year with          Multi-year with
                               40%
                                                                                          market licence             renewal options           renewal options
                                             Licensed
                                            Operations                                  Revenues                   Fixed percentage         Fixed percentage
                                                                      Management
                                                 75%                   Contracts          generated                  of wagers                 of wagers
     America                                                             9%
      41%                                                                                 through wagers

                                                                                                                                                            June 2017 | Page 8
INTRALOT Certifications & Memberships

              Responsible & Reliable Partner                                                  Highlights

                                                                                                                     1st Vendor to
                                                                                                                      Achieve WLA
                     As member of the UN Global Compact,                                                              SCS Certification
                     INTRALOT is a global corporate citizen
                     committed to sustainable development,                                                           1st Vendor to
Responsible
                     and is an active proponent of the                                                                Achieve ISO
                     principles of responsible gaming,                                                                20000
                     possessing the WLA Responsible                                                                   Certification
                     Gaming Framework Certificate                                                                    17 operations
                                                                                                                      certified as per
                                                                                                                      both WLA (SCS)
                                                                                                                      and ISO 27001
                    The Company maintains the highest                                                                security
                     security certification                                                                           certifications.
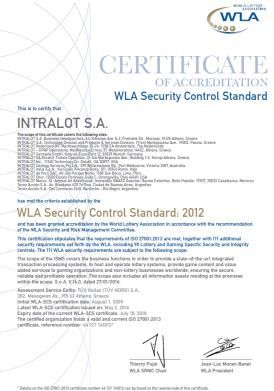
 Reliable           INTRALOT is the first international
                     vendor in the gaming sector that has
                                                                Leading member in all major Lottery and Gaming Associations
                     been certified according to the WLA        globally:
                     Security Control Standard in 2012
                    Moreover, the Company has been
                     certified with the ISO 27001 for its
                     (ISMS) Information Security                     Platinum
                                                                    Contributor
                                                                                   Premium
                                                                                    Partner
                                                                                                          Top
                                                                                                        Sponsor
                                                                                                                                  Star
                                                                                                                               Contributor
                     Management System and maintains the
                     ISO 20000-1 certification on Information
                     Technology Service Management
                                                                        Gold                                               Gold
                                                                                               Member
                                                                       Sponsor                                            Member

                                                                                                                                             June 2017 | Page 9
2. Key Strengths

                   June 2017 | Page 10
Strengths Overview

                  7                                          1
                      Management experienced
                                                                  Attractive industry with
                      at renewing contracts and
                                                                 sustainable future growth
                        delivering revenue and
                                                                         prospects
                            EBITDA growth

6                                                                             2
                                                                                    Leading position in the
      Competitive EBITDA                                                           sector with technological
          Margins                                                                    innovations creating
                                                                                  significant barriers to entry

5                                                                             3
    Shift to asset-light model                                                     Diversification and scale
     and stronger cash flow                                                        across geographies and
            generation                 4
                                                                                      business activities

                                             Highly visible recurring
                                           revenues secured by long-
                                                 term contracts

                                                                                                          June 2017 | Page 11
1    Attractive Industry with Sustainable Future Growth Prospects

                                                                         Focus on lottery and betting
     Global Gaming Market GGR Evolution per product (€bn)                                                                                     CAGR
                                                                                                                                       11-15       16-20
                                                                                                                        390     402
                                                                                                               379                     +1.6%       +1.9%
                                                           357                         355            367                       14.1
                              337           347                          349                                            13.8           +1.6%       +2.6%
                324                                                                                   13.4     13.7
                                                           12.5          12.7           13.1                            69.5    71.4
                              12.2           12.5                                                              67.7
                11.9                                       62.1                         64.4          66.1                             +0.6%       +3.6%
                              61.2           61.0                        63.1
                59.2                                                                                                                   +5.2%       +4.3%
                                                                                                                       136.4   140.6
                                                                                                      127.7    132.3                   +2.2%       +2.7%
                                            131.7         133.6          122.2         122.0
               119.5          126.2
                                                                                                                                       Others
                                                                                                               55.4     57.2    60.2
                                                           47.2          48.7           50.9          52.8
                39.8          41.2           43.2                                                                                      Gaming Machines

                              95.7           98.2         101.9          102.0         104.3          107.1    109.7   112.7   116.1   Casino
                93.4
                                                                                                                                       Betting
              2011A          2012A         2013A         2014A          2015A         2016E         2017E     2018E    2019E   2020E   Lotteries

                       Focus on the interactive channel/ Strengthen INTRALOT’s footprint through AMELCO agreement
      Global Interactive Gaming Market GGR Evolution per region (€bn)                                                                         CAGR
                                                                                                                                53     11-15        16-20
                                                                                                                        49
                                                                                                               46                      +5.5%       +18.4%
                                                                                                      42                        10.6
                                                                                                                                       +9.1%       +5.9%
                                                                                        38                              9.6
                                                                                                               8.9
                                                                         35                           7.7                              +10.9%      +8.0%
                                                           32                                                                   14.2
                                            28                                          5.4
                              26                                         5.2                                   12.7
                                                                                                                        13.4           +13.6%      +5.9%
               24                                          4.8                                        12.0
                                            4.3                                        11.3
                              4.1                                        10.5                                                          Americas
               4.2                                         9.8
                                            9.0
               7.4
                              8.3
                                                                                                                                24.9
                                                                                                                                       Asia
                                                                                                               21.7     23.0
                                                                                       18.3           19.8
                                                          15.1           16.5                                                          Europe
               10.9          12.1           13.3

                                                           2.3           2.5            2.7           2.8      3.0      3.2     3.4    RoW
               1.5            1.7           1.7
             2011A         2012A          2013A         2014A          2015A         2016E          2017E     2018E    2019E   2020E
    Source: H2 Gambling Capital Summary May’16. Data for the Fiscal Years 2016-2020 are estimated by H2GC.

                                                                                                                                                     June 2017 | Page 12
Leading Position in the Sector with Technological Innovations Creating
2 Significant Barriers to Entry
  Licensed Operations

                                                        Country                     % of 12M16 EBITDA

                 #1 market position                                                       24.3%

                    Leading market
                       position                                                           13.0%

                             Total                  10 countries1                         37.4%

              INTRALOT enjoys leading positions in licensed gaming in many of its countries of operations
          1   INTRALOT also operates in Slovakia

                                                                                                            June 2017 | Page 13
2
    Global Leader in the Global Gaming Industry
    Technology and Management contracts
                                                                             Leading Positions Across the World
    •   Well diversified portfolio with balanced presence in developed
                                                                                                              Probability of
                                                                                                                                                                                             Won
        (through new sales channels) and developing markets (high                                                                                                                            Processes that we submitted the
                                                                                                              Successful Contract                                                            winning offer
        GDP growth)                                                                                           Acquisition for any
                                                                                                              Given Bidding                             18%
    •   Approximately 24% market share in the US in IT to lotteries                                           Process (excluding                                                                                                      Lost
        (11 states) and c.48% in Argentina (11 states) in IT to lotteries                                                                                                                                       Processes that were awarded
                                                                                                              pending/ cancelled                                               36%                                         to another bidder
                                                                                                              processes):
    •   Provider of IT to Lotteries in Taiwan, South Korea, New South
        Wales (Australia), etc.                                                                                                                                                              Cancelled/ Pending
                                                                                                                        42%                                                                  Processes that did not result to
    •   Recurring revenues – average contract term of 8 years                                                                                                                                an award yet or have been
                                                                                                                                                        46%                                  cancelled

    •   In 2016, Greece represented less than 3.0% of the Group’s
        Revenue

                                                                                                            Source: INTRALOT, 2013 – 2016 (Sample of 28 Opportunities)

                                                           Well Established Player in the IT to lotteries US market
                                                           MN
        WA                   MT             ND

                   ID                       SD                                                                          ME
         OR                                                           WI
                                                                                                                 VE
                                                                                   MI
                                  WY
                                                 NE
                                                                                                            NY     NH                                                       INTRALOT Inc. (US)
                                                            IA
                                                                       IL                              PA        CT
              NV        UT
                                       CO                       MO
                                                                            IN           OH
                                                                                                            NJ
                                                                                                                          RI
                                                                                                                                                                          Established Dec 2001                    Source: INTRALOT
         CA                                           KS
                                                                              KY                  WV VA MD DE

                                                                 AR          TN                   NC
                                                                                                                                                 ● 60M population coverage
                        AZ             NM             OK
                                                                                              SC
                                                                      M     AL          GA
                                                                 LA   S                                            DC INTRALOT
                                                                                                                                                 ● 24% market share (contracts in 10 states + DC)1
                                                 TX

                                                                                             FL

                                                                                                                                               1 Intralot   has presence also in GA through a VLT monitoring contract
                   INTRALOT                 IGT                 SGI              NO LOTTERY

         INTRALOT is one of the global leaders in technology for the gaming industry, with leading positions in many
                                                         countries
                                                                                                                                                                                                                                 June 2017 | Page 14
3       Diversification and Scale Across Geographies and Business Activities

                                                                                    EBITDA by Business Activity

           Diversified portfolio with 87 contracts and                                                                            Technology
            licenses, with presence across 55 jurisdictions in                                                                        28%

            32 countries                                                         Licensed
                                                                                Operations
                                                                                   41%

           Well diversified portfolio with balanced presence
            in developed (through new sales channels) and
            developing markets (high GDP growth)                                                                                    Management
                                                                                                                                     Contracts
                                                                                                                                       31%

           Majority of revenues, cash resources and debt                                       FY16 EBITDA: €175.8m
            obligations outside Greece, thereby mitigating
            individual sovereign risk                                                     EBITDA by Geography2

           Approximately €23.4bn wagers handled annually                           New Zealand; 1%              Russia
                                                                                                                  1%
                                                                                                                              Other
                                                                                                                               1%
                                                                                  Netherlands; 3%
                                                                               Morocco
           Approximately                  3,4501         people employed        6%
                                                                                                                          Turkey
            worldwide                                                                        Malta                         20%
                                                                                              6%

           Average sovereign rating of operations in the                                Jamaica
                                                                                           6%
            high BBB/ Baa to low A area                                                  Azerbaijan; 8%
                                                                                                                          United States
                                                                                                                              20%

                                                                                             Argentina
                                                                                                8%
                                                                                                     Australia     Bulgaria
                                                                                                       8%           12%

                                                                                                 FY16 EBITDA: €175.8m
    1 5,300 in total, of which 3,450 in subsidiaries and 1,850 in associates
    2 Countries with negative EBITDA have been excluded from the chart

                                                                                                                                                 June 2017 | Page 15
4       Highly Visible Recurring Revenues Secured by Long-Term Contracts

                                                                                                                  Major Contract Expiry (Without Renewal Options)
                                                                                                                                                                   Contract type % of FY16EBITDA1,2
       85% of revenues secured through                                                                                                                                                   6%
                                                                                                                   Morocco           2018
        multi-year contracts or renewable
        licenses until 2021                                                                               Turkey (Inteltek)          2018                                                 14%

              Average contract term of 8                                                                                                                                                 4%
                                                                                                           Greece (OPAP)             2018
               years
                                                                                                                                                                                          1%
              Strong track record of contracts                                                               New Zealand                   2022

               renewal
                                                                                                                      Malta                 2022                                          6%
       11 licensed operations in 10
        countries with leading market                                                            Argentina (13 Contracts)                    2023                                         8%

        position in the majority of them
                                                                                                                 Azerbaijan                        2025                                   8%
       Contracts with long-term duration,
        providing stability to revenue                                                         Greece (Hellenic Lotteries)                          2026                                  1%

        stream
                                                                                                        US (14 Contracts)                             2027                                20%
       Unique operational model in
        countries allowing INTRALOT to                                                                             Bulgaria                                                               12%
                                                                                                                                                             Open
        micro tailor products for distribution                                                                                                               Market
                                                                                                                   Jamaica                                   License                      6%
       Competition (where applicable) is
        local – no global competitor in
        licensed operations markets
                                                                                                          Licensed Operations                Management Contracts            Technology

    1 Excludingcountries with negative EBITDA
    2   Management estimation incorporating direct expenses and apportionment of indirect expenses related to the project/ country
                                                                                                                                                                                     June 2017 | Page 16
5       Shift to Asset-Light Model and Stronger Cash Flow Generation

             Two pillars to the shift to asset-light                            Less CAPEX Intensive Business Model
              business model                                Capital expenditure1 (€m)                                                   Capital expenditure1/
                                                                                                              71
                Syndicate risk and reduce capex by                                      67                                             GGR
                                                                                                                                63                 61
                 entering into JVs with local partners                58

                 allowing for minimum equity check
                                                                                                                               9.6%
                 while maintaining and selling new                   7.4%
                                                                                                                                                 9.0%
                                                                                        7.3%               7.3%
                 contracts
                Optimize product development by
                 minimizing customization
                 requirements                                       2013A               2014A             2015A               2015A 2            2016A   2

               Various criteria to select local partners
                                                                                        FY 2016A total cost breakdown
                  Local experience in industry and
                   ability to deliver                                                                                         Other fixed
                                                                                                                                 15%        Game tax
                                                                                                Other variable                                15%
                  Extensive distribution chain
                                                                                                    costs
                  Well capitalized and long-term              Winnings                             29%                                             Agents
                                                                payout                                             HR costs                       commissions
                   presence                                      55%                                                21%                              14%

                  E.g. large utility or                                                        Fixed costs                                     Direct COS
                   telecommunication companies                                                     16%                                             18%
                                                                                                                                  Other
                                                                                                                                 variable
             Highly flexible cost base with c.85% of                                                                             17%
              costs variable
    1   Purchases of tangible and intangible assets
    2   Excluding Italy and Peru discontinued operations
                                                                                                                                                         June 2017 | Page 17
5    Strong & Established Partnerships in the Gaming Sector
    Rationale for Entering Into JVs                                            List of Partnerships

       Attractive point of entry in a given                                                                            FY16         1Q17
        market, with limited capital            Country           INTRALOT stake           Contract type               EBITDA       EBITDA
                                                                                                                     Contribution Contribution
        expenditure requirements
        compared to full-scale M&A              Turkey
                                                                      45.00%           Management contract               16%          13%
                                                (Inteltek)
       Opportunity to establish strategic
                                                Turkey
        partnerships with local players                               50.01%           Management contract               7%            7%
                                                (Bilyoner)
        which offer substantial market
        knowledge, well-established             Bulgaria          49.00% + option
        sales network and recognized            (Eurofootball      for additional       Licensed operation               13%          13%
                                                Group)                 2.00%
        brand names
                                                                  49.00% + option
                                                Bulgaria
                                                                   for additional       Licensed operation               1%            4%
                                                (Eurobet Group)
       Ability to invest in companies in                              2.00%
        which local partners see upside
        and are therefore willing to retain a   Azerbaijan            22.95%            Licensed operation               9%           10%
        controlling stake in

                                                Jamaica               24.97%            Licensed operation               8%           10%

                                                                                    12 facilities management (IT)
                                                                                      contracts with state lottery
                                                Argentina             50.01%                                             9%            9%
                                                                                        operators & 1 licensed
                                                                                               operation

                                                Total                                                                    63%          66%

                                                                                                                                    June 2017 | Page 18
6     Competitive EBITDA Margins

       Revenues (€m)
                                                                                                                                                                                                   EBITDA margin (%)

       5,000                                                                                                                                                                                               45.0%

       4,500                                                                                                                                                     37.9%                      38.3%
                                                                                                                                                                                                           40.0%
       4,000                                                                                                                                                                                               35.0%
                                                                                                                                                  34.1%
       3,500                                                                                               27.8%                                                                                           30.0%
                                                                                25.8%
       3,000
                                                      23.0%                                                                                                                                                25.0%
       2,500
                                                                                                                                                                                                           20.0%
       2,000
                                                                                                                                                                                                           15.0%
       1,500                             13.2%                                          13.3%

       1,000                                                                                                                                                                                               10.0%
                                                                                  642

          500                                                                                                                                                                                              5.0%
                                                                                  682
             0                                                                                                                                                                                             0.0%
                          Peer A                     Peer B                                                Peer C                    Peer D                      Peer E                     Peer F

                                                     GGR (Net Revenues)                    Payout           Gross EBITDA Margin                    Net EBITDA Margin

                                              On a GGR basis, INTRALOT’s profitability is at gaming industry averages

    1PeersSample (in Alphabetical order): Aristocrat Leisure Ltd., Everi Holdings, International Game Technology plc, Ladbrokes Coral Group, Penn National Gaming & Scientific Games Corporation
    Source: Companies’ Annual Reports & Press Releases
                                                                                                                                                                                                           June 2017 | Page 19
Management Experienced at Renewing Contracts and Delivering
7
        Revenue and EBITDA Growth
                                                                        Revenue1 Evolution by Region (€m)

           Management has achieved Revenue and EBITDA
                                                                                  Europe         Americas         RoW
            growth despite changes in gaming regulatory
            landscape
                                                                                             1,853           1,915
           On a like for like basis, 2016A Revenue and
                                                                                 1,539                        292
            EBITDA grew by +19.2% and +20.6% respectively             1,374                      356
                                                                                                                                     1,324
                                                              1,202                                                        1,235
            compared to 2015A2,3                                       246
                                                                                  296
                                                                                                 549
                                                                                                              659
                                                                                                                                      252
                                                               134                                                           292
                                                                                  459
           Experienced team has demonstrated in-depth         376     451
                                                                                                                                      540
                                                                                                                             555
            knowledge of the gaming sector dynamics                                              948          964
                                                               692     677        784
                                                                                                                                      532
           Keys wins                                                                                                        388

            - Strong track record of contracts’ renewals      2011A   2012A      2013A       2014A           2015A         2015A 3   2016A

            - 42% win rate in international tenders                         EBITDA Evolution by Region (€m)
              (2013-2016)                                                               Europe         Americas      RoW

            - Successfully entered and gained market share
              on the US market                                         178
                                                                                  195
                                                                                                 175          177                     176
                                                                                                                            165
                                                               154
            - Successful implementation of internal                    48
                                                                                  56
                                                               19
              restructuring measures aimed at improving        47                 51
                                                                                                 73           80
                                                                                                                             80       88

              efficiency                                               60
                                                                                                 58
                                                                                                              68             58       65
            - Established strong and promising partnerships    88
                                                                       70
                                                                                  88
                                                                                                 44           29             27       23

                                                              2011A   2012A      2013A       2014A          2015A          2015A 3   2016A
    1 Revenue values include eliminations
    2 LFL basis excluding FX impact
    3 Excluding Italy and Peru discontinued operations

                                                                                                                                      June 2017 | Page 20
3. Company Strategy

                      June 2017 | Page 21
Strategy Focusing on Higher Margins and Lower Debt Loads

                                                                                                          EBITDA impact   Cash Flow impact
                                                    New distribution channels (Self Service Terminals,
                     Products & Services             Mobile)
                           focus                    Sport betting
                                                    VLT monitoring

                                                    Core system
                        Technology as
 Global offering           enabler                  Content management
                                                    CRM

                         Operational                Referencing in 50+ jurisdictions
                          excellence                Fertilization
                        (“know how”)

                     In existing                                              Examples
                      business             Local relations/ know how
                                                                                Intralot de Peru
                                           Regulatory constraints
Local partnerships                         Capital release (equity/ capex)
                                                                                Intralot Italia
                                                                                Eurobet
                       In new              Topline and cost synergies
                      ventures

                                                    Globalization
                         Operational                Synergies
                                                    Operating leverage

                                                    Non core asset disposal
   Efficiencies             Asset                   WC optimization

                                                    De-leverage
                          Financing                 Debt re-pricing

              Shift to “asset-light” business model generating positive EBITDA and Cash Flow impact

                                                                                                                                   June 2017 | Page 22
Progress against strategic objectives

                                                                                                            Year 1
                                                     Progress                                           Progress Level

        EBITDA                                                                          € +11m

        Cash Flow1                                                                     € +24 m

        Net Debt / EBITDA                                                                     2.8                             2017 Target is
                                                                                                                               to focus on
                                                     Strategic partnership with AMELCO                                        operational
        Global offering
                                                     Lotos 10 completion is expected within 2017                              efficiencies

                                                    Successful
                                                     Merger of activities in Italy with Gamenet
                                                     Sale of 80% of INTRALOT de Peru
        Local partnerships
                                                     Acquisition of 49% stake in Eurobet
                                                    Delay
                                                     Oceania transaction

                                                     Successful refinancing with decreased servicing
        Efficiencies                                  cost and increased committed lines in the new
                                                      RCF

1
                                                                                                             Low         Medium   High
    Assuming that all new EBITDA is cash; Benefits from refinancing will be visible from 2017 onwards
                                                                                                                                         June 2017 | Page 23
4. Performance Overview & Financials

                                       June 2017 | Page 24
Recent Business Milestones

                                        Key Events Over the Last Twelve Months

             Amelco – INTRALOT and AMELCO announced the signing of a definitive agreement for a strategic
             partnership to develop a suite of next-generation sports betting products
       Mar

             Greece (OPAP) – After 20 years of successful partnership, INTRALOT’s contract with OPAP may end in
2017

             2018
       Feb

             USA (Idaho) – Signed contract to become the Idaho Lottery provider for a 10-year term with the option to
             extend for up to a maximum of two (2) additional 5-year terms
       Jan

             Chile – Successful Go Live of the 10 year term contract with the State Lottery organization
       Nov

             Peru – Completion of the Intralot de Peru transaction (Nexus Group)

             Morocco – Signed a 1-year extension with both lotteries
       Sep

             Successful early Refinancing of a €250m bond with significantly better terms and increased RCF lines by
             €40m
       Aug

             Australia and New Zealand – INTRALOT entered into discussions on an exclusive basis with
             Tatts regarding a potential sale of INTRALOT’s Australian and New Zealand businesses
       Jul
2016

             Bulgaria – Completion of the acquisition of a 49% stake in Eurobet, a numerical and instants tickets
             operator in Bulgaria
       Jun

             Italy – Completion of the Gamenet transaction
       May

             Philippines - Renewal of the contract with Pacific Online Systems Corporation (POSC) for a 3 year term
       Apr

             Netherlands - Renewal of the contract with the Nederlandse Staatsloterij/De Lotto for a 3 year term
       Mar

              Brazil - Renewal of the contract in with Minas Gerais for a 6 year term

                                                                                                                        June 2017 | Page 25
Healthy FY16 Performance

                                     Key Metrics (€mm)                                                                                 Key Takeaways
                                               Revenues                                                       Healthy revenue growth both in FY16 and 4Q16 (+7.1% and +7.5%
                                                                                                               respectively, compared to the same prior year period)
                         +7.1%
            1,235                     1,324                                                                   Increased sales in Bulgaria, Turkey and North America more than
                                                                                                               counterbalanced decreased sales in Azerbaijan and South America
                                                                              +7.5%
                                                                  341                        366               (Argentina, Jamaica and Brazil)
                                                                                                              EBITDA in the twelve-month period grew by 6.6%, whereas 4Q16
           12M15                      12M16                      4Q15                       4Q16
                                                                                                               EBITDA increased by 18.6%
                                                 EBITDA                                                       On a yearly basis, EBITDA margin, from continuing operations,
 Margin:   13.3%                      13.3%                      12.8%                      14.1%              remained steady at 13.3%, showcasing operating profitability
                                                                                                               resilience as the Group fully absorbed a payout ratio increase of
              165                        176
                                                                             +18.6%                            3.5pps
                                                                    44                         52
                                                                                                              Operating Cash-flow increased significantly in FY16 at €168.1m vs.
             12M15                     12M16                       4Q15                      4Q16              €113.8m in FY15. The growth is mainly attributed to WC
                                                                                                               improvement (+€46.8m vs. FY2015) due to efficient management
                                       Operating cash flow                                                     and WC normalization

                                                                               168

                          114                                                                              “The strongly positive results of 2016 in both growth and profitability
                                                                                                           reflect important transformations that have taken place over the past
                                                                                                           couple of years across operational capabilities, project management,
                                                                                                           cost structure, and Products and Services portfolio investments. A
                        12M15                                                 12M16
                                                                                                           series of M&A transactions greatly enhanced our business
                                               Net capex1                                                  development potential through strong local partnerships and diversified
                                                                                                           portfolio offering. The past year was also marked by tremendous
                           69
                                                                                                           improvements in INTRALOT’s financial structure in a way that secures
                                                                                63                         future savings and a clear funding horizon until 2021 while affirming
                                                                                                           international investors’ confidence in future value creation.”

                        12M15                                                 12M16                                                            Antonios Kerastaris, Group CEO

Note: FY and 4Q results do not include discontinued operations in Italy, Peru and Russia
1 Purchases of tangible and intangible assets less proceeds from sales of tangible and intangible assets

                                                                                                                                                                               June 2017 | Page 26
1Q17 Performance

                                      Key metrics (€m)                                                                                           Key takeaways
                                              Revenues                                                                Revenue growth in 1Q17 (+20.6% compared to the same period for
                                               +20.6%                                                                  the prior year)
                                                                           368
                           305                                                                                        Increased sales in Bulgaria, Azerbaijan, and Jamaica more than
                                                                                                                       counterbalanced decreased sales in the US due to last year’s
                                                                                                                       excessive Powerball effect
                           1Q16                                           1Q17                                        EBITDA in the three month period grew by 4.3% compared to 1Q16
                                                   EBITDA                                                             On a yearly basis, EBITDA margin, from continuing operations,
              14.6%
                                                                                                                       decreased to 12.6% compared to 14.6% in 1Q16, as a result of the
    Margin:                                                                                   12.6%
                                                                                                                       product mix change and last year’s Powerball effect
                                                                              47
                             45                                                                                       Operating Cash-flow posted a decrease in 1Q17 at €39.1m vs.
                                                                                                                       €41.2m in 1Q16. On a pro-forma basis, i.e. excluding the operating
                                                                                                                       cash-flow contribution of our Italian and Peruvian entities in 1Q16
                            1Q16                                            1Q17                                       (€7.0m), there is a significant improvement (€39.1m vs. €34.2m
                                      Operating Cash Flow                                                              pro-forma) driven by better EBITDA performance, less taxes and
                                                                                                                       improved working capital compared to the prior year
                      41
                                     34
                                                                    39                                                 “Robust revenue growth and improved profits registered in
                                                                                                                       1Q2017 is driven by our strategic decisions to focus on key
                                                                                                                       markets as well as products & services portfolio
                  1Q16        1Q16 Pro-Forma2                      1Q17
                                                                                                                       diversification. All the transformational initiatives undertaken
                                                                                                                       over the last two years are depicted both at profit and cash-
                                             Net Capex1
                                                                                                                       flow levels, considerably improved from a year ago. With a
                                                                                        €11.7m                         significantly improved financial structure and operational
                                                                    25
                                                                                      towards the                      performance, we are also reaping the fruits of lower debt
                      11             11                                                AMELCO                          servicing costs and enhancing our credit grade outlook by
                                                                                       agreement                       rating agencies that boost our confidence going forward.”
                                               2
                 1Q16        1Q16 Pro-Forma                       1Q17                                                                               Antonios Kerastaris, Group CEO
1 Purchases of tangible and intangible assets less proceeds from sales of tangible and intangible assets
2 Figures excluding the operating cash-flow & net CAPEX contribution of our Italian and Peruvian entities in 1Q16 (€7.0m & €0.5m respectively)

                                                                                                                                                                                   June 2017 | Page 27
Key Performance Highlights

                                           Revenues                                                                                        EBITDA and EBITDA margin
                                                                                                                                                   EBITDA           EBITDA Margin
    €m                                                                                                           €m
                                  1,915                                                                                                                                                    14.6%
                    1,853                                                                                                                                         13.3%       13.3%
                                                                                                                     12.7%                                                                                12.6%
      1,539
                                                              1,324                                                                 9.5%          9.3%
                                                1,235

                                                                                                                       195           175           177                             176
                                                                             305             368                                                                   165

                                                                                                                                                                                             45            47
                                                        1             1             1                                                                                                                1
     2013A         2014A          2015A        2015A         2016A          2016Q1      2017Q1                       2013A         2014A         2015A            2015A 1     2016A 1 2016Q1             2017Q1

                       Operating cash flow and capex                                                                                 Net debt2 and Net debt / EBITDA3
    €m                               Operating CF           CAPEX                                                €m                              Net Debt           Net Debt/EBITDA

                                                     168                                                                                                   2.9x                           2.9x            2.9x
                     153                                                                                                                                                    2.8x
     139
                                                                                                                         2.1x            2.2x
                                     114

                             67              71              65
            58                                                                                                                                                            495                             509
                                                                                                                                                           478                            487
                                                                       41               39                              403             381
                                                                                              25
                                                                              11

                                                                                                                                                                                                 4
         2013A         2014A           2015A            2016A          2016Q1           2017Q1                        2013A            2014A              2015A          2016A           2016Q1          2017Q1

1 12M15,12M16    & 1Q16 results do not include discontinued operations in Italy, Peru and Russia
2 Net debt calculated as Long-term debt plus Short-term debt and current portion of long-term debt plus Financial Leases less Cash and cash equivalents
3 Calculated as Net debt divided by LTM EBITDA
4 2016Q1 Net Debt & LTM excludes the contribution of Italy and Peru

                                                                                                                                                                                                            June 2017 | Page 28
Loan Portfolio

7yr Senior Unsecured Notes                  Global Coordinators:

Nominal
                        €250 mil.
amount                                      Joint Book runners:
Expiration         May 15, 2021 – NC 3

Coupon                   6.00%

5yr Senior Unsecured Notes
Nominal                                      Joint Book runners:
                        €250 mil.
amount
Expiration      September 15, 2021 – NC 2
                                                  Co-Managers:
Coupon                   6.75%

Committed Facilities
Amount
                 Approved lines €240 mil.
Expiration              Dec. 2019                 Participant banks:

Interest Rate     4.00%-5.50% + Euribor

                                                                       June 2017 | Page 29
Rating Agencies and INTRALOT

                                            “Our assessment of Intralot's business risk
                                            profile is constrained by its significant
                                            exposure to emerging markets…we
                                            acknowledge that the disposals in Italy
                                            and Peru have improved group margins
                                            and somewhat reduced its exposure to
                                            emerging markets”
                                            S&P Global Ratings

                                                                                 “Intralot's corporate family rating (CFR)
                                                                                 primarily reflects… the reduced company's
                                                                                 size following recent M&A
                                                                                 activity…significant exposure to certain
                                                                                 emerging markets…”
                                                                                 MOODY’s Investors Service

                                                                                                                                GR
                                                  Rating agencies                 Rating      Outlook       Change1          Sovereign
                                                                                                                              Rating

          “Although Intralot’s high gross                                            B         Stable                           Β-
          leverage remains not fully
          aligned with a ‘B+’ rating, the                                           B+         Stable                          CCC
          business profile is
          commensurate with a ‘BB’
          rating category for the sector”                                           B1        Negative      Pending            Caa3
          Fitch Ratings

                                                     1Change   compared to 2016 rating
                                                                                                                             June 2017 | Page 30
Financial Policy

 Maximum leverage      Aiming at a net leverage below 2.0x within the next years. INTRALOT can tolerate a peak leverage at up to
     tolerated         3.00x. Limits to be reviewed post M&A and expectations on new projects

 Cash, liquidity and   Maintain strong liquidity at all times. Most of the cash held in the UK, The Netherlands & Luxembourg whereas
 debt management       our reliance on the Greek banking system is limited to less than 7% of total deposits

                       INTRALOT’s new strategy is expected to result in a lower level of capex. INTRALOT maintains flexibility in its
      CAPEX
                       capex plan to meet its financial policy guidelines.

Acquisition strategy   No material acquisitions contemplated in the medium term

                       INTRALOT is currently not paying any dividends to its shareholders and does not intend to pay dividends in the
  Dividend policy
                       future until target leverage is achieved

                       Working capital has improved significantly in 2016 following the spike in 2015 and is not expected to have
  Working capital
                       significant spikes in the next years

 Currency and risk     Surplus cash is regularly converted from local currencies into EUR or USD (> 50% of deposits) whereas FX risk
   management          related to the payment of dividends is mitigated via Forwards .

                       IFRS standards, matching all international standards for corporate governance, reporting systems aligned to
    Accounting
                       listed companies

                                                                                                                               June 2017 | Page 31
5. Conclusion

                June 2017 | Page 32
INTRALOT – A Global Gaming Technology and Service
    Company
    1                                             Presence in 32 countries on 5 continents balanced between developed markets and developing markets
                                                      Developed markets offer access via long term contracts to stable recurring revenues while developing markets provide exposure
         Global offering                               to higher GDP growth
         with local                                   No country contributes more than 20% of FY16 EBITDA1
         partnerships                             Strong contract diversity
                                                      Portfolio of 87 contracts and licenses across 55 jurisdictions and 5 continents
                                                  Focus on profitable markets and contracts
    2                                             Global leader with more than 130 patents in gaming technology and gaming management contracts
                                                  In IT lotteries, 24% market share in the US (10 states + DC) and c.48% market share in Argentina (11 states)
         Gaming
         technology                               Innovative end to end solutions in every business activity
         leadership                               Focus on core areas of expertise primarily recurring long-term managed services and technology contracts which do not require
                                                   significant capital investments
                                                  1st Vendor to Achieve WLA SCS Certification; 17 operations certified as per both WLA (SCS) and ISO 27001 security certifications
    3                                             Contracts with long-term duration provide stability to revenue streams
         Revenue                                       Until 2021, 85% of revenues are secured through multi-year contracts or renewable licenses
         visibility and                                Average contract term of 8 years
         improved                                      Strong track record of contracts renewal
         margins                                  Shift to “asset-light” business model driving higher margin, lower capex performance and higher cash flow resiliency
                                                  Highly flexible cost base with c.85% of costs variable

    4 Sustainable                                 Cash proceeds from business sales and asset-light shift used to reduce debt
         capital                                  Group to benefit from lower interest costs
         structure                                Focus on more conservative financial policy

    5                                             Maintain strong liquidity at all times
                                                       Most of the cash is held in the UK, The Netherlands & Luxembourg whereas reliance on the Greek banking system is limited to
                                                        less than 7% of total deposits
          Financial
                                                  New asset-light shift is expected to result in lower and more flexible level of capex
          policy
                                                  No material acquisitions contemplated in the medium term
                                                  INTRALOT is currently not paying any dividends to its shareholders and does not intend to pay dividends in the future until target
                                                   leverage is achieved
1   Excluding countries with negative EBITDA
                                                                                                                                                                                   June 2017 | Page 33
6. Appendix

              June 2017 | Page 34
Financial Performance – P&L
     in €m                                                         2013A      2014A      2015A      2015A1     2016A1

     Revenue                                                       1,539.4    1,853.1    1,914.9    1,235.5    1,323.6

     Cost of sales                                                 -1,271.5   -1,582.9   -1,653.3   -1,001.7   -1,090.5

     Gross profit                                                   267.9      270.2      261.6      233.7      233.1

     Other operating income                                         17.4       18.6       24.9       23.1       33.1

     Selling expenses                                               -40.2      -60.3      -66.4      -56.6      -56.3

     Administrative expenses                                       -120.8     -119.9     -125.0      -89.7      -87.4

     Research and development expenses                               -7.0       -7.2       -6.1       -6.1       -4.7

     Other operating expenses                                       -14.0      -13.3      -10.0       -5.2       -9.9

     EBIT                                                           103.3      88.1       79.0       99.3       107.9

     % margin                                                        7%         5%         4%         8%         8%

     EBITDA                                                         194.8      175.4      177.2      164.9      175.8

     % margin                                                       13%        10%         9%        13%        13%

     Income/(expenses) from participations and investments          12.4        0.0        -0.2       -0.2      -17.5

     Gain/(loss) from assets disposal, impairment and write-off      -3.0       -1.5       -2.0       -0.7       -8.6

     Interest and similar charges                                   -55.4      -70.8      -68.6      -67.8      -87.5

     Interest and related income                                    10.4       12.5       18.0       17.9       11.8

     Exchange differences                                           -11.1      10.6        3.6        3.5        3.1

     Profit/(loss) from equity method consolidation                  -3.0       -2.3       -4.1       -4.1       -4.6

     Operating profit/loss before tax from continuing operations    53.6       36.6       25.7       47.9        4.8

     Taxes                                                          -32.2      -44.2      -46.4      -45.1      -32.5

     Net profit/loss from continuing operations                     21.4        -7.6      -20.7       2.8       -27.8

     Net profit/loss from discontinued operations                    0.0        0.0        0.0       -23.4      72.6

     Net profit/loss (continuing & discontinued operations)         21.4        -7.6      -20.7      -20.7      44.9

     Other comprehensive income/(expense) after tax                 -33.9       5.6        -7.2       -7.2       -8.7

     Total income after tax                                         -12.6       -2.1      -27.8      -27.8      36.1

1   Excluding Italy and Peru discontinued operations
                                                                                                                          June 2017 | Page 35
Financial Performance – Balance Sheet
 in €m                                                   2013A     2014A     2015A     2016A
 Assets
 Non-current assets
 Tangible fixed assets                                   199.4     182.8     166.4     127.0
 Investment property                                      0.0       0.0       5.8       6.0
 Intangible assets                                       353.4     348.9     328.8     329.6
 Investment in subsidiaries and associates               25.8      32.6      40.9      180.8
 Other financial assets                                  43.5      36.9      26.1      21.9
 Deferred tax assets                                     14.7       9.0       9.1       6.8
 Other long term receivables                             77.5      60.6      70.2      22.4

 Current assets
 Inventories                                              48.3      52.0      42.6      32.3
 Trade and other short-term receivables                   221.3     215.1     202.7     170.0
 Other financial assets                                    3.6       0.3       0.0       0.0
 Cash and cash equivalents                               1,43.3     416.9     276.6     164.4
 Total assets                                            1,130.8   1,355.1   1,169.3   1,061.1

 Equity and liabilities
 Share capital                                            47.7      47.7      47.7      47.7
 Treasury shares                                           0.0      -0.5      -0.5      -1.7
 Other reserves                                           63.8      59.8      62.2      56.0
 Foreign currency translation                            -61.0     -57.1     -59.4     -61.2
 Retained earnings                                       215.8     167.6      79.6      86.7
 Minority interest                                        77.4     100.0      77.8      68.9
 Total equity                                            343.7     317.5     207.4     196.5
 Non-current liabilities
 Long-term debt                                          350.3     557.4     716.1     643.9
 Staff retirement indemnities                             6.9       7.1       6.9       5.4
 Other long-term provisions                              13.7       6.1       6.6      10.9
 Deferred tax liabilities                                 8.1      14.7      16.1      16.0
 Other long-term liabilities                             12.1      14.2      19.1      17.3
 Finance lease obligation                                19.2       8.6       2.0       0.7

 Current liabilities
 Trade and other short-term liabilities                   181.4     175.4     135.3     128.1
 Short-term debt and current portion of long-term debt    176.9     232.3     36.2      14.7
 Current income taxes payable                             11.3      13.6      15.0      17.6
 Short-term provision                                      7.2       8.2       8.6      10.0
 Total liabilities                                        787.1    1037.6     961.9     864.6
 Total equity and liabilities                            1,130.8   1,355.1   1,169.3   1,061.1

                                                                                                 June 2017 | Page 36
Financial Performance – Cash Flow Statement
 in €m                                                                                 2013A    2014A    2015A    2016A
 EBITDA                                                                                194.8    175.4    177.2    175.8
 Interest and similar expenses                                                          -55.4    -70.8    -68.6    -87.5
 Interest and related income                                                             10.4     12.5    18.0      11.8
 Exchange differences                                                                   -11.1     10.6      3.6      3.1
 Profit/(loss) equity method consolidation                                               -3.0     -2.3     -4.1     -4.6
 Gain/(loss) from assets disposal, impairment and write-off                              -3.0     -1.5     -2.0     -8.6
 Income/(expenses) from participations and investments                                   12.4      0.0     -0.2    -17.5
 Depreciation and amortization                                                          -91.5    -87.3    -98.2    -67.9
 Net profit before taxation from continuing operations                                   53.6     36.6    25.7       4.8
 Net profit before taxation from discontinued operations                                  –         –        -      84.5
 Net profit before taxation from total operations                                        53.6     36.6    25.7      89.3
 Depreciation and amortization                                                           91.5     87.3    98.2      86.9
 Provisions                                                                              14.6     10.8      9.6     25.4
 Results from investing activities                                                       -2.6    -10.5     -0.2    -88.9
 Interest and similar expenses                                                           55.4     70.8    68.6      88.8
 Interest and related income                                                            -10.4    -12.5    -18.0    -12.0
 Decrease/(increase) of Inventories                                                      -3.9     -5.2      1.2      2.8
 Decrease/(increase) of Receivable Accounts                                             -67.3     14.9    -19.2     -9.2
 (Decrease)/increase of Payable Accounts (except Banks)                                  43.7    -10.2    -23.9     11.2
 Income tax paid                                                                        -35.5    -29.0    -28.2    -26.2
 Net Cash from Operating Activities                                                    139.1    153.0    113.8    168.1

 (Purchases)/Sales of subsidiaries, associates, joint ventures and other investments   -22.9      7.5     -5.3     4.5
 Purchases of tangible and intangible assets                                           -58.2    -67.3    -70.8    -65.4
 Proceeds from sales of tangible and intangible assets                                  0.4       0.3      2.1     2.6
 Interest received                                                                      8.6      13.6    12.3      7.7
 Dividends received                                                                     2.6       1.0      1.9     1.0
 Net Cash from Investing Activities                                                    -69.5    -44.9    -59.8    -49.6

 Subsidiary's capital return                                                             0.0       0.0     0.0      -3.3
 Purchase of treasury shares                                                             0.0      -0.4     0.0      -1.2
 Cash inflows from loans                                                               492.4     521.2    61.4     303.8
 Repayment of loans                                                                    -472.3   -255.5    -58.8   -388.4
 Bond buy backs                                                                           –       -6.3    -40.9     -3.7
 Repayment of leasing obligations                                                        -6.9    -12.2    -11.5     -6.8
 Interest and similar expenses paid                                                     -37.8    -66.1    -64.8    -83.5
 Dividends paid                                                                         -16.6    -23.7    -67.7    -42.2
 Net Cash from Financing Activities                                                     -41.2    157.0   -182.3   -225.3

 Net increase/(decrease) in cash and cash equivalents for the period                   28.4     265.1    -128.3   -106.8

                                                                                                                           June 2017 | Page 37
. A GLOBAL LEADER
. YOUR LOCAL PARTNER

                    June 2017 | Page 38
You can also read