Results for the six months ended 30 June 2020 - H1 2020 Neal Froneman

Page created by Thomas Stephens
 
CONTINUE READING
Results for the six months ended 30 June 2020 - H1 2020 Neal Froneman
Results for the six months
    ended 30 June 2020
                   H1 2020
                 Neal Froneman

                  27 August 2020
Results for the six months ended 30 June 2020 - H1 2020 Neal Froneman
Disclaimer

The information in this announcement may contain forward-looking statements within the meaning of the “safe harbour” provisions of the United States Private Securities Litigation
Reform Act of 1995. These forward-looking statements, including, among others, those relating to Sibanye Stillwater Limited’s (“Sibanye-Stillwater” or the “Group”) financial
positions, business strategies, plans and objectives of management for future operations, are necessarily estimates reflecting the best judgment of the senior management and
directors of Sibanye-Stillwater.
All statements other than statements of historical facts included in this announcement may be forward-looking statements. Forward-looking statements also often use words such
as “will”, “forecast”, “potential”, “estimate”, “expect” and words of similar meaning. By their nature, forward-looking statements involve risk and uncertainty because they relate to
future events and circumstances and should be considered in light of various important factors, including those set forth in this disclaimer. Readers are cautioned not to place
undue reliance on such statements.
The important factors that could cause Sibanye-Stillwater’s actual results, performance or achievements to differ materially from those in the forward-looking statements include,
among others, our future business prospects; financial positions; debt position and our ability to reduce debt leverage; business, political and social conditions in the United States,
South Africa, Zimbabwe and elsewhere; plans and objectives of management for future operations; our ability to obtain the benefits of any streaming arrangements or pipeline
financing; our ability to service our bond instruments; changes in assumptions underlying Sibanye-Stillwater’s estimation of their current mineral reserves and resources; the ability to
achieve anticipated efficiencies and other cost savings in connection with past, ongoing and future acquisitions, as well as at existing operations; our ability to achieve steady
state production at the Blitz project; the success of Sibanye-Stillwater’s business strategy; exploration and development activities; the ability of Sibanye-Stillwater to comply with
requirements that they operate in a sustainable manner; changes in the market price of gold, PGMs and/or uranium; the occurrence of hazards associated with underground and
surface gold, PGMs and uranium mining; the occurrence of labour disruptions and industrial action; the availability, terms and deployment of capital or credit; changes in relevant
government regulations, particularly environmental, tax, health and safety regulations and new legislation affecting water, mining, mineral rights and business ownership, including
any interpretations thereof which may be subject to dispute; the outcome and consequence of any potential or pending litigation or regulatory proceedings or other
environmental, health and safety issues; power disruptions, constraints and cost increases; supply chain shortages and increases in the price of production inputs; fluctuations in
exchange rates, currency devaluations, inflation and other macro-economic monetary policies; the occurrence of temporary stoppages of mines for safety incidents and
unplanned maintenance; the ability to hire and retain senior management or sufficient technically skilled employees, as well as their ability to achieve sufficient representation of
historically disadvantaged South Africans in management positions; failure of information technology and communications systems; the adequacy of insurance coverage;
any social unrest, sickness or natural or man-made disaster at informal settlements in the vicinity of some of Sibanye-Stillwater’s operations; and the impact of HIV, tuberculosis
and the spread of other contagious diseases, such as coronavirus (“COVID-19”). Further details of potential risks and uncertainties affecting Sibanye-Stillwater are described in
Sibanye-Stillwater’s filings with the Johannesburg Stock Exchange and the United States Securities and Exchange Commission, including the Integrated Annual Report and the
Annual Report on Form 20-F.
These forward-looking statements speak only as of the date of the content. Sibanye-Stillwater expressly disclaims any obligation or undertaking to update or revise any forward-
looking statement (except to the extent legally required).

                                                                                                                                                                                       2
Results for the six months ended 30 June 2020 - H1 2020 Neal Froneman
Delivering on our strategic focus areas

Strengthen our position
as a leading international
precious metals mining
company by:

Consistent focus on delivery of key strategic goals
                                                      3
Results for the six months ended 30 June 2020 - H1 2020 Neal Froneman
Progressive execution of our strategic goals

 Strategic focus areas…                        Progress made/delivery                                                                                                                  August 2020

                                               • Leadership resilience strengthened
 Building a values-based
                                               • Values based culture adoption accelerated through the COVID-19 challenges
 organisational culture
                                               • Culture programme embedding values based decision making
                                               • Safety strategy delivering significant safety performance improvements
 Ensuring safe production
                                               • Operating segment strategies to enhance operational effectiveness - working with COVID-19
 and operational excellence
                                               • Progress made towards a digital first organisation
                                               • Substantial support provided to alleviate social distress in mining communities from COVID-19
 Embedding ESG excellence
                                               • ICMM membership obtained, various recognitions received for ESG achievements
 in the way we do business
                                               • ESG strategy progressing to meet sustainability performance expectations

                                               • 0.55x net debt: adjusted EBITDA1 - well below the 2.5x covenant and 1x internal target justifying
 De-leveraging
                                                 resumption of a sustainable dividend
 our balance sheet                             • Further opportunity to reduce gross debt with soft call of convertible bond in Oct 2020

                                               • Geographic diversity diluting exposure to SA socio-political context
 Addressing our
                                               • Active engagement on policy to promote competitiveness and business-led growth addressing
 SA discount                                     social and economic devastation of COVID-19

                                               • Automotive drive train, green energy and battery metal intelligence refined
 Pursuing value
                                               • Balance sheet strength to sustain building further stages of strategic growth in our international
 accretive growth                                operating footprint

Creating superior value to all our stakeholders through unwavering delivery of our strategy
1. The Group reports adjusted earnings before interest, taxes, depreciation and amortisation (EBITDA) based on the formula included in the facility agreements for compliance with the debt covenant
   formula. For a reconciliation of profit/loss before royalties and tax to adjusted EBITDA, see note 8.1 of the condensed consolidated interim financial statements in the H1 2020 results booklet    4
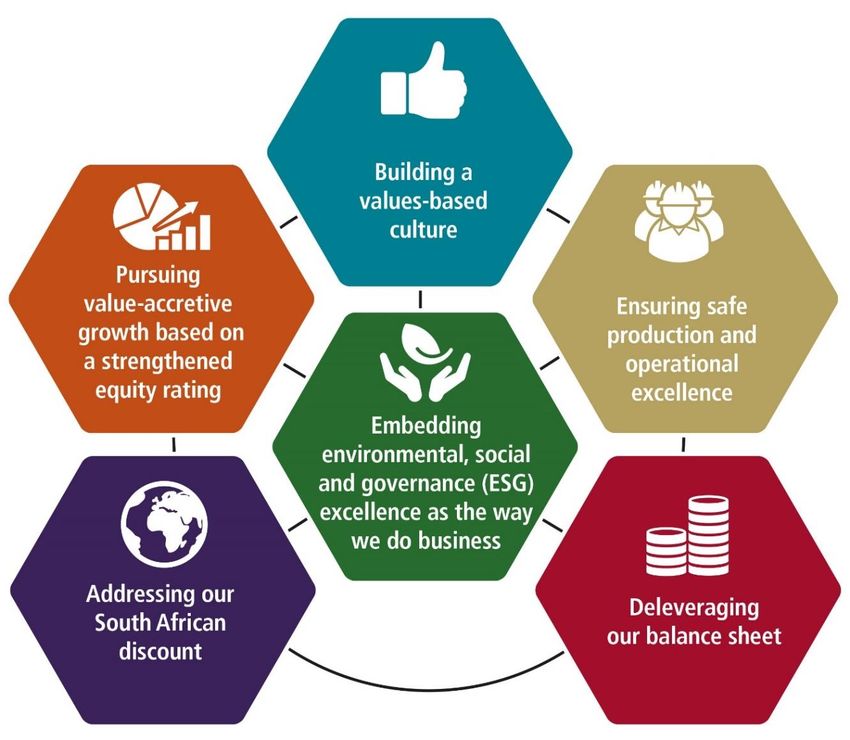
Results for the six months ended 30 June 2020 - H1 2020 Neal Froneman
Embedding
     ESG excellence in
the way we do business
Results for the six months ended 30 June 2020 - H1 2020 Neal Froneman
Impactful actions to assist vulnerable stakeholders during COVID-19

         Contributions                              Financial support                         Employee donations                        Counselling and
     to the SA relief funds                          for non-working                             matched by                          psychological support
                                                       employees                                the company                         extended to employees
             (R23.1 million)                              (R1.5 billion)                          (up to R2.0 million)                   and families

                Support to local                                   Social relief food parcels,                                 Schools and education
                small businesses                                     water tanks, blankets                                    sanitisation and catch-up
                                                                        and mattresses                                               programmes
                    (R14.5 million)                                             (R5.5 million)                                        (R3.0 million)

                          Health and safety                                                                    COVID-19 communication
                      preparedness and support                                                                 Education and awareness
             quarantine and isolation units with 2,196 beds*,
            PPE, oxygen tanks for health facilities, sanitisation,
                   tracking and tracing (R57.7 million)

*   Mine accommodation and hospital have been converted into isolation and quarantine facilities in line with COVID-19 guidelines                            6
Results for the six months ended 30 June 2020 - H1 2020 Neal Froneman
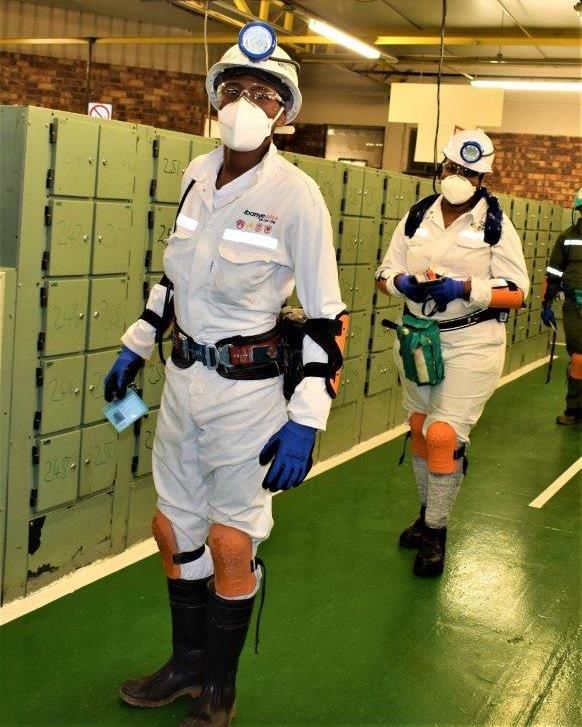
Commitment to renewal and restitution at Marikana

 • Acquired Lonmin with our eyes wide open regarding Marikana tragedy
 • An opportunity to create a new future with all stakeholders
 • Incorporation of the Marikana operations into Sibanye-Stillwater has ensured a sustainable future
   for all stakeholders
 • Fostering healing and closure by
      - providing ongoing counselling and emotional support for the widows and their families
      - six houses handed over to widows and balance will received houses by year end
      - pursuing unfulfilled justice and restitution for those affected
      - ensuring educational support and sustainability for the widows and the141 beneficiaries
      - honouring Lonmin’s outstanding SLP obligations and engaging on new SLP III commitments
                                                                                                                                                        Handing over of houses to widows

Wall of remembrance erected in memory of the fallen mineworkers   Daily prayer session during the week before the anniversary of the Marikana tragedy   One of the houses donated in August 2020

                                                                                                                                                                                                   7
Results for the six months ended 30 June 2020 - H1 2020 Neal Froneman
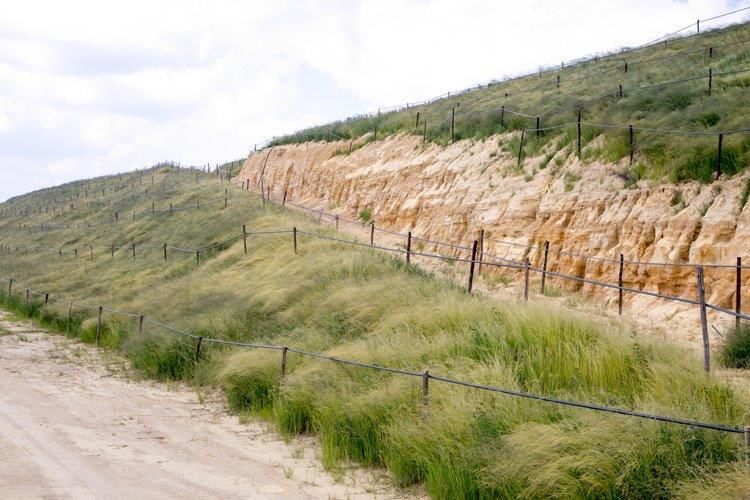
DRDGOLD – Rehabilitation through sustainable mining

    • Through our 50.1% investment in DRDGOLD
      we are creating positive change by removing
      the environmental legacy of SA gold mining
    • ESG highlights
       - continued investment in rehabilitation
       - hundreds of hectares cleared for
         development
       - vegetating tailings depositions reducing dust
         to the environment
       - COVID-19 social response of contributing
             › quarantine facility with 50 beds, R600,000
               for emergency care beds
             › R1.6m in employee contributions to Solidarity
               fund
             › 5,422 food parcels supplemented
               with support relief from 2,500+
               urban farmers*

For more information visit www.drdgold.com
*   As part of the Broad Based Livelihood urban farming initiative   8
Results for the six months ended 30 June 2020 - H1 2020 Neal Froneman
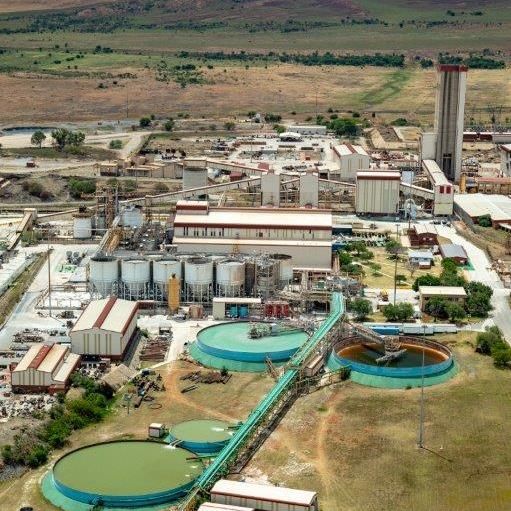
Recognition for our ESG efforts

          • Admitted as ICMM member in Feb 2020                          Marked 20 years of environmental and community collaboration
                                                                         under the Good Neighbor Agreement in the US PGM operations
             - rigorous evaluation process
          • CDP climate change disclosure
             - ‘A’ rating - one of only 179 companies globally and
               the only company from South Africa (SA)
          • Inclusion in the Bloomberg 2020 Gender-Equality Index
            (GEI)
             - one of 325 companies globally and one of only eight
               South African companies over 11 sectors
          • Re-included in the FTSE Russell ESG index of the JSE
          • Annual Rand Water awards
             - recognised as most ‘Collaborative’ and ‘water saving’
               company in the South African mining industry
          • Member of the World Gold Council

Embracing the journey to operate responsibly in the way we do business
                                                                                                                                        9
Results for the six months ended 30 June 2020 - H1 2020 Neal Froneman
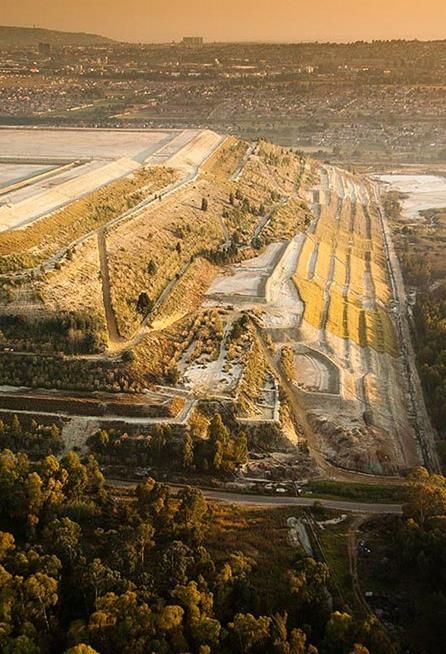
Ensuring
  safe production and
operational excellence
Progressive safety performance

 • Zero fatalities during Q2 2020 for Group                         Fatal injury frequency rate* (SA gold operations)
                                                              0.3
 • SA gold operations fatality free for almost two years
                                                                                             0.237
      - 710 days with 13 million fatality free shifts (FFS)
                                                              0.2
 • US PGM operations fatality free since Oct 2011
      - 3,194 days with 3 million FFS                                  0.108
                                                              0.1                 0.086
 • SA PGM operations fatality free since Mar 2020
      - 136 days with 2 million FFS                                                                          0          0     0
                                                              0.0
                                                                       2016       2017       2018       2019      Q1 2020   Q2 2020

                                                                    Serious injury frequency rate* (Group)
                                                              5.0
                                                                       4.16
                                                              4.0                 3.57        3.7
                                                                                                        3.01                 2.89
                                                              3.0                                                   2.63

                                                              2.0

                                                              1.0

                                                              0.0
                                                                       2016       2017       2018       2019      Q1 2020   Q2 2020
Source: Company information * Per million hours worked                                                                              11
Recognition for our safety achievements

 At the annual South African Mining Industry safety and health excellence awards,
 Sibanye-Stillwater was presented with various safety awards
  • JT Ryan Award - mining company with the best safety improvement
  • Platinum        - 1st place: Bathopele operations
                    - 3rd place: Kroondal West
  • Processing      - 1st place: ChromTech at the SA PGM operations
                    - 2nd place: Precious Metals Refinery in South Africa

Embracing the journey to operate responsibly in the way we do business

                                                                                    12
Responsible approach to COVID-19

           SA workforce attendance and productivity                          • US PGM operations largely unaffected outside
                                                                               of ongoing social distancing measures
     100
                                                                                - halted non-essential growth capital
                                                                             • US PGM operations achieved 89% of planned Q2
      80                                                                       mined production
                                                                             • SA operations - full lockdown from end March
      60                                                                       with re-staffing from end April 2020 focused on
                                                                               the prevention of COVID-19 transmission

      40                                                                     • SA gold and PGM production 54% and 47%
                                                                               of planned output during Q2 2020
                                                                             • By end of H1 2020
      20
                                                                                - SA gold @73% workforce and 86% output
                                                                                - SA PGM @65% workforce and 73% output
       0
                 March                 April             May       June      • Protocol to protect employees with
                   Q1                                    Q2
                                                                               co-morbidities implemented
           Total output as % of plan           SA gold    SA PGM
           % workforce                         SA gold    SA PGM

COVID-19 best practices and protocols developed and implemented at all operations
                                                                                                                                 13
Record earnings – despite COVID-19

 • Q2 2020 impacted by COVID-19 but anchored                                                                               Profitability (adjusted EBITDA 1) and gearing
   by strong Q1 2020
                                                                                                         20 000                                                                                               3
 • 8x increase in adjusted EBITDA1 year-on-year                                                                                                                2.6
                                                                                                                                                                            2.5
                                                                                                                                                       2.4                           2.4
                                                                                                                                          2.3
      - R16.5bn vs R2.0bn in H1 2019 (US$990m                                                            15 000
                                                                                                                                                                                              36%

                                                                                                                                                                                                                  Net debt: adjusted EBITDA ratio
        vs US$142m)                                                                                                                                                                                           2
                                                                                                         10 000
 • 94% of earnings from operations acquired
                                                                                                                                                                                              1.3

                                                                                             R million
   through successful acquisition strategy                                                                                                                                                    54%
                                                                                                          5 000
 • Deleveraged back to pre-acquisition levels                                                                                                                                                                 1

                                                                                                              0
                                                                                                                                  0.6                                                                  0.55
                                                                                                                     0.4                                                                      10%
                                                                                                         (5 000)                                                                                              0
                                                                                                                     H1           H2      H1           H2      H1           H2*      H1*          H2   H1

                                                                                                                           2016                 2017                 2018                  2019        2020

                                                                                                                   SA gold              SA PGM               US PGM               Net debt: adjusted EBITDA (rhs)

Cost and capital control, alongside working capital management, assisted with deleveraging despite COVID-19 disruptions

Source: Company results information
1. The Group reports adjusted earnings before interest, taxes, depreciation and amortisation (EBITDA) based on the formula included in the facility agreements for compliance with the debt covenant
    formula. For a reconciliation of profit/loss before royalties and tax to adjusted EBITDA, see note 8.1 of the condensed consolidated interim financial statements in the H1 2020 results booklet
*   H2 2018 and H1 2019 at the SA gold operations have been impacted by the five month gold strike from Nov 2018 to April 2019 with subsequent gradual build up to new normalised levels                          14
Exposure to the right commodities at the right time

                               3 year                             Produced                 Revenue
     Commodity        performance (%)                         prill split 2(%)     contribution 2(%)
 1   Rhodium                   1 041.5                                       4                    21
 2   Ruthenium                   315.4                                       6                    0.5
 3   Palladium                   138.3                                      28                    43
 4   Iridium                      69.6                                       2                    0.5
 5   Silver                       63.1
 6   Gold                         55.9                                      28                        21
 7   Iron Ore CFR                 50.6
 8   Nickel                       33.0
 9   Copper                       (0.6)
10   Platinum                     (1.7)                                     31                        14
11   NYM Rot fuel oil             (3.6)
12   NYM Sin fuel oil             (8.2)
13   Coking coal                  (8.6)
14   NYM HH NAT Gas              (10.2)
15   Tin                         (14.4)
16   NYM WTI Crude               (14.6)
17   Aluminium                   (14.8)
18   ICE Brent crude             (15.9)
19   Lead                        (16.5)
20   NYM NYH Gasoline            (19.2)

Sound fundamentals for the metals we produce with platinum market well placed for future upside
Source: JP Morgan; Bloomberg, period 1 January 2015 to 18 August 2020
Note: 1. Based on Johnson Matthey Spot Index
      2. Representing Group data for H1 2020. PGM prill splits including SA gold with production ounces, while revenue contribution is based on sold ounces   15
SA PGM operations – contributing 54% of Group adjusted EBITDA

                        SA PGM operations – Underground and surface production and AISC                                                               • Production 5% higher than H1 2019
                1 200                                                                                                              40 000               primarily due to the incorporation
                                                                                                                                                        of Marikana from June 2019
                                                                                                                                                      • Risk based ramp-up
                 900                                                                                                               30 000
                                                                                                                                                         - Q2 production at 47% levels offset
                                                                                                                                                           by higher 4E PGM basket price
   4E PGM koz

                                                                                                                                            R/4E oz
                                                                                                                                                         - build-up prioritised at mechanised
                 600                                                                                                               20 000
                                                                                                                                                           sections
                                                                                                                                                         - UG2 reef lower grade but higher
                 300                                                                                                               10 000
                                                                                                                                                           revenue than the conventional shafts
                                                                                                                                                         - PGM orebody is homogenous in
                                                                                                                                                           nature, provide less flexibility than gold
                   0                                                                                                               0                     - increased to @80% of workforce
                            H1 2018           H2 2018              H1 2019                H2 2019                H1 2020
                                                                                                                                                           in August
                            Underground (UG) production (4E)                          Surface production (4E)                                         • 42% adjusted EBITDA margin
                            R/4E oz average basket price (rhs)                        All-in sustaining cost (rhs)

Consistent operational performance ensuring leverage to higher rand 4E PGM basket price

Source: Company results information
1. The Group reports adjusted earnings before interest, taxes, depreciation and amortisation (EBITDA) based on the formula included in the facility agreements for compliance with the debt covenant formula.
   For a reconciliation of profit/loss before royalties and tax to adjusted EBITDA, see note 8.1 of the condensed consolidated interim financial statements in the H1 2020 results booklet. Adjusted EBITDA margin is
   calculated by dividing adjusted EBITDA by revenue                                                                                                                                                              16
Estimated annual Marikana operational synergies more than double

                                                                                                                                        Initial benefits      Realised benefits            Estimated
Category                                         Summary of key initiatives                                                                   identified      since acquisition       annual benefits*
Closure of London offices                        • Corporate rationalisation (closing London office and delisting)                                  138                          51               102

                                                 • Employees and management configured to reflect
Operating (mine) and regional shared
                                                   the Sibanye-Stillwater operating model                                                           374                         453               879
services synergies (Labour savings)
                                                 • Consolidation of duplicated production and support functions

                                                 • Footprint reduction
Optimal use of surface infrastructure                                                                                                               125                         230               592
                                                 • Concentrator consolidation/optimisation

Sourcing and stores management                   • Improved procurement and supply chain management                                                   30                          4                49
                                                 • Payroll system aligned to Sibanye-Stillwater
ICT                                              • SAP system consolidation for South Africa                                                          63                         44                88
                                                 • Infrastructure consolidation

                                                 • Functional optimisation                                                                             0                         69               141
Other
                                                 • Contractors optimisation                                                                            0                        197               527

                                                                                                                                         R730m p.a.                     R1.05bn        Up to R1.85bn*
Total                                            • Savings                                                                           (over 3-4 years)          (over 13 months)                (2020)
Additional possible savings                      • Processing synergies#                                                                            780                           0                 0

Financing cost savings                           • Refinancing of the US$169 million Lonmin PIM Prepay                                                 0                        120               210

Additional upside from future processing of Rustenburg ore

* Expected unaudited annual synergies of between 1.74 - 1.85bn have been calculated based on the current Marikana integration process
# Estimated savings should 24 months' notice to move Rustenburg material to the Marikana processing facilities. Initial R780m envisioned with R550m annual savings thereafter                        17
US PGM operations – contributing 36% of Group adjusted EBITDA1

                                   US PGM operations – Mined and recycling production and AISC                                                        • 5% higher production year-on-year
                                                                                                                                                      • Continued operations with reduced
                             800                                                                                              2 000                     contractor workforce at site
                                                                                                                                                      • High margin underground operations
                                                                                                                                                        - 60% adjusted EBITDA margin1
  2E/3E PGM koz production

                             600                                                                                              1 500
                                                                                                                                                      • Higher PGM prices added US$40/2Eoz
                                                                                                                                                        taxes & royalties to AISC

                                                                                                                                          US$/2E oz
                                                                                                                                                      • Reduction of recycling inventory
                             400                                                                                              1 000
                                                                                                                                                        releasing ~US$300m in working capital
                                                                                                                                                      • Q2 Autocat collections and deliveries
                             200                                                                                              500                       impacted by to COVID-19 impact
                                                                                                                                                      • Blitz build-up potential delay of
                                                                                                                                                        up to 18 months due to contractor
                              0                                                                                               0                         demobilisations, equipment delays and
                                      H1 2018          H2 2018         H1 2019        H2 2019               H1 2020                                     improved ore body understanding
                                       Mined production (2E)                     Recycling production (3E)                                            • FTM project proceeding as planned
                                       US$/2E oz average price (rhs)             All-in sustaining costs (rhs)

Geographical diversification benefits evident during lockdown in SA

Source: Company results information
1. The Group reports adjusted earnings before interest, taxes, depreciation and amortisation (EBITDA) based on the formula included in the facility agreements for compliance with the debt covenant formula.
   For a reconciliation of profit/loss before royalties and tax to adjusted EBITDA, see note 8.1 of the condensed consolidated interim financial statements in the H1 2020 results booklet. Adjusted EBITDA margin is
   calculated by dividing adjusted EBITDA by revenue                                                                                                                                                              18
SA gold operations – contributing 10% of Group adjusted EBITDA1

                   SA gold – Underground and surface production with adjusted EBITDA margin¹                                                          • 17% y-on-y increase in production
                                                                                                                                                         - H1 2019 disrupted by AMCU strike
             700                                                                                                              1 000 000
                                                                                                                                                      • Steady ramp-up post SA COVID-19
             600                                                                                                                                        lockdown
                                                                                                                              800 000
                                                                                                                                                         - Q2 production at 54% levels, offset
             500
                                                                                                                                                           by 28% higher rand gold prices
                                                                                                                              600 000
             400                                                                                                                                         - Increased to @90% of workforce

                                                                                                                                          AISC R/kg
  Gold koz

                                                                                                                                                           in August
             300
                                                                                                                              400 000
                                                                                                                                                      • Higher grade panels and surface
             200                                                                                                                                        production initially prioritised
                                                                                                                              200 000
             100
                                                                                                                                                      • 16% adjusted EBITDA margin1
                                                                                                                                                      • DRDGOLD produced 77Koz at an AISC
              0                                                                                                               0
                                                                                                                                                        R605,305/kg
                      H1 2018              H2 2018               H1 2019              H2 2019               H1 2020
                       Underground(UG) production                              Surface production
                       R/kg average gold price (rhs)                           All-in sustaining cost (rhs)

SA gold operations safe production build up after H1 2019 strike interrupted by COVID-19

Source: Company results information
1. The Group reports adjusted earnings before interest, taxes, depreciation and amortisation (EBITDA) based on the formula included in the facility agreements for compliance with the debt covenant formula.
   For a reconciliation of profit/loss before royalties and tax to adjusted EBITDA, see note 8.1 of the condensed consolidated interim financial statements in the H1 2020 results booklet. Adjusted EBITDA margin is
   calculated by dividing adjusted EBITDA by revenue                                                                                                                                                              19
Financial review
Balance sheet de-risked

     CFO, Charl Keyter
Deleveraged - with further reduction in gross debt possible with CB soft call

                           Net debt to adjusted EBITDA1 US$m                                                                                                              • Net debt reduced by 38%
                                                                                                                                                                            to US$930 million (R16.1 billion)
                   2 000                                                                                                               3.5                                  from US$1,497 million (R21.0 billion)

                                                                                                                                              Net debt: adjusted EBITDA
                                                                                                 Covenant                              3.0                                  in Dec 2019
                              2.98                                                                    limit
                   1 500                                                                                             Pro forma2
                                                                                                                                   2.5                                    • Trailing 12-month adjusted EBITDA
     US$ million

                                                                                                                      illustration
                                           2.43                                                                                                                             increasing to US$1,883 million
                                                                                                                         should    2.0
                   1 000                                                                                             convertible                                            (R29.5 billion) Net debt: adjusted
                                                           1.71                                  Leverage           bond convert 1.5                                        EBITDA1 reduced by 56% to 0.55x
                                                                                                    target
                                                                          1.25                                                         1.0                                  from 1.25x in Dec 2019
                    500
                                                                                          0.76                            0.23         0.5                                • Soft call option on the convertible bond
                                                                                                          0.55                                                              is in the money enabling redemption or
                      0                                                                                                                0.0
                                                                                                                                                                            conversion from October 2020
                              Mar          Jun             Sep            Dec             Mar              Jun             Jun
                                                                                                                        pro forma                                            - conversion of the bonds could
                                                    2019                                                         2020
                                                                                                                                                                               materially reduce debt and leverage,
                               Net debt excl Convertible bond (lhs)                   Convertible bond (lhs)                                                                   eliminating further revaluation costs,
                               Net debt: Adjusted EBITDA (rhs)                        Covenant limit (rhs)                                                                     as well as reduce annual coupon costs
                               Targeted leverage ratio (rhs)                                                                                                                   by US$7.2 million

Net debt reduced to US$930 million (R16.1 billion) with net debt: adjusted EBITDA of 0.55x as at 30 June 2020
1.       The Group reports adjusted earnings before interest, taxes, depreciation and amortisation (EBITDA) based on the formula included in the facility agreements for compliance with the debt covenant
         formula. For a reconciliation of profit/loss before royalties and tax to adjusted EBITDA, see note 8.1 of the condensed consolidated interim financial statements in the H1 2020 results booklet. Net debt:
         adjusted EBITDA ratios reported above are calculated in accordance with the facility covenant calculations which includes pro forma EBITDA for any acquisitions (i.e. adjusted to represent
         a full 12-month period, rather than as consolidated from date of acquisition for accounting purposes) in order to more accurately represent the enlarged entity post an acquisition
2.       Pro forma June 2020 net debt and net debt: adjusted EBITDA above assumes the convertible bond was converted as at 30 June 2020                                                                                21
Comfortably manageable debt maturities with good liquidity headroom

                         Debt maturity ladder at 30 June 2020 in US$ million                                                                               • Gross debt of US$1,622
                                                                                                                                                             (R28.1 billion) and net debt
                 2 000                                                                                                                                       of US$930 million (R16.1 billion)
                                                                                                           1621            692                             • The next meaningful debt
                 1 500                                                                       339                                                             maturity is the US$354 million
   US$ million

                                                                                                                                                             June 2022 bonds (book value
                 1 000                                          535                                                                      929                 of US$349 million/R6.1 billion)
                                                                                                                                                           • The Revolving Credit Facilities
                  500                                                                                                                                        (RCF’s) were 43% utilised and
                                                  349
                                                                                                                                                             are expected to be extended
                                                                                                                                                             or refinanced prior to their
                    0
                                                                                                                                                             maturities
                           2 020        2 021    2 022          2023          2024           2025      Gross debt       Cash on       Net debt
                                                                                                                         hand                              • Elevated cash on hand retained,
                                                                                                                                                             currently sufficient to cover all
                         US$600m USD RCF                     R5.5bn ZAR RCF                               US$354m 6.125% 2022 bonds
                                                                                                                                                             2020, 2021 and 2022 maturities
                         US$384m 1.875% 2023 convertible     US$347m 7.125% 2025 bonds                    Gross or net debt
                         Cash on hand

Cash on hand sufficient to cover all 2020, 2021 and 2022 debt maturities

1. Graph shows current book values of scheduled capital maturities
2. Maturities above are borrowings that have recourse to Sibanye-Stillwater and exclude the Burnstone debt whiles including the derivative financial instrument as detailed in note 8.1 of the notes in the
   financial statements                                                                                                                                                                                       22
Income statement for the six months ended 30 Jun 2020

                                                                              Rm                                                                               H1 2020             H1 2019        % variance
                                                                              Revenue                                                                            55,019              23,535               134
           134% increase in revenue                                           Cost of sales, before amortisation & depreciation                                 (37,725)            (20,662)               83
                                                                              Net other cash costs²                                                                (780)               (854)               (8)
                                                                              Adjusted EBITDA¹                                                                   16,514               2,019               718
   SA PGM -                                                                   Amortisation and depreciation                                                      (3,444)             (2,925)               18
   Marikana    US PGM 2E                             Rand gold                Net finance expense                                                                (1,206)             (1,284)               (6)
 included and US$/oz up 43%                         price up 45%              Gain/(loss) on financial instruments                                                1,554                (536)              390
4E R/oz up 92%                                                                (Loss)/gain on foreign exchange differences                                          (971)                 53            (1,932)
                                                                              Impairments                                                                            (1)                (93)              (99)
   Cost of sales up 83% including Marikana,                                   Gain on acquisition                                                                     -               1 103
             recycling costs and US royalties                                 Restructuring costs                                                                  (257)               (633)                 (59)
                                                                              Net other²                                                                             21                 101                  (79)
           Gain on financial instruments
                                                                              Profit/(loss) before royalties, carbon tax and tax                                 12,210              (2,195)                 656
   mainly fair value gains on Convertible bond
                                                                              Royalties                                                                            (425)               (117)                 263
                                                                              Carbon tax                                                                             (3)                  -
        Increase in tax due to profitability                                  Mining and income tax                                                              (2,051)              2,141                (196)
                                                                              Profit/(loss) for the period                                                        9,731                (171)              5,790
       Dividend of R0.50/share³ declared                                      Normalised earnings³                                                                8,845              (2,111)                519
               15% of normalised³ earnings                                    Earnings per share (cents)                                                            351                 (11)              3,290
                                                                              HEPS (cents)                                                                          350                 (54)                748

1. The Group reports adjusted earnings before interest, taxes, depreciation and amortisation (EBITDA) based on the formula included in the facility agreements for compliance with the debt covenant formula.
   For a reconciliation of profit/loss before royalties and tax to adjusted EBITDA, see note 8.1 of the relevant notes in the condensed consolidated interim financial statements
2. Lease payments are included in net other cash costs (added back in net other) to conform with the adjusted EBITDA reconciliation disclosed in note 8.1
3. Normalised earnings is a pro forma performance measure and is not a measure of performance under IFRS, may not be comparable to similarly titled measures of other companies, and should not be
   considered in isolation or as alternatives to profit before tax, profit for the year, cash from operating activities or any other measure of financial performance presented in accordance with IFRS. Dividend
   declaration by the Board - the continued uncertainties associated with the COVID-19 pandemic and volatility of commodity prices errs the Board to be cautious when declaring this interim dividend             23
Surge in earnings and degearing enable the return to dividends

                                          Normalised earnings/(loss) and dividend payments2                                                                          • Return to positive normalised earnings after two years
                                                                                                                                                                     • Interim dividend of 50 SA cents
                                10 000                                                                                               1 600
                                                                                                                                                                        - ~2.94¹ US cents per ordinary share or 11.8¹ US cents per ADR
                                 8 000                                                                              1338             1 400                           • Over R1.3bn declared in interim dividend
                                                                                                                                                                        - 15% of normalised earnings payout
                                                                                                                                     1 200
Normalised earnings (loss) Rm

                                                                                                                                             Dividend payment (Rm)
                                 6 000                                                                                                                                  - conservative interim dividend more than full gold dividends
                                                                                                                                     1 000                                2013-2015
                                 4 000                                        825 787
                                                                                                                                                                     • Also paid ~R135m to participants of the Marikana and Rustenburg
                                                                                                                                     800
                                 2 000                                                                                                                                 employee share option schemes
                                                      555         567                     560                                        600
                                                            450
                                     0
                                                                                                                                     400
                                                272
                                (2 000)                                                                                              200
                                                                        91

                                (4 000)                                                                                              0
                                                Dec

                                                            Dec

                                                                        Dec

                                                                                    Dec

                                                                                                Dec

                                                                                                            Dec

                                                                                                                        Dec
                                                                                                                              Jun*
                                          Jun

                                                      Jun

                                                                  Jun

                                                                              Jun

                                                                                          Jun

                                                                                                      Jun

                                                                                                                  Jun

                                           2013        2014        2015        2016        2017       2018        2019 2020
                                                Dividend paid (rhs)                        Normalised Earnings (lhs)

Dividends resume, based on earnings from a larger, more diversified asset base
* June 2020 interim dividend has been declared at 50 SA cents per share but not paid (bar just for illustrative purposes)
1. Converted at US$/R17.00 exchange rate
2. Exclude minority dividends payments by DRDGOLD due to the consolidation as recorded in the financial statements                                                                                                                       24
PGM market outlook

    CEO, Neal Froneman
PGM market – summary insights and outlook

               • Estimate 15% decline y-o-y in SA PGM production for 2020, due to COVID-19 lockdown - more severe impact on Rhodium
               • Recycling volumes affected by logistical constraints, staff shortages, liquidity and pipeline financing restrictions and economic
   Supply        uncertainty
               • Expected delay in rebuilding the inventory pipeline throughout the recycling value chain
               • We expect recycling supply to decline 15% y-o-y in 2020

               • Auto demand expected to fall 20% y-o-y to ~70 million passenger vehicles, despite V-shaped recovery in China and faster than
                 expected recovery in the US
  Demand       • We expect passenger vehicle sales back at 2019 levels by 2022
               • Temporary easing of palladium and rhodium demand due to implementation of China 6a pushed back from July 2020 to end of 2020
               • Our already bearish jewellery outlook revised down by 20% in 2020 and 2021

               •   Our longer term forecasts remain unchanged although Palladium deficits narrow over the short term
   Market      •   Rhodium moves closer to balance in 2020/2021, before moving back into deep and sustained deficits
               •   Platinum surplus narrows this year but increases in 2021 due to increased production from South Africa
  balance      •   We believe substitution of palladium with platinum in autocatalysts is inevitable to alleviate sustained palladium deficits
                   and to reduce OEM costs

COVID-19 only a short term impact on market balance
                                                                                                                                                     26
Guidance
and conclusion
2020 Annual guidance³

                                                                                                                                           Relative gold and PGM prices in rand and dollars

                 Production              All-in sustaining costs          Total capital
                                                                                                                                      90

US PGM
operations 620 - 650 koz                 US$830 - 860/oz                  US$250 - 270m
(2E mined)                                                                                                                            60

                                                                                                    Relative price performance (%)
SA PGM
                                         R19,700 - 21,000/4Eoz            R2,300m                                                     30
operations² 1.35 -1.45 moz²
                                         (US$1,159 - 1,235/4Eoz)¹         (US$135m)¹
(4E PGMs)

                                                                                                                                       0
SA gold
operations 23,500 - 24,500kg             R805,000 - R840,000/kg           R2,850m
(excluding (756koz - 812koz)             (US$1,473 - 1,491/oz)            (US$168m)
DRDGOLD)                                                                                                                             (30)
                                                                                                                                        Jan 20   Feb 20    Mar 20    Apr 20   May 20   Jun 20   Jul 20   Aug 20

                                                                                                                                             Gold US$/oz                Gold R/kg               PGM basket (R/4Eoz)
                                                                                                                                             PGM basket (US$/4Eoz)      PGM basket (US$/2Eoz)
Source: Company forecasts
1. Estimates are converted at an exchange rate of R17.00/US$
2. SA PGM operations’ production guidance include 50% of the attributable Mimosa production, although AISC and capital exclude Mimosa due it being equity accounted
3. Guidance does not take into account the impact of unplanned events (including unplanned COVID-19 related disruptions)
4. US PGM AISC are impacted by tax and royalties paid based on PGM prices, current guidance is based on spot 2E PGM prices at 20 Aug 2020                                                                         28
Undervalued compared to Peers

                                                                                  Market consensus analysis

  EV / EBITDA (2020e / 2021e)                            P / FCFPS (2020e / 2021e)                         Net debt / 2020e EBITDA                               EV & market cap (USDm)

                                                 10.9x                                          33.3x                                                                                        39 761
  Senior Gold¹                                           Senior Gold¹                                      Senior Gold¹                               0.5x       Senior Gold¹
                                          8.5x                                         19.8x                                                                                                35 573

                                     7.4x                                            17.7x                                                                                         13 142
 Intermediate                                            Intermediate                                         Sibanye-
                                                                                                                                                  0.4x           Senior PGM³
        Gold²                                                   Gold²                                         Stillwater
                                   6.1x                                           11.8x                                                                                            13 579

                                 5.8x                                             12.6x                                                                                          9 761
                                                                                                          Intermediate                                           Intermediate
  Senior PGM³                                            Senior PGM³                                                                           0.3x
                                                                                                                 Gold²                                                  Gold²
                             4.3x                                             6.6x                                                                                               9 116

                            3.7x                                              6.6x                                                                                               8 760
      Sibanye-                                              Sibanye-                                                                                                Sibanye-
                                                                                                           Senior PGM³                (0.2x)
      Stillwater                                            Stillwater                                                                                              Stillwater
                          2.5x                                             3.5x                                                                                                  7 797

Sources: Public information, FactSet, broker reports. Market data as of August 14, 2020
1. Senior Gold consists of Newmont, Barrick, Newcrest and Agnico Eagle
2. Intermediate Gold (excluding Sibanye – Stillwater) consists of Kirkland Lake, AngloGold, Northern Star, Kinross, Gold Fields, B2Gold, Evolution and Harmony
3. Senior PGM (excluding Sibanye – Stillwater) consists of Anglo American Platinum and Impala Platinum                                                                                           29
Questions?
                                            Contacts
    James Wellsted/ Henrika Ninham/ Chris Law
                      ir@sibanyestillwater.com
Tel: +27(0)83 453 4014/ +27(0)72 448 5910/ +44 (0)7923126200

       Website: www.sibanyestillwater.co.za

 Tickers: JSE: SSW and NYSE: SBSW
Appendix
Summary of COVID-19 contributions

Financial contributions                                                                                                                                                                                       Total
Contributions to the SA national relief funds                              Employee wages and benefits                                                  Employee volunteerism scheme                   R25.1 million
• Solidarity fund                                                          • Wages and benefits paid to employees during lockdown period                • Up to R1.0million employee donations will   contributions
  - Salary sacrifice by board and Executive = R2.1m                          = R1.5bn                                                                     be matched by company = potential           + R1.5 billion
                                                                                                                                                          R2.0m contribution                                wages
  - Additional corporate donation = R12.0m                                 • No obligation to pay even though no work no pay would legally apply
• SA Future Trust Fund
  - Corporate donation = R9.0m

Local community support                                                                                                                                                                                       Total
Support to local, small businesses                                         Social relief                                                                Schools and education                         R23.0 million
• CEO SMME fund (internal fund) to stimulate local economic growth         • 8 000 food parcels for indigent community members = R4m                    • School sanitisation and equipment and
  in local communities = R14.5m budget (R7.6 spend to date)                • 20 water tanks for communities around Marikana and donation                  support for catch up programme in
• Focused spend on local suppliers for COVID-19 related PPE                  of 600 blankets and mattresses for homeless shelters = R500 000              North West, Free State, Gauteng and
  (cloth PPE for employees’ families and old aged homes)                     - 1 388 food parcels in the Eastern cape in partnership with RMA             Eastern Cape = R3m
                                                                             - Backyard food program to enable families to grow their own food as       • Includes donations of thermometers,
                                                                               sustainable food security measure = R1m                                    smart boards, laptops for teachers

Health education and COVID-19 prevention support                                                                                                                                                              Total
Health preparedness and support                                            Employee health preparedness                                                 COVID-19 awareness communication              R57.7 million
• PPE for health facilities in local clinics (masks, gowns, gloves and     • Conversion of hostels to quarantine facilities in the Free State, West     • 10 000 leaflets with soaps delivered
  boots) = R2.0m                                                             Rand and Rustenburg plus securing hospital beds and other isolation          to communities
• Sanitisation of local health facilities, old age homes, taxi ranks and     quarantine facilities resulting in 2,194 available beds = R25.4m SA PGM    • Radio slots in local media around our
  schools = R3.0m                                                            + R3.8m SA gold                                                              operations
• Tracing and screening of employees in labour sending areas and           • Sanitisation preparation US facilities = R15.8m                            • Community billboards around our
  referrals for their families = R1.8m                                     • Medical App to trace, screen and educate employees = R2.5m                   operations
• Oxygen Industry Initiative with the donation of tanks, concentrator        annually                                                                   • Taxi rank communication
  and rebreather masks to support hospitals in the Eastern Cape            • Partnership with Gauteng Province on a facility (isolation or treatment)   • Awareness and cloth mask distribution
  (O.R.Tambo and Chris Hani hospitals) = R350 000                            in West Rand                                                                 to families of employees
• Face Shield Donation – 3 700 face shields produced by students           • Counselling support for employees families
  and volunteers at Wits University as part of our Digimine partnership    • Sanitisation of health facilities in North West, Gauteng, Free State and
  for use by clinics around our mines = R60 000                              Eastern Cape in Partnership with AngloGold, Sasol and Imperial

                                                                                                                                                                                                                  32
You can also read