Infra Park Group 2018 Half Year Results - Indigo

Page created by Gabriel Grant
 
CONTINUE READING
Infra Park Group 2018 Half Year Results - Indigo
Infra Park Group

      2018 Half Year Results

September 2018
Infra Park Group 2018 Half Year Results - Indigo
Disclaimer

         The information in this presentation has been included in good faith but is for general informational purposes only. All
         reasonable care has been taken to ensure that the information contained herein is not untrue or misleading. It should not be
         relied on for any specific purpose and no representation or warranty is given as regards its accuracy or completeness.
         This document does not constitute or form part of any offer or invitation to sell or issue, or any solicitation of any offer to
         purchase or subscribe for any securities. The making of this document does not constitute a recommendation regarding any
         securities. Nothing herein may be used as the basis to enter into any contract or agreement.
         This presentation may contain forward-looking objectives and statements about Infra Park’s financial situation, operating
         results, business activities and expansion strategy. These objectives and statements are based on assumptions that are
         dependent upon significant risk and uncertainty factors or may prove to be inexact. The information is valid only at the time of
         writing and Infra Park does not assume any obligation to update or revise the objectives on the basis of new information or
         future or other events, subject to applicable regulations. Additional information on the factors that could have an impact on Infra
         Park’s financial results is contained in the documents filed by the Group with the French securities regulator (AMF) and available
         on the Group’s website at www.infraparkgroup.com.
         Neither Infra Park S.A.S. nor any affiliates nor their or their affiliates’ officers or employees shall be liable for any loss, damage or
         expense arising out of any access to or use of this presentation, including, without limitation, any loss of profit, indirect,
         incidental or consequential loss.
         This distribution is addressed to analysts and to institutional or specialized investors only. No reproduction of any part of the
         presentation may be sold or distributed for commercial gain nor shall it be modified or incorporated in any other work,
         publication or site, whether in hard copy or electronic format.

Page 1                                                                                             2018 Half Year Results - September 2018
Infra Park Group 2018 Half Year Results - Indigo
Reported financial figures

         Global proportionate
         To make its performance easier to understand and to improve its presentation, the Group presents operational figures (revenue,
         EBITDA, operating income) on a “global proportionate” (GP) basis, including the Group’s share of joint ventures (mainly in the USA,
         Colombia, Panama and Smovengo) as if they were consolidated proportionately and not under the equity method applied in
         accordance with IFRSs when preparing the consolidated financial statements.

         Free Cash-Flow
         For the same reason, the Group uses Free Cash-Flow – which is a measure of cash flow from recurring operating activities – as
         a performance indicator. It equals EBITDA less disbursements related to fixed fees as part of concession contracts, the change in
         the working capital requirement and current provisions, maintenance expenditure and any other operating items that have a
         cash impact but that are not included in EBITDA.
         A reconciliation with the figures in the consolidated cash flow statement is presented in Note 8 “Notes to the cash flow
         statement” to the consolidated financial statements for the six months ended 30 June 2018.

         Cash Conversion Ratio
         The Cash Conversion Ratio provides useful information to investors to assess the proportion of EBITDA that is converted to Free
         Cash-Flow and therefore available for development investments, the payment of tax, debt servicing and the payment of
         dividends to shareholders.

         IFRS 15
         The Group adopted IFRS 15 “Revenue from contracts with customers” on 1 January 2018, the date on which the standard came
         into force in the European Union. IFRS 15 is the new IFRS accounting standard governing revenue recognition. It replaces IAS 11
         “Construction Contracts” and IAS 18 “Revenue” and the corresponding interpretations, particularly IFRIC 15 “Agreements for the
         Construction of Real Estate”.
         The Group has decided to apply IFRS 15 according to the “full retrospective” transitional approach. Figures for the first half of
         2017 and for full-year 2017, presented for comparison purposes, have been adjusted and are presented in accordance with IFRS
         15 (see Note 4 to the consolidated financial statements for the six months ended 30 June 2018).

         The total impact of the first-time adoption of IFRS 15 on global proportionate revenue for the first half of 2018 is a net increase of
         €17.3 million, equal to around 3.9% of revenue, and a net increase of €16.5 million for the comparable figure for the first half of
         2017.
         This change of method has no impact on EBITDA or net income, only on the presentation of the income statement.
Page 2                                                                                           2018 Half Year Results - September 2018
Infra Park Group 2018 Half Year Results - Indigo
Contents

         1.   Strategy                                                                   4

         2.   H1 2018 Highlights                                                        15

         3.   Infra Park: an infrastructure asset                                       20

         4.   H1 2018 Financial data                                                    23

         5.   Financial policy                                                          32

         6.   Outlook                                                                   38

         7.   Appendix                                                                  40

Page 3                                              2018 Half Year Results - September 2018
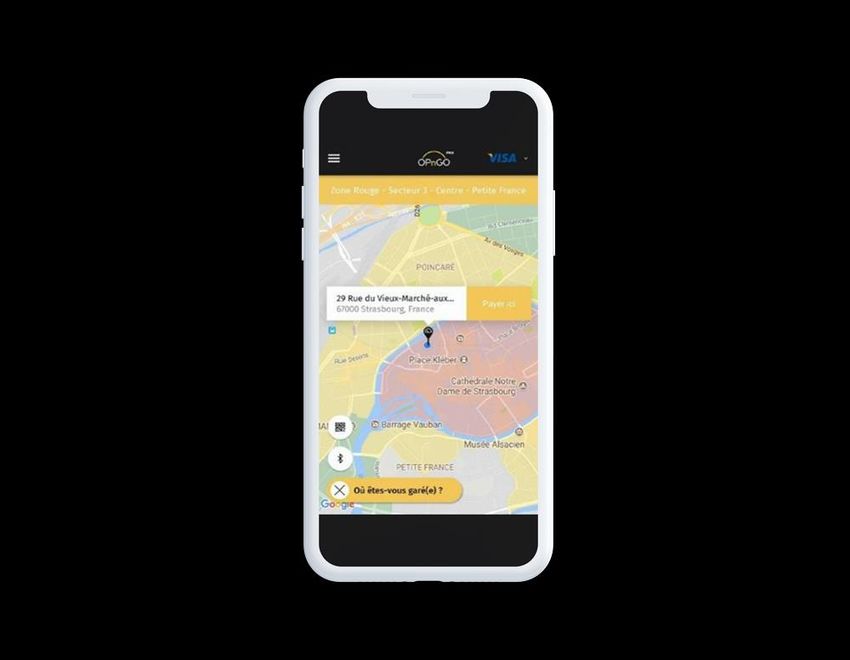
Infra Park Group 2018 Half Year Results - Indigo
1.   Strategy                                                                                                        4

     1.1.   The most efficient individual         5   1.5. …within a changing multimodal ecosystem                  9
            mobility solutions…
                                                      1.6. A strategy focused on parking and mobility               10
     1.2. …delivered to City infrastructures of   6
          tomorrow                                    1.7. A truly global expert in parking with INDIGO             11

     1.3. An attractive market with strong        7   1.8. A new way to pay and park anywhere with                  12
          fundamentals…                                    OPnGO

     1.4. …and mobility needs still to be         8   1.9. A global mobility platform with INDIGO® weel             13
          addressed…
                                                      1.10. A clear strategic roadmap                               14

                                                                          2018 Half Year Results - September 2018
Strategy

         1.1. The most efficient individual mobility solutions…

           PAST MOBILITY CONCERNS

           ▪   Until 1990s: seconds to 100 km/h
           ▪   2000s: liters per 100 km
           ▪   2010s: gCO2 per 100 km
           ▪   2020s: KWh per 100 km

           TODAY’S MOBILITY NEEDS TO BE ADDRESSED

           ▪   Environmental impact
           ▪   Time
           ▪   Convenience
           ▪   Total cost of ownership

           OUR RESPONSE

           ▪   Transforming our parking in mobility
               hubs
           ▪   Developping an open multimodal digital
               platform

Page 5                                                  2018 Half Year Results - September 2018
Strategy

                        1.2. …delivered to City infrastructures of tomorrow

▪     NO ON-STREET
      PARKING

▪     100%
      UNDERGROUND
      PARKING

▪     SELECTIVE
      INFRASTRUCTURE

▪     CONNECTED
      ENVIRONMENT

▪     OPTIMISED FLOWS

    Page 6                                                 2018 Half Year Results - September 2018
Strategy

                             1.3. An attractive market with strong fundamentals…

CITIZENS                                                   MOBILITY
▪ Desire of an increased                                   ▪ Cars: issues solved with
  geographical flexibility                                   technological disruptions
▪ Focus on offers to comply                                  (pollution, costs, congestion,
  with the demand of freedom                                 low usage)

▪ Search for proximity
  services                            INCREASE IN
                                                           ▪ Other individual mobility: a
                                                             complementary solution to               +100m
                                                             customers’ journey                        vehicles / year
                                      €
▪ Alliance of car ownership
  and shared solutions                    GDP per capita   ▪ Collective transportation:
                                                             cost-effective solution but
                                          Worldwide          efficiency to be completed
                                          population
                                                                                                        +3bn
                                          Urban                                                       vehicles by 2050
                                          population

CITIES
▪ Type of cities:
                                                           TECHNOLOGIES
                                                           ▪ Artificial Intelligence &                 + 2bn
   –   Compact                                               blockchain driving                     potential customers
                                                             autonomous mobility                         by 2050
   –   Multicenter
                                                           ▪ Internet of things driving
▪ Level of infrastructure                                    connectivity
▪ Political steering                                       ▪ Multiple interfaces access

                     Car will remain the principal transportation mode
  Page 7                                                                           2018 Half Year Results - September 2018
Strategy

                            1.4. …and mobility needs still to be addressed…

                                                                    Wide choice of       Low cost
                                                      Distance
                                                                   transportation?     opportunities?

                                                                         YES                 YES

                        55%                                        ▪   Walk           ▪ Walk
                                                      0-10 km      ▪   Bike           ▪ Bike
                                                                   ▪   Car
                                                                   ▪   Bus
                                                                   ▪   Subway
                more than 15 kilometers                                                                          Most impacted territories ?
                                                                                Our market: 10-100 km ride
                        92%
                                                                                                                  Rural areas and suburbs
                                                      10-100 km          NO                  NO
                                                                                                                     (traffic congestion)

                                                                         YES                 YES

                                                                   ▪ Planes           ▪ Carpooling
More people commute from their home to their                       ▪ High speed       ▪ Intercity
workplace (+6% since 1999)                                           train              train
                                                     100-1000 km
                                                                   ▪ Intercity
People travel farther (+2 km farther than in 1999)                   train
                                                                   ▪ Highways
80% of commuters use a car to get to work                          ▪ Secondary
                                                                     roads

    Cars will remain the main solution for mobility needs for 10 to 100 km rides around
    large cities
    Page 8                                                                                         2018 Half Year Results - September 2018
Strategy

                           1.5. …within a changing multimodal ecosystem

                                                                                                                    Collective
                                    Individual car                    Shared mobility
                                                                                                                 transportation

Global platform                                                                                                   MaaS1

                Offer

                                                Off-
                                               street                             Bike
                                                                                                                         Massive
                                                                                                                         (Keolis,
                                                                                                                          RATP)
Asset portfolio
                                                                     E-hailing
                                 Adjacent                 On-          (Taxi,               Scooter                        Light
                                 services                Street       Uber…)                                             (Navya)

            Infra Park’s
            assets

                                                                                  Cars
            Infra Park’s
            partnerships

                                                                  % of usage per means of transportation
     Toulouse                                    84%                             4%                                          12%
  (multicentric)
          Paris                                  32%                             6%                                          62%
    (compact)
                           Note:
   Page 9
                           1.    Mobility as a Service
                                                                                                      2018 Half Year Results - September 2018
Strategy

                           1.6. A strategy focused on parking and mobility
                           Serving the metropolitan areas and smart cities of tomorrow
                    Parking Business                                           Mobility & Digital Solutions

                                                                          Large range of digital solutions to offer new ways
A global leadership in off-street parking:                                to pay and park anywhere, more quickly, less
                                                                          expensively and with less effort, on and off-street
▪ Global expertise in the concession-based model
▪ Genuine service hubs for city-dwellers: services for
   vehicles, users and even for the local neighbourhood
▪ Conversion of car parks to smart digital services to facilitate         A new free-floating bike-sharing service: access for
  the customer experience and urban mobility                              city-dwellers to carbon-free vehicles available on-
                                                                          demand through their smartphones to complete
                                                                          their journeys

A growing expertise in on-street parking:
▪ Control, maintenance, collection, consultancy and liaison
                                                                          A daily commuting service provider
  with residents to park anywhere in city centres
▪ Guarantee of fluid and dynamic traffic flows in city centres

A provider of tailored solutions targeting all clients:                   A clean motor vehicle rental operator with
▪ Wide range of services dedicated to clients – Cities,                   Wattmobile’s 100% electric cars and scooters
   Airports, Hospitals, Shopping centres, Railway stations,
   Universities,…
▪ Adjacent services to transform car parks in hub of mobility
  & services (EV charging stations, car wash, car repair…)
▪ Opening car parks to new clients (fleet, bikes, scooters…)              The world’s largest bike-sharing contract in terms
  meanwhile reducing on-street occupation                                 of bikes and stations1.

Our mission: offer the right balance between environmental footprint, convenience
and mobility costs, for citizens and cities
            Note:
Page 10     1.    The Group holds 35% of the share capital of Smovengo.                 2018 Half Year Results - September 2018
Strategy

                          1.7. A truly global expert in parking with INDIGO
                          A 50-year experience and a worldwide presence in all market segments,
                          managing off and on-street parkings, and offering adjacent services
Truly global:                                                                                                 Revenue by market segment         1

▪ In terms of services         City centre                       Multi-storey car park
  provided – off-street                                                                                                       Others
                                                                                                                               23%
  / on-street /
  adjacent services
▪ In terms of market                                                                                              Station
  segments served                                                                                                   4%                                       City centre
▪ In terms of                                                                                                                                 €895.6m            46%
                               University                                  Hospital                           Entertainment
  geographies                                                                                                      4%

                                                                                                                     Hospital
                                                                                                                       6%
                                                                                                                                  Shopping centre
                                                                                                                                       17%
                                 Airport                                    Station                           Revenue by geography        1

                                                                                                                                Other International
                                                                                                                                     Markets
                                                                                                                                        11%

                                                                                                                    North America
                           Shopping centre                             Entertainment
                                                                                                                         & UK
                                                                                                                                              €895.6m
                                                                                                                         30%

                                                                                                                                                         France
                                                                                                                                                          47%
                                                                                                                                    Continental Europe
                                                                                                                                           11%
                          Note:
                          1.    FY 2017 global proportionate figures excluding Mobility & Digital Solutions
   Page 11                                                                                                                      2018 Half Year Results - September 2018
Strategy

                           1.8. A new way to pay and park anywhere with OPnGO
                           A seamless global platform

          Off-street parking                                          On-street parking

                               Geolocation                                                Geolocation
                               Compare parking services by distance                       Geolocalise your vehicle in the pay area
                               and price
                                                                                          Remote management
                               Online-only access
                                                                                          Stop or extend your session via
                               License plate recognition,                                 smartphone
                               Unlocking via smartphone
                                                                                          Fair price
                               Mobile payment                                             Pay only for what you use
                               No need for a ticket
                                                                                          Parking fines management
                               Booking in advance
                                                                                          Information on the amounts and
                               Make your travel safer                                     payments via the app

                               Adjustable rates                                           Suitable for all
                               Benefit from a yield management tool                       Visitors, residents, professionals

Page 12                                                                                     2018 Half Year Results - September 2018
Strategy

              1.9. A global mobility platform with INDIGO® weel
              Leverage car parks to build a global mobility platform

 A versatile battery for        … and a global network             … managed through
  all types of vehicles…        of swapping stations in                a dedicated
                                    all major cities…                platform using
                                                                         artificial
                                                                       intelligence

Page 13                                                        2018 Half Year Results - September 2018
Strategy

                                             1.10. A clear strategic roadmap
                                             Goal 2025: the new strategic plan

1                                             2                               3                                  4                               5
                                                      Focus on clients and
        Strengthen our model                                                                                             Grow our talent and             Make MDS1 a leader in
                                                       markets to grow                Expand our footprint
                                                                                                                            Group culture                 mobility and digital
                                                          organically

    ▪    Maintain operational                     ▪   Keep focusing on new        ▪   Continue to target tuck-       ▪   Improve our Group           ▪   Continue to grow our
         excellence                                   business                        in acquisitions                    practices                       platforms
    ▪    Increase portfolio                       ▪   Digitize our core           ▪   Launch our Asian               ▪   Grow our talent             ▪   Develop synergies
         duration                                     business and                    platform                       ▪   Faster international            between our activities
    ▪    Improve our efficiency                       personalise offers to       ▪   Consider platform                  culture                     ▪   Develop alliances and
                                                      B2C clients                     consolidation                                                      partnerships
    ▪    Focus on countries                                                                                          ▪   Create risk
         where we are a leader                    ▪   Be city centric                                                    management culture
    ▪    Become data driven                       ▪   Develop new uses for
         through BI                                   our infrastructure

        Infra Park implements its new strategic plan Goal 2025 to consolidate its position as a
        global mobility leader for the smart cities of tomorrow

        Note:
        1.    Mobility & Digital Solutions

        Page 14                                                                                                                      2018 Half Year Results - September 2018
2.   H1 2018 Highlights                                                                          15

     2.1. Infra Park key successes in H1 2018                                                   16

     2.2. H1 2018 achievements                                                                  17

     2.3. A strong performance in H1 2018…                                                      18

     2.4. …in selected geographies around the world                                             19

                                                      2018 Half Year Results - September 2018
H1 2018 Highlights

                           2.1. Infra Park key successes in H1 2018
                           Examples of key contracts successfully awarded
                                                                                                                                                                    Belgium – Besix Park:
                                                                                                                                                                    Indigo acquired Besix Park
                                                                                                                                                                    and became #1 player2 in
                 USA – East Michigan                                                                                                                                Belgium
                                                                                                                          France – Lille Plaza: Indigo acquired a   # cities: 35
                 University (EMU): Laz                                                                                    new car park in downtown Lille,
                 Parking won a                                                                                                                                      # spaces: +45,000
  14 countries   management contract
                                                                                                                          strengthening its position in the city    # contracts: 49
                                                                                                                          # spaces: 323
                 to operate the car park                                                                                  # park: 1
                 of Eastern Michigan                                                                                      Contract: Ownership
                 University campus with                                                                                   Duration: Infinite
                 a duration of 17.5 years
                 renewable 1 time
                 # spaces: 9,700                                                  Canada – Oxford
  +20,000        # park: 1                                                        Properties: Indigo
  employees1     Contract: Management                                             signed a partnership
                 Contract                                                         with Oxford Properties,
                 Duration: 17.5 years                                             a key Canadian real-
                                                                                  estate fund, to operate
                                                                                  13 car parks located in
                                                                                  their office buildings
                                                                                  # spaces: 7,200
  +5,600 car                                                                      # parks: 13
                                                                                  Contract: Management
  parks1                                                                          contract                                                                            France – Neuilly avenue de
                                                                                  Duration: 5 years                                                                   Madrid:
                                                                                                                                                                      Opening of a new car park
                                                                                                                                                                      # spaces: 457
                                                                                                                                                                      # park: 1
                                                                                                                                                                      Contract: Concession
  +750 towns1                                                                                                                                                         Duration: 30 years

  +2.3 million                                                                                                                     France – Vélib’23: Indigo
                                                                                                                                   began to operate Paris
  managed parking                                                                          France – INDIGO® weel3:                 bike-sharing fleet in
  spaces1                          Brazil – São Paulo Arena Corinthians:                   Indigo launched its bike-               January 2018
                                                                                           sharing service in 7                    # stations: +800
                                   Indigo won a contract with Sport Club                                                           # bikes: +10,000
                                   Corinthians Paulista to operate the car                 French major cities: Metz,
                                                                                           Tours, Bordeaux, Lyon,                  of which +3,000 e-bikes
                                   park for one of Brazil’s most modern                                                            # rides/day: +30,000
                                   stadium                                                 Toulouse, Angers and
                                   # spaces: 2,800                                         Grenoble
                                   # park: 1                                               # bikes: 8,000
                                   Contract: Management contract                           # app downloads:
                                   Duration: 10 years                                      174,000
                                                                                           # regular users: +80,000
                     Note:
                     1.    Figures based on a 100% share of operations including countries where the Group operates through Joint-Ventures as of 30 June 2018
                     2.    In terms of parking spaces
                     3.    Figures as of 31 August 2018
Page 16                                                                                                                                 2018 Half Year Results - September 2018
H1 2018 Highlights

          2.2. H1 2018 achievements
          Overview of key corporate milestones
                       February 7th                                  April 10th   April 12th                                   July 4th                              September 1st
                          Sale of the                            Standard &       Sale of the car                       Acquisition of                               New partnership
                             Group’s                                  Poor’s      park in Russia                       Besix Park NV                                 with MOBIMO in
                         interests in                         confirmed BBB                                                 (Belgium)                                Switzerland
                               Qatar                             rating with
                                                              stable outlook

                  January           February             March              April               May               June               July             August         September

                                                                    April 12th                   May 4th              June 6th
                                                            Successful pricing                   Make-whole           Announce of a potential
                                                             of a new 10-year                    redemption of        sale of the subsidiaries
                                                                 bond issue of                   the 2020 notes       in UK, Germany, Czech
                                                                       €700m                     of €500m             Republic and Slovakia

                           Geographical refocus: After selling its interests in Qatar in February 2018, then its car park in Russia in April 2018, the
                           Group is considering a potential sale of its subsidiaries in the UK, Germany, Czech Republic and Slovakia. All these
                           countries account for less than 6% of the 2017 EBITDA of the Group.

                           Reinforcement of the Group’s position in Belgium thanks to the acquisition of 100% of the share capital of Besix Park NV,
                           a major player on the Belgian parking market. The transaction enables the Group to become the number 1 player in
                           Belgium1.

                           S&P affirmed the long-term rating of the Infra Park group at BBB while revising the outlook from positive to stable2. This
                           decision highlights the Group’s strong 2017 performance as well as its solid infrastructure business model. S&P confirmed
                           the BBB rating with stable outlook in July 24th as part of its annual review.

                           Successful pricing of a new €700m bond issue with a 10-year maturity (due April 2028). The bond bears a fixed coupon
                           of 1.625% and is rated BBB by Standard & Poor’s. The proceeds of the potential bond offering have been used for general
                           corporate purposes and refinancing of existing indebtedness.

                           Following the settlement of its new 2028 bond issue of €700m, the Group exercised the make-whole call option notice of
                           its 2020 bond of €500m and redeemed 100% of this bond on May 4th

          Note:

          1.      In terms of parking spaces operated (and to get closer to the number 2 player in terms of revenue)
          2.      The outlook change from positive to stable reflects the refinancing operation announced by Infra Park on 4 April 2018 to refinance some existing
                  debt and reimburse a shareholder loan provided by its parent, Infra Foch TopCo, which was treated by S&P as equity.
Page 17                                                                                                                      2018 Half Year Results - September 2018
H1 2018 Highlights

                     2.3. A strong performance in H1 2018…
                                                                                                                                                    H1 2017-18 At constant FX
                                                                                                                                                     variation          rates

                           Stable Group revenue…                                                                 €467.5m                               -0.5%                +4.2%

                           …reflected in Group EBITDA                                                             €156.6m                            +0.6%                   +1.9%
     proportionate
        Global

                           Growing EBITDA margin                                                                           33.5%                   +40bps

                           Average remaining duration1                                                   25.7 years2
                           Financial leverage4                                                                              x5.88                    +0.47x

                           Strong Free Cash-Flow3 generation                                                       €107.1m                             +1.3%                +2.7%
           IFRS

                           Cash Conversion Ratio                                                                          70.4%                    -60bps
                     Notes:
                     1.   Average remaining duration of infra business weighted by the normative cash flow ; i.e. EBITDA – fixed royalties – normative maintenance capex

                     2.
                          (including 99 years duration for ownerships and exercise of options for long-term leases with renewal at INDIGO’s discretion)
                          Calculation as of 31 December 2017
                                                                                                                                                                           +0.0bps
                     3.   Free Cash-Flow = EBITDA - other P&L cash items - change in WC – fixed royalties - maintenance capex
                     4.   Financial leverage: GP net financial debt (€1,828.3m) / GP LTM EBITDA

Page 18                                                                                                                           2018 Half Year Results - September 2018
H1 2018 Highlights

                                   2.4. …in selected geographies around the world

                                   North America                                                                                  Europe                Asia

 Our model: invest
 with partners to test
 new businesses and
 enter new countries

                                                                                             United Kingdom 2

                                                                                             Belgium

                                                                                             Luxembourg

                                                                                             France                                                                                China
                                       Canada
                                                       1                                     Spain
                                       United States

                                                                                                       1
                                                                                             Colombia

Location & expansion                     Costa Rica
     Existing locations                            1                                                                                               Slovakia 2
                                         Panama                                                       Brazil
     Existing platforms                                                                                                                            Czech Republic 2
                                         Ecuador
                                                                                                                                                   Germany 2
     Main prospects
     Main prospect platform                                                                                                                        Switzerland
                                   South America
Business model
     Infrastructure & mixed business
     Non-infrastructure business

Market position
     Top 3 market position         The Group reinforces its position in countries where it could obtain a
                                   leading position while pursuing the refocus of its geographical footprint
                  Note:
                  1.    USA, Colombia, Panama are under joint ventures.
                  2.    Qatar was sold in February 2018 and Russia in April 2018. UK, Germany, Czech Republic and Slovakia are under sale process consideration.

      Page 19                                                                                                                                     2018 Half Year Results - September 2018
3.   Infra Park: an infrastructure asset                                                         20

     3.1. A robust infrastructure model…                                                        21

     3.2. …providing a strong predictable cash flow                                         22

                                                      2018 Half Year Results - September 2018
Infra Park: an infrastructure asset

                                       3.1. A robust infrastructure model…

2017 EBITDA breakdown by contract type                                                                  2017 average remaining duration of infrastructure business1

          12.0% of EBITDA comes
          from short-term contracts,                                                                                                                    24.7                        FY2016
          i.e. short-term leases and
          management
          contracts
                                                               88.0% of EBITDA                                                                           25.7                       FY2017
                                                                         comes
                                                                   from infrastructure
                                                                                                                                   5.2
                                                                       business4
                                                                                                                                   5.5

                                                                                                                                         11.1
                                                                                                                                          11.9

                                                                                                                                                      22.7
                                                                                                                                                       24.0

                                       Long-term lease
                                             5%        Ownership                                                                                                   35.1
                                                         10%
                                                                                                                                                                   34.8

                                                                                                                                                                    35.6
                                               25.7
                                              years1,2                                                                                                              36.0

                                                                                                                                                                                        53.1
                                                                                                                                                                                    51.0
                                            Concession
                                               85%

                   €5.6bn2 of secured normative Free Cash-Flow3 with 25.71 years of average remaining maturity at the end
                   of 2017
                 Notes
                 1. Weighted average residual maturity of infrastructure business based on GP 2017A normative Free Cash-Flow, assuming a 99-year duration for ownerships and exercise
                    of options for long-term leases with renewal at INDIGO’s discretion, excluding car parks under construction but not yet operating
                 2. Excluding car parks under construction but not yet operating
                 3. Normative Free Cash-Flow = EBITDA – fixed royalties – normative maintenance capex
Page 21
                 4. 91% of the 2017 IFRS EBITDA are generated by the infrastructure business
                                                                                                                                                   2018 Half Year Results - September   2018
Infra Park: an infrastructure asset

          3.2. …providing a strong predictable cash flow
          Infrastructure1 run-off portfolio will generate c. €5.6bn of normative cash
          flow
           2017 normative Free Cash-Flow2 run-off3 (global proportionate)

                                                                                                €5,584.7m on portfolio
                                       5,584.7     46.3                                                duration
                                                              44.4
               5,187.0        ​                                           43.3
                                                   160.9
                                                             148.7                   42.2
                                  ​                                                              37.8
                                       1,544.2                           145.0
                                                                                     137.0                  36.1
                                                                                                128.0                   35.9
              1,376.0                                                                                                              35.0
                                                                                                            120.1
                                                                                                                       114.3                   35.0
                                                                                                                                                           32.8        3,921.2
                                                                                                                                   110.6
                                                                                                                                              106.9
                                                                                                                                                          103.3

                                                                                                                                                                       1,155.5

                                                                                   €1,664.5m between 2018 and
                                                                                              2027
                                       4,040.4
               3,811.0

                                                                                                                                                                       2,765.7

            Total 2016                Total 2017   2018       2019       2020        2021       2022        2023       2024        2025       2026        2027     Post 2027
            (reported
            last year)                                                                                        4
                                                                                    France    International
          Notes:
          1.   Infrastructure: ownerships, concessions and long-term leases (including 99 years duration for ownerships and exercise of options for long-term leases
               with renewal at INDIGO’s discretion). Excluding car parks under construction but not yet operating
          2.   Normative Free Cash-Flow = EBITDA – fixed royalties – normative maintenance capex
          3.   Based on FY 2017 normative Free Cash-Flow and considering no change in volume and prices
          4.   International including: Belgium, Brazil, Canada, Colombia, Czech Republic, Germany, Luxembourg, Russia, Slovakia, Spain, Switzerland and the UK
Page 22                                                                                                                 2018 Half Year Results - September 2018
4.   H1 2018 Financial data                                              23

     4.1. Revenue                                                   24

     4.2. EBITDA                                                    26

     4.3. P&L                                                       28

     4.4. Capex                                                     30

     4.5. Cash flow                                                     31

                              2018 Half Year Results - September 2018
H1 2018 Financial data

          4.1. Revenue                                                                                                                                                                1/2
          A strong revenue growth

           Global proportionate – Bridge H1 2017 to H1 2018 (in €m)

                                                                       Global growth rate at current forex -0.5%
                                                                       Global growth rate at constant forex +4.2%

                                                                                                                                         4.6            488.5          (21.0)
                                                                                        7.6            (2.7)
                                                                                                                        (0.8)                             5.6

                                                            9.8           0.2

                                16.5         469.9
                                               1.0                                                                                                                                  467.5
                                                                                                                                                                                      5.6
                                                                                                                                                        482.9

                 453.4                       468.8
                  1.0                                                                                                                                                                461.9

                452.4

                                                                                                                                 1
             H1 2017 Revenue   IFRS 15   H1 2017 Revenue   France       Europe    North America & Iberia & South   Qatar & Russia Mobility & Digital H1 2018 Revenue   Forex    H1 2018 Revenue
                pre IFRS 15                post IFRS 15                                 UK           America                         Solutions 2       post IFRS 15               post IFRS 15
                                                                                                                                                         before FX
                     Parking
                     MDS

          In H1 2018, global proportionate revenue increased by +4.2% at constant forex,
          thanks to:
          ▪ parking activities including the launch of new enforcement activities in France
          ▪ development of parking activities in North America
          ▪ bike-sharing activities
          Note:
          1.    Qatar was sold in February 2018 and Russia in April 2018.
          2.    Of which bike-sharing activities (Velib contract, INDIGO® weel) and OPnGO
Page 24                                                                                                                          2018 Half Year Results - September 2018
H1 2018 Financial data

               4.1. Revenue                                                                                                                                                    2/2
               A balanced portfolio

                 Global proportionate revenue per business unit (in €m)

                                                                                                                467.5
                                                                          448.8

                         Mobility & Digital Solutions                                                                                                   Mobility & Digital Solutions
                                     0%                                                                                                                              1%
                  IBSA                                                                                                                           IBSA
                   14%                                                                                           217.6                            12%
                                                                                         France +4.7%
                                                                           207.8

                                €448.8m                                                  Europe +0.7%                                                            €467.5m
                                                                                                                 30.6
                                                                           30.4

            North                                                                   North America & UK +5.2%
          America & UK
                                                        France             147.4                                 155.0
                                                         46%                                                                              North America                           France
             33%                                                                                                                                                                   47%
                                     Europe                                                                                                    & UK               Europe
                                       7%                                                                                                      33%                  7%

                                                                            62.2          IBSA -5.7%             58.6
                                                                             1.0                                  5.6
                                                                          H1 2017                               H1 2018

                                                                 France   Europe    North America & UK   IBSA     Mobility & Digital Solutions

               At the end of June, France represented 47% of the Group’s total revenue, followed by
               North America & UK (33%). France enjoyed a strong growth for H1 2018 thanks to
               parking and enforcement activities (+4.7%).

Page 25                                                                                                                   2018 Half Year Results - September 2018
H1 2018 Financial data

          4.2. EBITDA                                                                                                                                                  1/2
          A growing EBITDA despite the launch of new activities still in ramp-up

           Global proportionate – Bridge H1 2017 to H1 2018 (in €m)

                                                               Global growth rate at current forex +0.6%
                                                               Global growth rate at constant forex +1.9%

                                 6.5            (0.1)          0.5               (0.4)                               (3.4)
                                                                                                   (0.2)

                                                                                                                                         158.7         (2.0)
                                                                                                                                          (6.2)
                                                                                                                                                                    156.6
                 155.7
                                                                                                                                                                    (6.2)
                  (2.8)

                                                                                                                                         164.9

                 158.6                                                                                                                                             162.9

              H1 2017 EBITDA    France          Europe   North America & UK   Iberia & South   Qatar & Russia   Mobility & Digital   H1 2018 EBITDA    Forex    H1 2018 EBITDA
                                                                                 America                           Solutions            before FX
                 Parking
                 MDS

          In H1 18, global proportionate EBITDA increased by 1.9% at constant forex compared
          to H1 17, despite the costs associated with the launch of new enforcement and bike-
          sharing activities (+5.8% excluding these new activities1).

          Note:
Page 26   1.    Smovengo, Streeteo and INDIGO® weel                                                                          2018 Half Year Results - September 2018
H1 2018 Financial data

                                    4.2. EBITDA                                                                                                                                                    2/2
                                    A continuously growing EBITDA margin

Global proportionate EBITDA per business unit (in €m)
                                                   180.0

                                                                                                                                            156.6
                                                                            160.0                   153.7
        EBITDA margin
          evolution1
             H1 2017    H1 2018
                                                                             140.0
                                                                                                                                                                           Mobility & Digital Solutions
                                                      Mobility & Digital Solutions
                                                                                                                                                                           IBSA        0%
                                                    IBSA          0%
 France      55.2%      55.7%                        10%                                                                                                                    9%
                                                                             120.0
                                    North America                                                                                                          North America
                                        & UK                                                                                                                    & UK
                                         8%                                                                                                  121.2               8%
                                                                            100.0                   114.7           France +5.6%2
 Europe      44.0%      43.1%                                                                                                                                Europe
                                     Europe
                                                                                                                                                               8%
                                       9%                   €153.7m     80.0                                                                                                     €156.6m
                                                          Margin: 34.2%                                                                                                        Margin: 33.5%
 North-
 America &    8.6%       8.7%                                               60.0
 UK
                                                                                                                                                                                                          France
                                                                                                                                                                                                           75%
                                                                            40.0                                    Europe -0.7%
                                                                                                     13.3                                    13.2
                                                                              France
 IBSA        23.6%      25.5%                                                   73%
                                                                                                             North-America & UK +3.7%
                                                                             20.0                   13.0                                     13.5

                                                                                                    15.4
                                                                                                                      IBSA -3.3%
                                                                                                                                             14.9
                                                                                -                   (2.8)
                                                                                                                                            (6.2)
 MDS      -277.5%      -111.0%                                                                     H1 2017                                 H1 2018

                                                                           (20.0)      France   Europe       North America & UK     IBSA   Mobility & Digital Solutions

 Total
                                    The Group EBITDA margin increased by 40 bps (+235 bps excluding new activities3).
 EBITDA
 margin
              33.1%     33.5%       EBITDA margin grew in most of the geographies despite the one-off costs related to
                                    the launch of new enforcement (Streeteo), bike-sharing (Velib) and INDIGO® weel
                                    activities in France in January 2018.
                                  Note:
                                  1.    EBITDA margin at current FX rates
                                  2.    France includes Overheads
       Page 27                    3.    Smovengo, Streeteo and INDIGO® weel .                                                                        2018 Half Year Results - September 2018
H1 2018 Financial data

             4.3. P&L                                                                                                                                                                          1/2
             H1 2018 net income impacted by one-off items
             Revenue GP - IFRS                                                                                        EBITDA GP - IFRS
                                                                                                                                                                                     1
            in €m                                    H1 2017             H1 2018                     Δ             in €m                                   H1 2017      H1 2018                           Δ

            Revenue - GP                               469.9                  467.5            (0.5%)              EBITDA - GP                               155.7         156.6                 0.6%
            USA                                        (93.8)                  (91.3)          (2.6%)              USA                                        (4.9)         (5.0)                0.7%
            Colombia & Panama                            (4.7)                  (4.6)          (0.6%)              Colombia & Panama                          (0.4)         (0.3)             (14.8%)
            Smovengo                                      n.a.                  (4.2)              n.a.            Smovengo                                    n.a.           2.4                  n.a.
            Other                                        (4.2)                  (3.7)          (11.4%)             Other                                       (1.5)         (1.6)                1.7%
            Revenue - IFRS                              367.2                 363.6             (1.0%)             EBITDA - IFRS                             148.9         152.2                 2.2%

             EBITDA to net income (IFRS) – H1 2018 (€m)

                     o.w. PPA amortization €16.0m
                    IFRIC 12 (fixed royalties) €26.6m

                                                                                         The net result is slightly negative in H1 2018 due to the one-
                  152.2             (92.0)                                               off costs related to the refinancing of the 2020 bond for -
                                                                                         €19.6m :
                                                                                         •   exercise of the make-whole call: -€19.8m
                                                                                         •   early termination of a swap: +€2.0m
                                                                                         •   amortized cost on the 2020 bond: -€1.9m

                                                        2.2             0.3             62.6              (19.0)

                                    1                                                                                      (19.6)
                                                                                                                                                                           3
                                                                                                           2                                 (2.5)             21.4      (23.8)

                                                                                                                                                                                           (2.3)

                                                                                                                                                                                                      1
              EBITDA H1 2018   Depreciation and     Net provision    Other items        EBIT           Cost of net      Cost of bond     Other financial       EBT     Income tax        Net income
                   IFRS          amortization     charges and non-                                   financial debt      refinancing   income/expenses                  expenses
                                                       current
                                                    depreciation
          Note:
          1.    Net income attributable to non-controlling interest amounted to -€0.3m for H1 2018. Net income attributable to
Page 28         owners of the parent amounted to -€2.7m                                                                       2018                    Half Year Results - September 2018
H1 2018 Financial data

              4.3. P&L                                                                                                       2/2

          1   PPA impact                                                 2   Cost of net financial debt
              ◼   Purchase Price Allocation impact mainly reflects           ◼   Cost of net financial debt amounted to €38.7m in
                  the recognition of the amortization charge relating            H1 2018 compared to €18.9m in H1 2017
                  to valuation differences allocated to assets fair
                                                                             ◼   Excluding the one-off costs related to the
                  values for long-term contracts and management
                                                                                 refinancing of the 2020 bond (impact of the
                  or service contracts. This valuation was
                                                                                 exercise of the make-whole call for €19.8m, early
                  performed following the acquisition of Indigo Infra
                                                                                 termination of a swap -€2.0m, amortized cost on
                  by Infra Park in June 2014
                                                                                 the 2020 bond for €1.9m) and the impact of IFRIC
              ◼   H1 2018 total PPA amortization amounts to €16.0m               12 for €3.4m, the cost of net financial debt is
                  which includes €11.5m related to the acquisition of            €15.6m for H1 2018 against €15.5m for H1 2017
                  Indigo Infra by Infra Park, €2.0m amortization
                                                                             ◼   The average cost of debt slightly increased from
                  charge on valuation differences resulting from the
                                                                                 2.4% to 2.6% reflecting the extension of the
                  takeover of the Brazilian business in the second
                                                                                 average maturity of the debt
                  quarter of 2016 and €2.5m historical PPA from
                  Indigo Infra

          3   Income tax expenses

              ◼   H1 2018 effective tax rate across Infra Park Group amounted to 112.3% against 45.8% for H1 2017. It includes the
                  adverse impact of the non activated fiscal deficit of Infra Park during the period with regard to expenses related
                  to the exercise of the make-whole call as well as the non activation of fiscal deficit in certain countries where
                  the Group operates, especially Brazil

Page 29                                                                                     2018 Half Year Results - September 2018
H1 2018 Financial data

                           4.4. Capex
                           The Group keeps on investing in infrastructure while optimizing its
                           maintenance capex
                            Capex 2012 – H1 2018 (€m)
The €71.7 m of
development capex
were mainly related to:                                                                                   184
•   the new Toulouse                                                                                                         173
    contract, the
    developments of car                                                                                                       13
    parks in Bordeaux                                                                               145    62
                                                                                                                             26
    and Neuilly, the                                                                                                                                       134.6
    acquisition of a car                                                                            33
    park in Lille
                                                                             105
•   the new owned                                                                                          31                                                  54.4
    property of Jorge                                    84                   21
                                                                                                    28
                                                                                                                                         83.9
    Vigon in Spain
                                       67                                                                                                 11.3                 8.5
•   new projects in                                       22                                                                 123
                                                                                                                                          11.1
    Brazil
                                       22                                                                  75
                                                                              74
                                                          40                                        85                                                                 80.2
The €54.4m of IFRIC 12                                                                                                                              72.6       71.7
                                                                                                                                         60.6
capex were mainly                      43
related to two new                                         21
                                                                              10                           16                 11         0.9                   (0.1)
concessions in France                   2                                                           (1)
                                      2012               2013                2014               2015      2016              2017        H1 2017            H1 2018
                                                                                                                                    1
                                               Financial capex                     Development capex            Maintenance capex            Fixed royalties

                           Cumulated capex amounted to €80.2m in H1 2018 excluding IFRIC 12 impacts. It
                           reached €134.6m after taking into account the effect relating to the accounting
                           treatment of fixed fees (IFRIC 12) which represented net capex of €54.4m.
                           Note:
                           1.    Including car park maintenance capex and other maintenance capex
    Page 30                                                                                                                2018 Half Year Results - September 2018
H1 2018 Financial data

          4.5. Cash flow
          Strong cash flow generation in H1 2018 resulting in a cash conversion
          ratio of 70.4%
           Infra Park cash flow bridge (IFRS) – H1 2018 (€m)
                                                                                                                                                                      Of which :
                                                                                                                                                                      +€688.2m : Net proceeds from the
                                                                                                                                                                      €700m 2028 bond
                                                                                                                                                                      -€500.0m : 2020 bond repayment
                                                                                                                                                                      -€19.8m : impact of the exercise of the
                                                                                                                                                                      make-whole call on the 2020 bond
                   Working capital
                                                                                                                                                                      -€100.0m : repayment of a shareholder
                   surplus of €148.3m
                                                                                                                                                                      loan to Infra Foch Topco following the
                                                                                                                                                                      issue of the 2028 bond

               152.2        (10.5)                                                                                                                 Infra Park 2017
                                          (28.3)
                                                                                                                                                   dividend of €80.0m
                                                         (6.2)        107.1                                                                        paid in April 2018
                                                                                     (24.5)
                                                                                                    (17.2)
                                                                                                                    2.3           0.7          68.4          (80.6)

                                                                                                                                                                                                      (28.6)
                                                                                                                                                                            (96.8)
                                                                                                                                                                                         80.4
                              Cash Conversion Ratio:
                                     70.4%

               EBITDA   Change in WCR Fixed royalties  Car park     Free Cash-   Interests paid   Taxes paid     Dividends   Other financial Free Cash- Dividends paid Development         Net    Change in net
                                                                                                                                                                                                3
                         and current                  maintenance      Flow                                    received from   elements 1     Flow before              and financial   borrowings cash position
                          provision                      capex                                                       JV                     dividends, dev                capex 2
                                                                                                                                             and fin capex
                                                                                                                                             and financing

          The Group benefits from a strong Cash Conversion Ratio of 70.4% for
          H1 2018.

          Note:
          1. Other financial elements include changes in other financial assets and liabilities
          2. Including Smovengo financing for €23.0m and other maintenance capex non relating to car parks
          3. Including impact of exchange rate movements for €0.5m

Page 31                                                                                                                                       2018 Half Year Results - September 2018
5.   Financial policy                                                                                  32

     5.1. Infra Park consolidated balance sheet                                                    33

     5.2. Current financial structure                                                              34

     5.3. 2018 refinancing deal summary                                                            35

     5.4. An enhanced financial strike force                                                       36

     5.5. “Europe's leading company in its sector” - VIGEO                                         37

                                                             2018 Half Year Results - September 2018
Financial policy

          5.1. Infra Park consolidated balance sheet
          As of 30 June 2018

            Assets                                                                     €m     Liabilities                                                           €m
            Concession intangible assets                                          1,094.4     Share capital                                                       160.0
            Goodwill                                                                790.8     Share premium                                                       338.0
            Property, plant and equipment                                           484.4     Other                                                                 41.5
            Concession tangible assets                                              168.8     Consolidated shareholder's equity                                   539.6
            Investments in companies EM                                              116.3
            Others assets                                                             122.1   Minority interests                                                   10.6
            Non-current derivatives                                                      -    Total equity incl. minority interests                               550.2
            Total non-current assets                                              2,777.0
                                                                                              Provisions                                                           72.0
                                                                                              Financial debt excl. IFRIC 121                                     1,613.5
                                                                                              IFRIC 12 impact on debt                                             353.4

            Current derivatives                                                       0.4     Current derivatives                                                    0.1
            Current assets                                                          274.4     Current liabilities                                                 460.3
            Cash management financial assets and cash 2                             147.0     Deferred tax                                                         149.3

            Total                                                                 3,198.7     Total                                                              3,198.7

          As of 30 June 2018, Infra Park Group has a strong financial structure with
          a gearing3 of 2.7x vs. 2.3x as of June 2017.

          Notes:
          1. Financial debt includes overdrafts
          2. Of which €2.2m “cash management financial assets other than cash equivalent” refer to the Note 8.9 of H1 2018 Infra Park Consolidated Accounts
          3. Gearing = Net financial debt pre IFRIC 12 / Consolidated shareholder’s equity

Page 33                                                                                                               2018 Half Year Results - September 2018
Financial policy

          5.2. Current financial structure
          Infra Park financial structure
           Financial structure – As of 30 June 2018                                                          Infra Park Group’s net financial debt
                                                                                                            In € millions                                    31/12/2017 30/06/2018           ∆
                                                      Crédit Agricole                                       Bonds                                               1,377.9      1,565.3    187.4
                Ardian                                                                      Management
                                                       Assurances                                                                                                 (0.6)       (0.6)         -
                                                                                                            Revolving credit facility
                                                                                                            Other external debts                                  23.5         35.0       11.5
                                      Convertible                                                           Shareholder loan                                     104.2            -    (104.2)
                                        bonds:                                                              Accrued interests                                      13.7        12.0       (1.7)
                          49.2%         €347m3
                                                               49.2%                                 1.6%
                                                                                                            Long-term financial debt excl. fixed royalties        1,519       1,612        93

                                                        Infra Foch                                          Financial debt related to fixed royalties            323.7        353.4      29.6

                                                                                                                                                                                                    IFRS
            Syndicated RCF1: €300M                     Topco S.A.S.
                           +                                                                                Total long-term financial debt                       1,842        1,965       123
                        Bonds:                                  100%
              •Apr.   2025 - €650m
                                                                                                            Net cash                                            (174.2)      (145.4)    28.8
              •Apr.   2028 - €700m2
                                                                                                            Hedging instruments FV                                (2.6)       (0.4)        2.3
                               +
                                                        Infra Park
                 Private placements                                                           FCPE
                                                           S.A.S.                                           Net financial debt                                   1,666        1,819       154
              •Jul.   2029 - €100m
              •Jul.   2037 - €125m
                                                                                                  0.2%      LTM EBITDA                                           296.2       299.6        3.3
                                   100%                                           99.8%                     Net financial leverage                               5.62x       6.07x     0.45x

                                                                                                                                                                                                  proportionate
                                     Infra Park
                                                                        Indigo Infra S.A.
                                    Digital S.A.S.

                                                                                                                                                                                                     Global
                                                                                                            Net financial debt                                   1,678       1,828     150.0
                         100%                         100%                                                  LTM EBITDA                                           310.0        311.0      0.9
                                                                                                            Net financial leverage                               5.41x       5.88x     0.47x
                                                                                                  Other
                  INDIGO® weel                       OPnGO               Subsidiaries             debts:
                                                                                                  c.€23m

          Infra Park Group financial leverage slightly increased to c. 5.88x (global
          proportionate) following the refinancing of the 2020 bond and taking into
          account the investment in new activities in H1 2018
          Notes:
          1.   Unused as of 30/06/2018. Initial maturity extended to Oct 2023.
          2.   New bond issued by Infra Park in April 2018
          3.   Further to the bond refinancing Infra Park reimbursed in May 2018 a €100m shareholder loan to Infra Foch Topco (IFT). IFT then reimbursed €100m of convertible
               bond to its shareholders out of the initial amount of €447m
Page 34                                                                                                                                 2018 Half Year Results - September 2018
Financial policy

          5.3. 2018 refinancing deal summary
          €700m 10-year 1.625% Senior Unsecured Notes

          Key terms – April 2018 – €700m                              Deal summary
          Issuer                                   Infra Park         •   On 12 April 2018, following a successful 3-day pan-
          Rating                              BBB - Stable (S&P)          european roadshow with over 50 investors met in
          Instrument                          Senior, Unsecured           Paris, Munich, Frankfurt and London, Infra Park
          Tenor                                     10 years              issued €700m of new 10-year notes at a coupon of
          Pricing Date                            12 April 2018           1.625%
          Settlement                              19 April 2018       •   Infra Park then exercised the make-whole call on
          Maturity                               19 April 2028            100% of its 2020 notes of €500m and reimbursed
          Amount                                 €700 million             the shareholder loan of €100m granted by its
          R/O Spread                               MS+83bps               parent Infra Foch Topco in order to optimize its
          R/O Price                                 98.546%               financial costs
          R/O Yield                                  1.785%
          Coupon                                     1.625%           •   After weeks of lower supply and higher volatility,
          NWM Role                         Joint Active Bookrunner        Infra Park took advantage of a better market
                                                                          backdrop to launch a new EUR 10-year benchmark
                                                                      •   Initial pricing was set at MS+100bps. The orderbook
                                                                          grew steadily allowing to announce to set final
          Investor allocation
                                                                          terms at MS+83bps
                                                                      •   This re-offer spread represents a new issue
          By type                         By geography
                                                                          premium of 8bps, one of the lowest levels seen in
                                                                          weeks
                         1%                          1%               •   Final book was 2x oversubscribed with a total of
                    9%                            10%
                                                           33%            c.€1.4bn of orders at final spread. The book was
                12%
                                               26%                        geographically well diversified.

                              78%                                     •   This transaction marks Infra Park’s return to the
                                                      30%                 EUR bond public market after the last public
                                                  France
                                                                          transaction in 2015
                  Asset Managers
                                                  UK & Ireland
                  Insurers                        Germany & Austria
                  Official Institutions           BeNeLux
                  Banks                           Others

Page 35                                                                               2018 Half Year Results - September 2018
Financial policy

                       5.4. An enhanced financial strike force
                        1 ◼ No refinancing need before 2025 (in €m)
                             Debt maturity profile as of 30 June 2018 and available RCF (unused to date)
                                                                                                                        700
                                                                                              650

A cash position
of c. €145m as of
30 June 2018

A €300m RCF
fully unused to
                                                                                                                                                                                                      125
date, initially                                                                                                                      100

maturing in 2021
and extended to                       2018   2019    2020    2021       2022   2023    2024   2025
                                                                                                         -
                                                                                                       2026      2027   2028      2029     2030     2031    2032    2033      2034   2035      2036   2037
Oct 2023.
                                                            Bond 2028            Bond 2025           Bond 2029          Bond 2037             Other debts          Available RCF

A demonstrated          2 ◼ Maintain BBB rating                                                                         3       Optimize financing costs
access to the
bond markets,            ◼    In April 2018, S&P confirmed the Infra Park group                                             ◼    An optimized net debt cost (incl. shareholder loan):
with a confirmed              credit rating of BBB and revised the outlook from                                                 3.9%
BBB rating                    positive to stable                                                                                                  2.9%
                                                                                                                                                                   2.6%              2.4%              2.6%
                         ◼    To maintain this credit rating Infra Park :
                              ✓ Targets adjusted FFO/Debt ratio to remain
                                 comfortably above 10% at all times
                              ✓ Calibrates dividend policy to commensurate                                                                                                                                      1
                                                                                                                                FY 2014           FY 2015          FY 2016           FY 2017          H1 2018
                                 with target credit ratios (€80m dividend paid in
                                 2018 as forecasted)                                                                        ◼    Limit Infra Park exposure to interest rates
                              ✓ Ensures that the share of infrastructure                                                         ✓     Maintain at least 60% of fixed or capped rate
                                 businesses will continue representing the great                                                       debt
                                 majority of EBITDA (>70% of IFRS EBITDA)
                              ✓ Maintains at least an “adequate” liquidity level                                                 ✓     As of 30 June 2018, c.97% of Group’s debts bear
                                 (current liquidity level is strong)                                                                   fixed rate
                         ◼    Infra Park Group will be maintained as the main
                              Group funding vehicle to limit structural
                    Notes:
                              subordination in line with S&P’s guidelines
Page 36             1.   H1 2018 restated from one-off costs related to the refinancing of the 2020 bond (impact of the exercise of the             2018 Half Year Results - September 2018
                         make-whole call for €19.8m, early termination of a swap -€2m, amortized cost on the 2020 bond for €1.9m)
Financial policy

                                   5.5. “Europe's leading company in its sector” - VIGEO
                                   VIGEO rating agency awarded Infra Park a 61/100 rating as part of the extra-
                                   financial rating process on March 13th 2018
Benchmark sector:                                                            6 domains of performance (out of 100)
Business Support Services Europe                                                                                                                                                              Ratings1
                                                                                                                                                                    51
                                                                                                Governance                                                         63                            +
                                                                                                                                                           35.6

                    61
                                                                                     Business Behaviour                                                                  68                     ++
                                                                                                                                                29.6
                                                                              Community Involvement                                            35                                                =

                     100                                                                                                                                   35.3
                                                                                             Human Rights                                                         59                            ++
                                                                                                                                                    28.7
                                                                                     Human Ressources                                                             62                            ++
Information Rate                                  93%
                                                                                                                                                           37.5
Company Cooperation Level                 Proactive                                            Environment                                                     59                                +
Ranking in Sector (Europe)                        1/54                                                                                                             Sector average performance (Europe)
                                                                                                                              Infra Park Performance
Ranking in Universe                         55/4,159
                                   Extract from VIGEO synthesis

   Responsiveness                    “The Company has shown interest in its Company's CSR performance based on Vigeo Eiris' rating and has been cooperative by
                                     providing enough details and documents related to its ESG strategy. This has positively impacted its performance.”

  Relations with employees'          “The Company has a detailed commitment to freedom of association and the right to collective bargaining. Infra Park has shown
  representatives                    the importance of negotiation and the inclusion of employees' representatives in its decisions' making.”

                                     “The Company has extensively addressed its environmental strategy and has formalised its commitments to decrease its impact
   Environmental strategy
                                     on the environment and has adopted different strategies to decrease its energy consumption and impacts from transport.”

                                     “The Company shows an advanced performance in its governance pillar. Infra Park respects the number of non-executives and
   Governance and CSR                independent members within the Board and CSR issues are included in many aspects of the Company's governance, as they are
                                     discussed at Board level and taken into account while setting executives' remuneration.”
                   Note:
     Page 37       1.    Ratings outline companies’ benchmarked domain performance within a sector, on a 5-level scale: “--”, “-”, “=”, “+”, “++”     2018 Half Year Results - September 2018
6.   Outlook                                                  38

     6.1. Outlook                                         39

                    2018 Half Year Results - September 2018
Outlook

          6.1. Outlook
          Main strategic axes of the Goal 2025 plan

            At constant scope, business levels are expected to continue rising in full-year 2018. That growth will be driven by
            the Group’s new strategic plan called Goal 2025, accompanied by its new organization, as the previous Goal 2020
            plan was completed two years ahead of schedule. The main strategic axes of this Goal 2025 plan are:

           Strengthen our model based on facilities operated under concession and owned outright through organic growth in
           key countries, in order to ensure recurring cash flow over the long term,

           Step up acquisitions in “major countries” to allow us to maintain or gain a position as leader or co-leader, while
           adjusting the scope of operations at the margins as the case may be

           Use our expertise in international markets, supported by our three existing platforms (Europe, North America and
           South America), to move into the Asian market

            Continue our policy of customer-focused innovation and quality

            Become a leading player in digital and individual mobility services, based on our two main entities of OPnGO and
            INDIGO® weel

            In addition, we will continue to invest in our car parks to prepare them for the arrival of electric, smart and self-
            driving cars, which is likely to cause a major and positive shift in our business model.

            Finally, in geographical terms, Asia and particularly China remain strategically important markets that we aim to
            conquer.

Page 39                                                                                  2018 Half Year Results - September 2018
7.   Appendix                                                                           40

     7.1. Financial performance by country                                             41

                                             2018 Half Year Results - September 2018
Appendix

          7.1. Financial performance by country
          H1 2018 – Global proportionate

                                                       H1 2018 Global Proportionate
          in €m                            Revenue        % Revenue          EBITDA     % EBITDA
          France                              217.6           46.6%-           121.2       74.4%-
          Germany                               4.7             1.0%            0.6         0.4%
          Belgium                              14.2            3.0%              7.3        4.5%
          Luxembourg                            5.9             1.3%              1.5       0.9%
          Czech Republic                         1.1           0.2%             0.4         0.2%
          Slovakia                              1.0            0.2%             0.6         0.4%
          Switzerland                           3.7            0.8%              2.9         1.7%
          Europe                              30.6             6.6%-            13.2        8.1%-
          United Kingdom                      26.8             5.7%             6.6         4.0%
          Canada                              36.8             7.9%             2.9          1.8%
          USA                                  91.3           19.5%             4.0         2.5%
          North America & United Kingdom     155.0            33.2%-           13.5         8.3%-
          Brazil                              32.6             7.0%               5.1       3.2%
          Spain                                21.4            4.6%              9.7        5.9%
          Colombia                              4.1            0.9%              0.4        0.2%
          Panama                               0.6             0.1%             (0.1)        n.a.
          Qatar                                  -                -                -            -
          Russia                               0.0            0.0%             (0.2)         n.a.
          IBSA                                58.6            12.5%             14.9        9.2%
          Total Indigo Group                 461.9            98.8%           162.9       100.0%
          Mobility & Digital Solutions         5.6              1.2%           (6.2)          n.a.
          Total Infra Foch Topco             467.5           100.0%           156.6       100.0%

Page 41                                                    2018 Half Year Results - September 2018
You can also read