Global Property CEO Conference - Citi 2020 MARCH 2020 - MAA

Page created by Annette Mcgee
 
CONTINUE READING
Global Property CEO Conference - Citi 2020 MARCH 2020 - MAA
Citi 2020
Global Property CEO Conference
          MARCH 2020
Global Property CEO Conference - Citi 2020 MARCH 2020 - MAA
FORWARD-LOOKING STATEMENTS

This presentation contains forward-looking statements within the meaning of Section 27A of the Securities Act of 1933, as amended, and Section 21E of the
Securities Exchange Act of 1934, as amended. These forward-looking statements, which are based on current expectations, estimates and projections about the
industry and markets in which MAA operates and beliefs of and assumptions made by MAA management, involve known and unknown risks, uncertainties and other
factors that could significantly affect the financial results of MAA. Words such as “expects,” “anticipates,” “intends,” “plans,” “believes,” “seeks,” “estimates,” and
variations of such words and similar expressions are intended to identify such forward-looking statements, which are not historical in nature. In this presentation,
forward-looking statements include, but are not limited to, any statements about forecasted operating results, anticipated revenue and expense growth, expected
acquisition and disposition activity, the outlook for multifamily supply, the outlook for job growth, anticipated capital raising and financing activities, anticipated
occupancy rates, anticipated lease pricing and rent growth, expected timing and financial impact of capital initiatives, estimated development funding, the anticipated
timing of completion of current development projects and the stabilization of such projects, MAA’s future development projects, the anticipated stabilization of
communities in lease-up, the anticipated scope of MAA’s future redevelopment activities and projected redevelopment costs, incremental rent growth and incremental
revenue, anticipated dividends, interest rate and other economic expectations, and other information that is not historical. All statements that address operating
performance, events or developments that MAA anticipates or expects will occur in the future are forward-looking statements. These statements are not guarantees of
future performance and involve certain risks, uncertainties and assumptions that are difficult to predict. Although MAA believes the expectations reflected in any
forward-looking statements are based on reasonable assumptions, MAA can give no assurance that its expectations will be achieved, and therefore actual outcomes
and results may differ materially from what is expressed, implied or forecasted in such forward-looking statements. Some of the factors that may affect outcomes and
results include, but are not limited to: inability to generate sufficient cash flows due to market conditions, changes in supply and/or demand, competition, uninsured
losses, changes in tax and housing laws, or other factors; exposure as a multifamily-focused REIT to risks inherent in investments in a single industry and sector;
adverse changes in real estate markets; failure of new acquisitions to achieve anticipated results or be efficiently integrated; failure of development communities to be
completed, if at all, within budget and on a timely basis or to lease-up as anticipated; unexpected capital needs; changes in operating costs, including real estate
taxes, utilities and insurance costs; losses from catastrophes in excess of our insurance coverage; level and volatility of interest or capitalization rates or capital
market conditions; the effect of any rating agency actions; inability to attract and retain qualified personnel; cyberliability or potential liability for breaches of our
privacy or information security systems; adverse legislative or regulatory tax changes; adverse legal proceedings; compliance costs associated with laws requiring
access for disabled persons; and those additional risks and factors discussed in reports filed with the Securities and Exchange Commission by MAA from time to time,
including those discussed under the heading “Risk Factors” in MAA’s most recently filed Annual Report on Form 10-K. MAA undertakes no duty to update any forward-
looking statements appearing in this presentation.

REGULATION G

This presentation contains certain non-GAAP financial measures within the meaning of the Securities Exchange Act of 1934, as amended. MAA’s definitions of these
non-GAAP financial measures, among other terms, and reconciliations to the most directly comparable GAAP measures, can be found in the accompanying Appendix
and under the “Filings & Financials – Quarterly Results” navigation tab on the “For Investors” page of MAA’s website at www.maac.com.

                                                                                                                                                                             2
Global Property CEO Conference - Citi 2020 MARCH 2020 - MAA
Strong. Building Momentum. Ready.

   Transformative transactions over the last six years have
  enhanced our portfolio, our execution capabilities and our
capacity to support new growth. We look forward to capturing
               the opportunities that lie ahead.

                                                               3
Global Property CEO Conference - Citi 2020 MARCH 2020 - MAA
A Strategy Focused On Creating Value Through The Full Market Cycle

                      •   MAA has a differentiated approach, focused on the high growth Sun Belt region
                      •   Portfolio is diversified among markets, submarkets, asset styles, and price points
                      •   Portfolio size and market concentration create efficiencies and economies of scale
1        Strong       •   Technology initiatives further strengthen platform and opportunities
                      •   Strong balance sheet provides safety while creating flexibility and opportunity

                      • Strong 2019 rent growth trends carry momentum into 2020
                      • High yielding interior kitchen and bath redevelopment program continues throughout the
        Building
2      Momentum
                        portfolio
                      • Expanded exterior amenity redevelopment program underway at select properties
                      • Expanded new development pipeline creating additional value

                      • Proven track record of creating steady internal growth, while also absorbing and extracting
                        value from significant external growth
3        Ready        • Balance sheet capacity creates growth opportunities
                      • Experienced, tenured management team
                      • Strong culture with focus on delivering long-term value for all stakeholders

                                                                                                                      4
Global Property CEO Conference - Citi 2020 MARCH 2020 - MAA
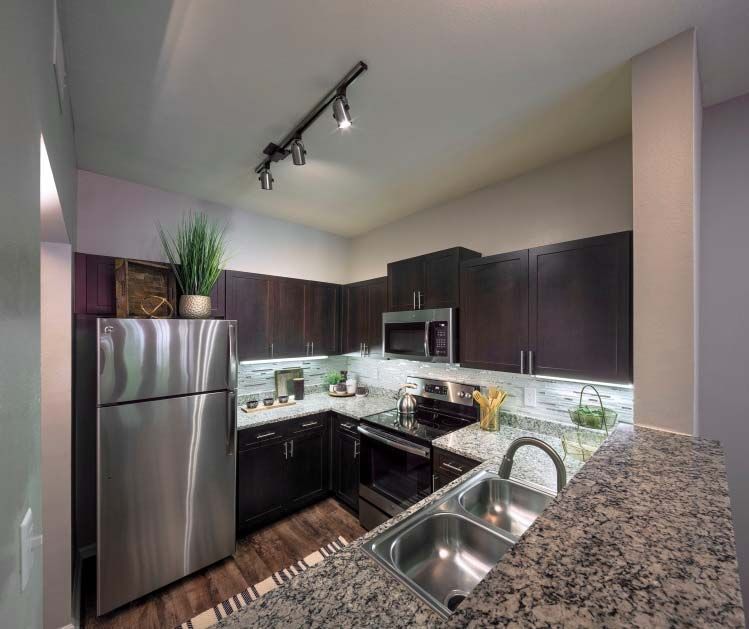
A Differentiated Approach, Focus on High Growth Sunbelt Region                                                                                                                   1
     Differentiated Approach Within the                                                                                    Top 10 US Markets for Net Migration
                                                                                                                                                 2010 – 2018
              Apartment Sector
                                                                                                                          RANK             MARKET               NET MIGRATION2
                                                                                                                                                                       (000’s)
 % PUBLIC APARTMENT REIT                     SECTOR            68%
SECTOR NOI FROM 10 LARGE                                                                                                      1        Dallas-Ft Worth                  412
    COASTAL MARKETS1                           MAA              4%                                                            2            Phoenix                      327
                                                                                      Over an eight year
                                                                                                                              3           Houston                       262
                                                                                      period (from 2010
                                                                                                                              4             Austin                      252
% PUBLIC APARTMENT REIT                      SECTOR            38%                     to 2018) almost
                                                                                                                              5            Tampa                        242
    SECTOR NOI FROM                                                                        60% of all
                                                                                                                              6            Atlanta                      214
      CALIFORNIA1                              MAA              0%                     domestic moves
                                                                                                                              7           Charlotte                     204
                                                                                            were to                           8         San Antonio                     192
                                                                                        MAA Markets.                          9            Denver                       183
                                                                                                                             10            Orlando                      173
          Seattle

                                                                                                                                                              Boston

                                                                                                                                                          New York

                                                                                                                                                 DC Metro
      San Francisco
  Oakland-East Bay
           San Jose

                   Los Angeles
               Orange County                                                                                                                     Public Apartment REIT
                    Inland Empire                                                                                                                Market Concentration
                         San Diego
                                                                                                                                                   TOP 10 MARKETS BY %NOI1
                                                                                                                                                  OTHER CALIFORNIA MARKETS1
                                                                                                                                                  MAA MARKETS

            1 Green   Street Advisors, U.S. Apartment Outlook, January 17, 2020                                                                                                      5
            2 US   Census Bureau, Cumulative Estimates of the Components of Population Change, April 1, 2010 to July 1, 2018 - Net Migration - Domestic
Global Property CEO Conference - Citi 2020 MARCH 2020 - MAA
Diversified Portfolio in High-Growth Region                                                           1

 TOP 10 MARKETS BY % SAME STORE NOI FOR 4Q 2019

  11                                              2                          3

                                                  ATLANTA                    CHARLOTTE
                                                  10,664 Units | 12.3% NOI   6,149 Units | 7.0% NOI

                                                  4                          5

                                                  TAMPA                      WASHINGTON D.C.
                                                  5,220 Units | 6.7% NOI     4,080 Units | 6.6% NOI
  DALLAS-FORT WORTH
  13,653 Units | 13.2% NOI

                                                                                                          6
Global Property CEO Conference - Citi 2020 MARCH 2020 - MAA
Diversified Portfolio in High-Growth Region                                                         1

 TOP 10 MARKETS BY % SAME STORE NOI FOR 4Q 2019

  6                                               7                        8

                                                  AUSTIN                   RALEIGH/DURHAM
                                                  6,475 Units | 6.1% NOI   4,397 Units | 4.6% NOI

                                                  9                        10

                                                  NASHVILLE                HOUSTON
                                                  4,055 Units | 4.5% NOI   4,867 Units | 4.4% NOI
  ORLANDO
  5,274 Units | 6.4% NOI

                                                                                                        7
Global Property CEO Conference - Citi 2020 MARCH 2020 - MAA
Market Diversification and Submarket Balance across the High Growth Sunbelt Region                                                                                                              1

TOP 20 MARKETS              % 4Q 2019 SS NOI
Atlanta, GA                          12.3%
Dallas, TX                            9.1%
Charlotte, NC                         7.0%
Tampa, FL                             6.7%
Washington, DC                        6.6%
Orlando, FL                           6.4%
Austin, TX                            6.1%
Raleigh/Durham, NC                    4.6%
Nashville, TN                         4.5%
Houston, TX                           4.4%
                                                                  Multifamily Markets
Fort Worth, TX                        4.1%
                                                                  Regional Office
Jacksonville, FL                      3.4%
Phoenix, AZ                           3.2%                        Corporate Headquarters

Charleston, SC                        2.7%
Richmond, VA                          2.2%
                                                                    DIVERSIFIED WITHIN SUBMARKETS1                                  DIVERSIFIED IN PRICE POINTS1,2
Savannah, GA                          2.0%
Greenville, SC                        1.7%                                                      22%
Memphis, TN                           1.4%
Birmingham, AL                        1.4%                                                                                                   54%
                                                                              49%                                                                                   46%
San Antonio, TX                       1.3%                                                           17%

Total                                91.1%                                                   12%

                                                                Inner Loop    Suburban     Satellite City   Downtown/CBD                         A to A+         B to B+

              Source: Company and Company 4Q 2019 Earnings Release Supplemental                       2 Average  effective rent/unit for 4Q 2019 of higher than $1,300 for A to A+ and $1,300
              1 Based on gross asset value at 12/31/2019 for total multifamily portfolio              or lower for B to B+ for total multifamily portfolio                                          8
Global Property CEO Conference - Citi 2020 MARCH 2020 - MAA
High Growth Region Favors Continued Strong Demand                                                                                                                 1
                                MAA’S TOP MARKETS CONSISTENTLY RANK AMONG HIGHEST IN THE COUNTRY
                                       FOR JOBS, MIGRATION, LIVEABILITY AND POPULATION GROWTH

   Dallas/                                                              Washington
                                             Atlanta                                                      Charlotte                       Tampa
  Fort Worth                                                               DC
   #1 Best Big City for Jobs                 Top 10 Market              Top 10 Strongest Economy           #4 Fastest Growing         #3 City with Most Jobs in
                                          Highest Net Migration                 in the US                     Large US City                     2019
                                             ~US Census Bureau,
           ~Forbes, 2017                                                   ~Business Insider, 2018           ~Wallet Hub, 2018             ~Manpower Group
                                                2010-2018

                                                                                                                                        Raleigh/
        Orlando                               Austin                       Houston                        Nashville
                                                                                                                                        Durham
  #1 Job Growth Rate in US                #1 Best Places to Live        #1 Top Metro for Economic        #3 Best Big City for Jobs   #2 Best Place for Business
         (Large City)                                                        Growth Potential                                              and Careers
        ~US Bureau of Labor
                                       ~US News & World Report, 2018      ~Business Facilities, 2018             ~Forbes, 2017              ~Forbes, 2018
        Statistics, 2017-2018

ANNUAL EMPLOYMENT GROWTH
                                                                                                             •      Superior JOB GROWTH VS. NATIONAL
 3.0%                                                                                                               AVERAGES
 2.5%                                                                                             2.3%
 2.0%                                                                                         1.7%
                                                                                                             •      Favorable MIGRATION TRENDS and
                                                                                                                    HOUSEHOLD FORMATIONS
 1.5%
 1.0%                                                                                                        •      FAVORABLE TAX ENVIRONMENT
 0.5%
                                                                                                                    attracts employers and drives job
                                                                                                                    growth
 0.0%
            2013        2014         2015         2016       2017       2018       2019       Average
                                                                                                             •      BUSINESS-FRIENDLY infrastructure
                                                  U.S     MAA Markets                                               attracts employers
                                                                                                                                                                      9
          Source: US Bureau of Labor Statistics
Global Property CEO Conference - Citi 2020 MARCH 2020 - MAA
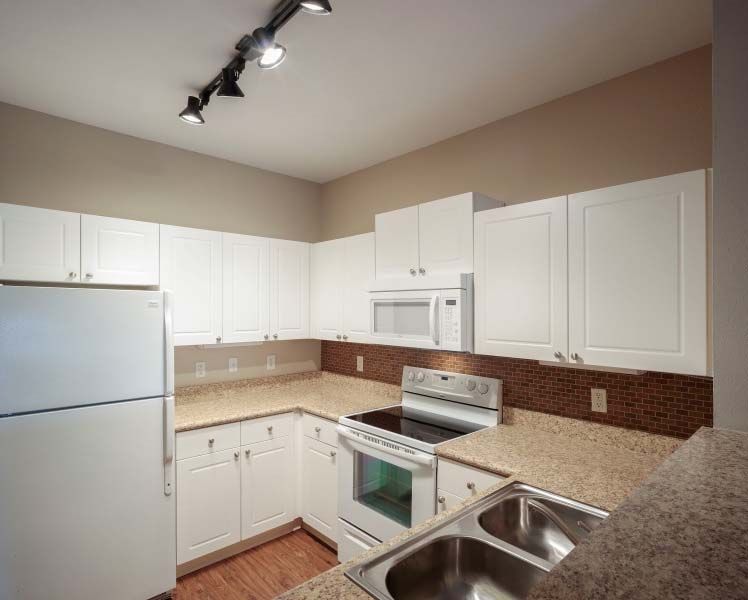
Operational Strength and Efficiencies Drive Value                                                                                                                 1

                MAA’S ESTABLISHED EXPENSE MANAGEMENT PRACTICE STANDS OUT AMONG PEERS

     Since 2013, the average annual property expense growth for MAA is 2.5% vs the sector
                                      average1 of 3.0%

 VALUE CREATION FROM PROPERTY                                                                                     1.     Unique shop stocking program that
 OPERATING EXPENSE SAVINGS                                                                                               drives down maintenance and turn
 Reported Same Store
                                                                                                                         costs

                       Annual value creation                                                                      2.     Proactive utility monitoring and
 $160,000              (in $000s) created by                                                                             management program
                        MAA’s lower annual                                                   140,435
 $140,000             expense growth of 2.5%
                        vs. sector average of                                    117,140
                                                                                                                  3.     Proactive lease expiration
 $120,000                                                                                                                management and inventory readiness
                      3.0%, assuming a 5.0%
 $100,000                     cap rate.                             94,996                                               practices
                                                       73,956
  $80,000                                                                                                         4.     Superior use of web screening and
  $60,000                                 53,978                                                                         capture technology to efficiently drive
                              35,019
                                                                                                                         qualified leasing traffic; high capture
  $40,000
                                                                                                                         rate
                 17,039
  $20,000
                                                                                                                  5.     Enhanced scale, size and efficiencies
       $0                                                                                                                in procurement of third party products
                 2013         2014        2015         2016         2017         2018         2019
                                                                                                                         and services associated with property
                                                                                                                         operations

            Source: Company reports
         1   Sector defined as AIV, AVB, CPT, EQR, ESS, UDR, PPS (through 2016), HME (through 2014), AEC (through 2014), CLP (through 2013), BRE (through 2013)    10
Technology Advances Expected to Enhance Operations and Add Value                                                1
   Smart Home Technology Roll-out In                     Double Play Bulk Internet Roll-out In
   Progress                                              Progress
   2019 Test and 2020 Expansion                          High-Speed Internet added to Bulk Cable Program
   • Tests at 15 properties in 2019 were well            • Program initiated in the back half of 2019 adds
     received                                               high-speed internet access at discounted price to
                                                            residents
   • Mobile control of lights, thermostat and security
                                                         • Opportunity exists for approximately half of the
     as well as leak monitoring provides additional         same store portfolio
     value to residents
                                                         • Expect contracts to be in place for all units by
   • Additional synergy opportunities in repairs and        mid-year 2020, with NOI opportunity building as
     maintenance and vacant and house electric              leases expire or renew
     charges                                             • Projected 2020 NOI growth impact of roughly
   • Expect to install in approximately 24K units in        50bps
     2020 with revenue impact as leases expire or
     renew                                               Other Programs Recently Completed or
                                                         Currently in Review/Testing Phase

                                                          New and Improved Single Operating Platform
                                                          Improvements to Intranet, Digital Content and
                                                           Training for Employees
                                                          Enhanced Online Recruiting Tools
                                                          Utility Monitoring Enhancements
                                                          SightPlan – Mobile Inspections for Service
                                                           Technicians
                                                          Enhanced Company Website and Data
                                                           Analysis
                                                          Artificial Intelligence, Chat, CRM, and Prospect
                                                           Engagement Tools

                                                                                                                11
Strong Balance Sheet and Manageable Debt Maturity Profile                                                                                                                                    1
   CREDIT METRICS AT 12/31/2019
                                                                                                                                                  MAA                 SECTOR AVG4
  Total debt / adjusted total assets1                                                                                                             31.4%                     32.3%
  Total secured debt / adjusted total assets1                                                                                                      4.4%                      5.3%
  Unencumbered NOI / total NOI                                                                                                                    90.2%                     91.1%
  Net debt / recurring adjusted EBITDAre2                                                                                                        4.62x3                      5.05x
  Consolidated income available for debt service to total annual debt service charge1,2                                                           5.10x                      5.65x
  Weighted average maturity of debt (in years)                                                                                                      7.5                       8.1
  1 MAA  calculations as specifically defined in Mid-America Apartments, L.P.’s debt agreements.
  2 Sector average represents publicly disclosed sector equivalent.
  3 Recurring Adjusted EBITDAre for the trailing twelve months ended December 31, 2019 included the impact of the non-cash income related to the fair value adjustment of the embedded

  derivative in the MAA Series I preferred shares. The inclusion of the non-cash income item lowered Net Debt/Recurring Adjusted EBITDAre by 9 basis points for the trailing twelve months
  ended December 31, 2019.
  4 Sector constituents include AVB, CPT, EQR, ESS and UDR; data is from 4Q 2019 company filings

   DEBT MATURITY PROFILE ($ IN MILLIONS) AT 12/31/2019

                                                                                                1
                                                                                         Debt         Commercial Paper Program
   Weighted Average Interest Rate                    3.8%

   Weighted Average Maturity                    7.5 years

                                $70                         $194
                  $138                                                                  $665                        $360                         $416                       $2,612

                              2020                          2021                       2022                         2023                         2024                       2025+

  % MATURING 0.0%               5%                 10.8%    4%                    6.1% 15%                    13.5% 8%                      12.6% 9%                         59%
                                                                                                                                                                         57.0%

  1 Debt   excluding unsecured revolving credit facility and unsecured commercial paper program. At 12/31/19, there was no outstanding balance on the revolving credit facility.

                                                                                                                                                                                             12
Strong Trends Heading Into 2020                                                                                                                                                             2

    4.0%

                                                                                                                 3.6%                                             3.8%
    3.5%                                                                                                                                                   3.7%

                                                                                                                        3.4%
    3.0%

    2.5%
                                   2.3%

    2.0%
                                 2.1%                                        1.9%

    1.5%

    1.0%
                            2017                                       2018                                      2019                                      2020F

                                                              Effective Rent Growth                  Total Revenue Growth

                                                                                                     2019                                   2020F

                    Blended Lease Over Lease Rent Growth                                             4.4%                               2.9% - 3.9%

                    “Earned in” Rent Growth1                                                         0.9%                                    1.7%

       1 “Earned in” rent growth is calculated as December effective rent/unit as compared to the full year effective rent/unit and is intended to capture the carry over growth into the

       following year from in place rents
                                                                                                                                                                                            13
Value Creation through Kitchen and Bath Redevelopment Program                                                      2

 Approximately 25,000 units redeveloped during past 3 years                             Before

  OPPORTUNITY
   Between 12,000 - 14,000 units (including legacy PPS
   portfolio) remaining for redevelopment across same store
   portfolio with potential to create additional rent growth value.

  SCOPE
   Redevelopments are performed on turn at select
   communities (properties remain in same store group),
   minimizing down time and allowing us to continually refine
   the program for real-time improvements

   Standard program includes kitchen and bath upgrades                                  After

       • Stainless appliances
       • Counter top replacement
       • Updated cabinetry
       • Plumbing and light fixture updates
       • Flooring

  RESULTS
                            2017A           2018A          2019A         2020F
  Production                 8,375           8,155          8,329      7,000-8,000
  Average Per Unit Cost     $5,463          $6,138         $5,876     $6,000-$7,000
  Average Rent Increase       8.8%          10.5%           9.8%         9%-10%

                                                                                      Post Parkside, Orlando, FL

                                                                                                                   14
Future Opportunity to Capture                                                                                           2

                                                  MAA REDEVELOPMENT PIPELINE
                                          Pipeline of Units Yet to be Redeveloped

   Currently Identified Redevelopment Opportunity                                  Future Value Opportunity
                                                                                                  At 5.0%   Net Value
                             Legacy    Legacy   Legacy     Total                       Revenue
                                                                                                 Cap Rate   Creation
                              MAA       CLP      PPS       MAA
                                                                                       $17.3M    $346.0M $264.5M

 13K           Units

               Capital
                             3,749

                             $16.9M
                                       3,334

                                      $15.0M
                                                 6,024

                                                $49.6M
                                                          13,107

                                                         $81.5M
   units of
 opportunity   Incremental
                             $3.5M     $3.1M    $10.7M   $17.3M
               Revenue

   Top 10 2020 Markets For Redevelopment
   Atlanta, GA 1,339 units            Nashville, TN 304 units
   Dallas, TX 651 units               Washington, DC 302 units
   Tampa, FL 573 units                Phoenix, AZ 280 units
   Charlotte, NC 513 units            Raleigh/Durham, NC 234 units
   Orlando, FL 363 units              Charleston, SC 220 units
Expanding the Redevelopment Program to Drive Additional Value                                                                                2

    Property Repositioning Program                                       CASE STUDY

    Thoughtful Upgrades to Maximize Revenue                              Post Parkside | Orlando
    • Program differentiated from kitchen/bath
      redevelopment – includes upgrade of amenities,                     Leverage Location and Views of Lake Eola
      exteriors and common areas to keep pace with
      market demand
    • Candidates evaluated on location, potential for
      rent growth, competition and incoming supply
    • 10 properties planned for 2020
    • Approximate 2020 investment of $26M with
      benefit expected in 2021 (8-9% cash on cash
      return)
                                                                         • Property located in highly desirable downtown area
                                                                           overlooking Lake Eola; high foot traffic; grocery, restaurants,
                                                                           events within walking distance; demographics and demand
                                                                           favorable to support upgrade
                                                                         • Current rooftop unused; existing leasing office small, not
                                                                           ideally located; common amenities and exteriors in need of
                                                                           update and expansion
                                                                         • Evaluate repurposing rooftop as resident lounge area
      Unused Rooftop
                                                                         • Evaluate moving and expanding current leasing center for
                                                                           maximum visibility, accessibility and functionality
                                                                         • Evaluate addition of package room and parcel pending
                                                                           solution
                                                                         • Evaluate improvements to existing resident amenities
                                                                           including pool area as well as other exterior updates
                                                                         • Currently greater than 20% delta between rents of the
      Potential for Rooftop Lounge Similar to Comps (pictured example:     subject property and its immediate comparable property set
      Post Midtown Atlanta rooftop terrace)
                                                                                                                                             16
Development Pipeline Poised To Deliver Value                                                                          2

 Current $490 million development pipeline

  Started late                                   Expected                           Expected
  3Q 2019                                       Completion                         Completion
                                                3Q 2020                            2Q 2021

                                               MAA Frisco Bridges II, Dallas, TX   Novel Midtown, Phoenix, AZ

                                                 Expected                           Expected
                                                Completion                         Completion
                                                4Q 2021                            4Q 2021

                                               Westglenn, Denver, CO               Jefferson Sand Lake, Orlando, FL
  336 N Orange, Orlando, FL

                                                                                                                      17
Development Pipeline and Lease-ups Poised To Deliver Value                                                                                                                     2

  • Established history and success of disciplined capital deployment will govern growth through new development
  • Design and investment managed from an owner/operator perspective; long-term margins optimized
  • Spread between forecasted cost basis and current cap rates supports value accretion of approximately $230M from the current pipeline1

                             ACTIVE DEVELOPMENTS AT 12/31/2019
                                                                                                                                      EXPECTED
                                                                                             TOTAL          TOTAL EXP COST               INITIAL            EXPECTED
                                                                                                                                                                     2
                              PROPERTY                           MSA                         UNITS            (IN MILLIONS)          OCCUPANCY          STABILIZATION
        6.2%                 Copper Ridge II         Fort Worth, TX                           168              $         30.0           1Q 2020                1Q 2021
     AVERAGE EXPECTED        MAA Frisco Bridges II   Dallas, TX                               348              $         69.0           2Q 2020                4Q 2021
    STABILIZED NOI YIELD
                             Novel Midtown 3         Phoenix, AZ                              345              $         82.0           4Q 2020                3Q 2022
                             Westglenn               Denver, CO                               306              $         84.5           2Q 2021                3Q 2022
$30M - $31M                  336 N Orange            Orlando, FL                              369              $         99.0           2Q 2021                4Q 2022
 TOTAL EXPECTED STABILIZED   Long Point              Houston, TX                              308              $         57.0           3Q 2021                4Q 2022
     INCREMENTAL NOI
                             Jefferson Sand Lake4    Orlando, FL                              264              $         68.0           2Q 2021                4Q 2022
                             TOTAL ACTIVE DEVELOPMENTS                                      2,108              $        489.5

                             ACTIVE LEASE-UPS AT 12/31/2019
         5.9%
     AVERAGE BLENDED                                                                         TOTAL             TOTAL COST              PHYSICAL            EXPECTED
                                                                                                                                                                    2
    STABILIZED NOI YIELD       PROPERTY                           MSA                        UNITS           (IN MILLIONS)           OCCUPANCY         STABILIZATION
                               Post Parkside at Wade III          Raleigh, NC                  150             $        23.7               96.7%              1Q 2020
                               1201 Midtown II                    Charleston, SC               140             $        28.6               92.9%              1Q 2020
$8.0M - $9.0M                  Sync 36 II                         Denver, CO                    79             $        21.8               45.6%              2Q 2020
 TOTAL EXPECTED STABILIZED
     INCREMENTAL NOI
                               The Greene                         Greenville, SC               271             $        72.1               82.7%              3Q 2020
                               TOTAL ACTIVE LEASE-UPS                                          640             $       146.2               83.6%

                             Source: Company 4Q 2019 Earnings Release Supplemental                             3   MAA owns 80% of the joint venture that owns this property
                             1 Based on 4.5% Cap Rate; includes 4Q 2019 development and lease-up pipeline      4   MAA owns 95% of the joint venture that owns this property
                             2 Communities are considered stabilized after achieving 90% occupancy for 90

                             days
                                                                                                                                                                               18
Differentiated Strategy and Superior Execution Drives Long-term Value Creation                                                                                                                         3
                                                                                                                                      PPS
                                                                                                                                     Merger
      $7.00                                                                                                                                                                                $6.55
                                                                                     CLP                                                                                   $6.04
                                                                                    Merger                                                                 $5.94                   $5.93
      $6.00                                                                                                                $5.69           $5.59
                     Great                                                                                                                                         $5.41
                                                                                                                                                   $5.30
                   Recession                                                                               $5.09   $4.97           $4.96
      $5.00                                                                $4.57
                                                                                           $4.35   $4.38
                                                           $3.98   $3.96
      $4.00                $3.79                                                   $3.74
                                           $3.57
                                                   $3.30
                   $3.08           $3.09                                                                                                                                               10 Year CAGR:
      $3.00                                                                                                                                                                             AFFO 6.8%
                                                                                                                                                                                         FFO 5.6%
      $2.00

      $1.00

      $0.00
                     2009            2010            2011            2012            2013            2014            2015            2016            2017            2018            2019
                                                                                            AFFO/Share        FFO/Share

       AFFO Payout Ratio1                                                                                                                                                            2019 PEER
                                                                                                                                                                                     AVERAGE2
      100.0%

       80.0%                                                                                                                                                                                70.1%

       60.0%

       40.0%

       20.0%
                     79.9%            79.6%           76.1%           66.7%            74.3%           66.7%               62.0%           66.1%           65.7%           68.2%            64.8%
        0.0%
                      2009            2010            2011             2012            2013                2014            2015            2016            2017             2018            2019

               SOURCE: S&P Global, Company, KeyBank Leaderboard, 02/09/2020
               1 AFFO Payout Ratio is defined as annual dividends paid or forecasted to be paid divided by annual AFFO per Share diluted
               2 Weighted average of AFFO Payout Ratio for multifamily peers: AIV, AVB, CPT, EQR, ESS and UDR                                                                                          19
Balance Sheet Capacity With Multiple Capital Sources                                                                                                                                   3
                                                                 DEBT/TOTAL CAPITALIZATION1
                                                                2012                                           2019

                                                            37.0%                                         22.5%
                                                                                                                                   3.2%
                                                                                                                                              0.2%
                                                                      TOTAL CAPITALIZATION1
                                       63.0%
    26.3%                                                                                                           19.3%                              77.3%
                                                               2012                                                                                                       2019
                                                          Common Stock                                                                                               Common Stock
                                                          Unsecured Debt                                                                                             Unsecured Debt
                                                          Secured Debt                                                                                               Secured Debt
                                                                                                                                                                     Preferred Stock
   10.7%

                                     2012                                                                                                 2019
   Total Debt/Total Assets                             44.1%                                             Total Debt/Total Assets                     31.4%
   Annual Dividend/Share                               $2.64                                             Annual Dividend/Share                       $4.00
   Dividend/AFFO                                       66.7%                                             Dividend/AFFO                               64.8%
   Net Debt/Recurring Adj EBITDAre                     6.48x                                             Net Debt/Recurring Adj EBITDAre             4.62x
   Ratings                                             BBB-/Baa2/BBB                                     Ratings                                     BBB+/Baa1/BBB+
   Unencumbered Gross Assets                           53%                                               Unencumbered Gross Assets                   89%
   Average Daily Trading Volume                        300k                                              Average Daily Trading Volume                530k
   Outstanding Public Bonds                            $0                                                Outstanding Public Bonds                    $3.2 billion

           1“Total Capitalization” equals common shares and units outstanding multiplied by the closing stock price on 12/31/2019, plus preferred shares outstanding on

           12/31/2019 at the $50 per share redemption price and Total debt on 12/31/2019.                                                                                              20
Experienced, Tenured Management Team                                                                                           3

                                                                                                           Human
                                                                Finance
   • Experienced, strengthened,                                                                           Resources
     and broadened
     management team                               Al Campbell                                Melanie Carpenter
                                            EVP, Chief Financial Officer             EVP, Chief Human Resources Officer
     enhances execution                         22 years with MAA                             20 years with MAA
     capabilities

   • Team of 26 Senior VPs with                           General Counsel
                                                                                                    Multifamily Property
                                                           & Commercial
     wide range of technical                            Property Operations
                                                                                                        Operations
     experience and expertise
     drives competitive                            Rob DelPriore                                Tom Grimes
                                               EVP, General Counsel                      EVP, Chief Operating Officer
     advantages.                       25 years with MAA (includes outside tenure)           25 years with MAA

      • Average 12 years
        with MAA                                            Acquisitions
                                                                                                     New Development
                                                           & Dispositions
   • Robust property manager
     training and development
                                                       Brad Hill                                 David Ward
     program                            EVP, Director of Multifamily Investing               EVP, Development
                                                 10 years with MAA                   15 years with MAA (includes PPS tenure)

                                  Seasoned Management…Industry Leaders
           NAREIT | NATIONAL MULTIFAMILY HOUSING COUNCIL | URBAN LAND INSTITUTE |
                            NATIONAL HOME BUILDERS ASSOCIATION |
                          STATE AND LOCAL APARTMENT ASSOCIATIONS
                                                                                                                               21
Strong Culture Serving All Stakeholders                                                                                                                        3
    Our long-term commitment to sustainability and responsibly managing our relationships is an essential part of how we provide
  exceptional service and value for our stakeholders. We are dedicated to continuous progress and have established an ESG council
  of executive and senior department heads focused on tracking and enhancing our environmental, social and governance efforts.

  Environmental Stewardship                         Social Responsibility                                Corporate Governance

  CONSERVING RESOURCES                              EMPOWERING ASSOCIATES                                BUILDING CONFIDENCE
  • Low-flow toilets and WaterSense plumbing        • Competitive compensation and benefits              • Corporate Governance Guidelines encompassing
    fixtures                                          packages, recognition programs, and growth           board and committee structure, director and
  • Smart irrigation and water use efficiency         opportunities                                        executive officer standards and stock ownership
    audits                                          • Ongoing training                                     requirements
  • Landscape innovations minimizing turf and       • The latest technology and proven systems           • Code of conduct and ethical standards applying
    using drought tolerant plant material                                                                  to all MAA associates and directors
                                                    • Associate engagement including internal
  • Utility monitoring systems                        communications, reviews and surveys                • Governance practices overseeing policies and
                                                                                                           standards related to shareholder rights and proxy
  REDUCING WASTE                                    CARING FOR RESIDENTS                                   access
  • On-site trash recycling options for residents   • STAR Service Program and routine resident          • Performance-based, equity compensation
  • Trash compaction to reduce pick-ups               surveys                                              aligning executive goals with the long-term best
  • Online leasing and communication tools          • Online resident portal for ease of transactions,     interests of our shareholders
                                                      service request submission and                     • Transparency and accountability of financial
  • Vendor partnerships to recycle carpet and
                                                      communication                                        reporting, auditing and internal controls through
    other flooring materials; use of carpets made
    with recycled content                           • Property amenities to promote healthy lifestyles     risk oversight and anonymous submission
                                                    REACHING THE COMMUNITY                                 platform
  INCREASING ENERGY EFFICIENCY
                                                    • Corporate charity, Open Arms Foundation,           • Strong governance ratings from Green Street
  • Reduced watt, high performance lighting                                                                Advisors and Institutional Shareholder Services
    fixtures in community breezeways and              provides temporary housing to families who
    common areas                                      must travel for medical treatment. Over 3,000
                                                      families helped to date in over 50 MAA homes.
  • Routine maintenance and audits of HVAC
    systems and upgrades to efficient equipment
  • Energy Star rated appliances
  • Smart thermostats
                                                               2019-2020 Initiatives
                 GRESB ASSESSMENT | FIRST CORPORATE SUSTAINABILITY REPORT | PROPERTY LEVEL UTILITY MONITORING                                                  22
2020 Same Store Outlook                                                                                                             3

                             REVENUE                                                           EXPENSE
  Property Revenue Growth                3.25% - 4.25%             Property Expense Growth               3.75% - 4.75%
  Full Year 2020 Forecast                                          Full Year 2020 Forecast
                                            3.75%                                                            4.25%
                                             Midpoint                                                        Midpoint

  Blended Lease Over Lease                 2.9% - 3.9%               Real Estate Tax Growth              4.00% - 5.00%
  Pricing                                                            Full Year 2020 Forecast
                                             3.4%                                                            4.50%
  Full Year 2020 Forecast
                                             Midpoint                                                        Midpoint
  February 2020 YTD: 2.0%

  Average Physical Occupancy             95.6% - 96.0%               Insurance Expense                   Will renew July 1st
  Full Year 2020 Forecast                                            Full Year 2020 Forecast        with an expected 10-15%
  10bps below prior year
                                            95.8%
                                                                                                     increase over prior policy
                                             Midpoint
                                                                                                    period inclusive of all lines
  February 2020 YTD: 95.6%                                                                                 of insurance
  Double Play Internet               Expected to contribute          Double Play Internet             Expected to contribute
  Full Year 2020 Forecast                                            Full Year 2020 Forecast         65bps to expense growth
                                    55bps to revenue growth
                                          for the year                                                     for the year

  Other Fee/Ancillary Income           Expected to be flat as        All Other Expenses             Expected to be in the 3.0%
  Full Year 2020 Forecast          compared to prior year due to     Full Year 2020 Forecast        growth range on average for
                                     slightly lower occupancy                                                the year

                            Full Year 2020 NOI Growth Range Forecast of 3.0% - 4.0%

                                                                                                                                    23
2020 Core FFO and Investment Outlook                                                                                                                                                            3

     EXPECTED CORE FFO/SHARE1                                                 CAPITAL INITIATIVES4                                       TRANSACTIONS4/FINANCING
    Full Year 20202                    $6.38 - $6.62                   Smart Home                        $35M - $38M                 Multifamily                         $175M - $225M
                                           $6.50                       Investment                         Capital Spend              Acquisitions                             $200M
                                            Midpoint                   24k to 25k units                                              All in lease up, i.e.                      Midpoint
                                                                       installed in 2020                                             initially dilutive
    Q1 20203                           $1.53 - $1.65                   Exterior                          $25M - $30M                 Multifamily                         $125M - $150M
                                           $1.59                       Redevelopment                      Capital Spend              Dispositions                             $138M
                                            Midpoint                   10 properties                                                                                            Midpoint
                                                                       targeted for 2020

    Actual 2019 results included $0.29 per                             Interior                          $48M - $52M                 Multifamily                         $225M - $275M
    Share of unusual or non-cash items that                            Redevelopment                      Capital Spend              Development                              $250M
    are not forecasted to recur in 2020:                               7k to 8k units in                                             Funding                                    Midpoint
                                                                       2020
    • $0.15 per Share from the valuation of the
      preferred derivative                                                                                                           Unsecured Bond                      $300M - $400M
    • $0.10 per Share of land gains                                                                                                  Exploring 5 year                     3.00% - 3.75%
    • $0.04 per Share of various other items                                                                                         to 30 year options                 [TIMING: Q2 2020]
    On a Core FFO basis, FFO/Share in 2019                                                                                           Equity Issuance                     $80M of equity
    was $6.26                                                                                                                                                        assumed at midpoint
                                                                                                                                                                    of transaction guidance

1 In this context, per Share means per diluted common share and unit.
2 Net income per diluted common share is expected to be in the range of $3.02 to $3.26 per diluted common share ($3.14 at the midpoint) for the full year 2020.
3 MAA does not forecast Net income per diluted common share on a quarterly basis as MAA cannot predict the timing of forecasted acquisition and disposition activity within a particular quarter (rather

  than during the course of the full year).
4 Expectations for the full year 2020

                                                                                                                                                                                                       24
•   Reconciliation of Non-GAAP Financial Measures
 APPENDIX              •   Definitions of Non-GAAP Financial Measures and Other Key
                           Terms

At December 31, 2019

                                                                                      25
Reconciliation of Non-GAAP Financial Measures

RECONCILIATION OF FFO, AFFO AND FAD TO NET INCOME AVAILABLE FOR MAA COMMON SHAREHOLDERS

Amounts in thousands, except per share and unit data                                             Three months ended December 31,                    Year ended December 31,
                                                                                                     2019              2018                         2019             2018
Net income available for MAA common shareholders                                                $      148,667    $        60,360             $       350,123    $      219,211
   Depreciation and amortization of real estate assets                                                 123,928           120,181                      490,632           484,722
   (Gain) loss on sale of depreciable real estate assets                                                (80,001)                18                     (80,988)                39
   Depreciation and amortization of real estate assets of real estate joint venture                          153               152                          618               595
   Net income attributable to noncontrolling interests                                                     5,471             2,235                      12,807              8,123
Funds from operations attributable to the Company (1)                                                  198,218           182,946                      773,192           712,690
   Recurring capital expenditures                                                                       (14,320)          (15,887)                     (72,781)          (71,960)
Adjusted funds from operations (1)                                                                     183,898           167,059                      700,411           640,730
   Redevelopment capital expenditures                                                                   (13,139)          (14,001)                     (58,199)          (55,148)
   Revenue enhancing capital expenditures                                                                 (6,804)           (8,905)                    (32,871)          (30,910)
   Commercial capital expenditures                                                                       (2,056)            (1,575)                      (7,075)           (8,150)
   Other capital expenditures                                                                             (5,785)           (7,288)                    (19,280)          (31,417)
Funds available for distribution (1)                                                            $      156,114    $      135,290              $       582,986    $      515,105

Dividends and distributions paid                                                                $        113,630       $        108,808       $        453,682       $        434,928

Weighted average common shares - diluted                                                                 114,309                113,880                114,113                113,836
FFO weighted average common shares and units - diluted                                                   118,214                117,974                118,127                117,948

Earnings per common share - diluted:
Net income available for common shareholders                                                    $            1.30      $            0.53      $            3.07      $                1.93

Funds from operations per Share - diluted (2)                                                   $            1.68      $            1.55      $            6.55      $            6.04
Adjusted funds from operations per Share - diluted (2)                                          $            1.56      $            1.42      $            5.93      $            5.43

 (1) Results for the years ended December 31, 2019 and 2018 included $17.9 million of non-cash income and $2.6 million of non-cash expense, respectively, related to the fair value
 adjustment of the embedded derivative in the MAA Series I preferred shares.
 (2) Results for the years ended December 31, 2019 and 2018 included $0.15 per Share of non-cash income and $0.02 per Share of non-cash expense, respectively, related to the fair

 value adjustment of the embedded derivative in the MAA Series I preferred shares.

                                                                                                                                                                                             26
Reconciliation of Non-GAAP Financial Measures

RECONCILIATION OF NET OPERATING INCOME TO NET INCOME AVAILABLE FOR MAA COMMON SHAREHOLDERS

Dollars in thousands                                                              Three Months Ended                                          Year Ended
                                                               December 31,          September 30,          December 31,            December 31,      December 31,
                                                                  2019                   2019                  2018                    2019              2018
Net Operating Income
   Same Store NOI                                          $         247,739       $       238,137      $         235,966       $         956,075 $         921,240
   Non-Same Store NOI                                                  19,291                17,956                 15,468                  72,097            55,518
Total NOI                                                            267,030               256,093                251,434               1,028,172           976,758
   Depreciation and amortization                                    (125,426)             (124,684)              (121,541)               (496,843)         (489,759)
   Property management expenses                                      (13,816)              (13,899)               (12,054)                (55,011 )          (47,633 )
   General and administrative expenses                               (10,885)              (11,485)                 (9,063)               (46,121 )          (34,786 )
   Merger and integration expenses                                           —                     —                   (609)                      —            (9,112 )
   Interest expense                                                   (43,698)              (44,513)               (44,454)              (179,847)         (173,594)
   Gain (loss) on sale of depreciable real estate assets               80,001                  1,000                     (18)               80,988                 (39 )
   Gain on sale of non-depreciable real estate assets                    2,787                     —                    662                 12,047              4,532
   Other non-operating (expense) income                                   (495)              20,060                    (631)                25,275              5,434
   Income tax expense                                                     (882)               (1,491)                  (785)                 (3,696 )          (2,611 )
   Income from real estate joint venture                                   444                   378                    576                   1,654             1,832
   Net income attributable to noncontrolling interests                  (5,471)               (2,814)                (2,235)               (12,807 )           (8,123 )
   Dividends to MAA Series I preferred shareholders                       (922)                 (922)                  (922)                 (3,688 )          (3,688 )
Net income available for MAA common shareholders           $         148,667       $         77,723     $           60,360      $         350,123 $         219,211

                                                                                                                                                                           27
Reconciliation of Non-GAAP Financial Measures

RECONCILIATION OF EBITDA, EBITDAre, ADJUSTED EBITDAre AND RECURRING ADJUSTED EBITDAre TO NET INCOME

Dollars in thousands                                                                          Three Months Ended                                         Year Ended
                                                                                        December 31,        December 31,                     December 31,         December 31,
                                                                                           2019                2018                             2019                 2018
Net income                                                                            $       155,060    $         63,517                  $        366,618     $       231,022
   Depreciation and amortization                                                              125,426             121,541                           496,843             489,759
   Interest expense                                                                             43,698             44,454                           179,847             173,594
   Income tax expense                                                                              882                785                              3,696               2,611
EBITDA                                                                                        325,066             230,297                         1,047,004             896,986
   (Gain) loss on sale of depreciable real estate assets                                       (80,001)                  18                          (80,988)                 39
   Adjustments to reflect the Company's share of EBITDAre of
   unconsolidated affiliates                                                                            336                       321                     1,351                     1,242
EBITDAre                                                                                           245,401                   230,636                   967,367                   898,267
   Loss (gain) on debt extinguishment (1)                                                               193                    (1,960)                      253                    (2,179)
   Net casualty (gain) loss and other settlement proceeds (1)                                        (1,491)                      920                    (3,390)                     (724)
   Gain on sale of non-depreciable assets                                                            (2,787)                     (662)                  (12,047)                   (4,532)
Adjusted EBITDAre                                                                                  241,316                   228,934                   952,183                   890,832
   Merger and integration expenses                                                                        —                       609                         —                     9,112
Recurring Adjusted EBITDAre (2)                                                       $            241,316      $            229,543       $           952,183       $           899,944

 (1) Included  in Other non-operating income in the Consolidated Statements of Operations.
 (2) Recurring  Adjusted EBITDAre for the trailing twelve months ended December 31, 2019 included the impact of the non-cash income related to the fair value adjustment of the embedded
 derivative in the MAA Series I preferred shares. The inclusion of this non-cash income item lowered Net Debt/Recurring Adjusted EBITDAre by 9 basis points for the trailing twelve months
 ended December 31, 2019. Recurring Adjusted EBITDAre for the trailing twelve months ended December 31, 2018 included the impact of the non-cash expense related to the fair value
 adjustment of the embedded derivative in the MAA Series I preferred shares. The inclusion of this non-cash expense item increased Net Debt/Recurring Adjusted EBITDAre by 1 basis point
 for the trailing twelve months ended December 31, 2018.

                                                                                                                                                                                             28
Reconciliation of Non-GAAP Financial Measures

RECONCILIATION OF NET DEBT TO UNSECURED NOTES PAYABLE AND SECURED NOTES PAYABLE
Dollars in thousands
                                                                                  December 31, 2019             December 31, 2018
Unsecured notes payable                                                     $                 3,828,201     $              4,053,302
Secured notes payable                                                                           626,397                       475,026
Total debt                                                                                    4,454,598                    4,528,328
   Cash and cash equivalents                                                                     (20,476)                      (34,259)
   1031(b) exchange proceeds included in Restricted cash (1)                                     (33,843)                            —
Net Debt                                                                    $                 4,400,279     $              4,494,069

RECONCILIATION OF GROSS ASSETS TO TOTAL ASSETS
Dollars in thousands
                                                                                  December 31, 2019             December 31, 2018
Total assets                                                                $               11,230,450      $             11,323,781
   Accumulated depreciation                                                                   2,955,253                    2,549,287
Gross Assets                                                                $               14,185,703      $             13,873,068

RECONCILIATION OF GROSS REAL ESTATE ASSETS TO REAL ESTATE ASSETS, NET
Dollars in thousands
                                                                                  December 31, 2019             December 31, 2018
Real estate assets, net                                                     $               10,987,128      $             11,151,701
   Accumulated depreciation                                                                   2,955,253                    2,549,287
   Cash and cash equivalents                                                                     20,476                        34,259
   1031(b) exchange proceeds included in Restricted cash (1)                                     33,843                             —
Gross Real Estate Assets                                                    $               13,996,700      $             13,735,247

 (1) Included   in Restricted cash on the Consolidated Balance Sheets.

                                                                                                                                          29
Reconciliation of Non-GAAP Financial Measures

RECONCILIATION OF NET INCOME PER DILUTED COMMON SHARE TO CORE FFO AND CORE AFFO PER SHARE FOR 2019 RESULTS AND 2020 GUIDANCE

                                                                      Year ended                                       2020 Full Year Guidance Range
                                                                   December 31, 2019                             Low                                   High
Earnings per common share - diluted                           $                          3.07          $                      3.02      $                          3.26
Real estate depreciation and amortization                                                4.17                                 4.23                                 4.23
Gains on sale of depreciable assets                                                     (0.69)                               (0.89)                               (0.89)
   FFO per Share - diluted                                                               6.55                                 6.36                                 6.60
Non-Core items                                                                          (0.29)   (1)                          0.02                                 0.02
   Core FFO per Share - diluted                                                          6.26                                 6.38                                 6.62
Recurring capital expenditures                                                          (0.62)                               (0.67)                               (0.67)
   Core AFFO per Share - diluted                              $                          5.64          $                      5.71      $                          5.95

 (1) Non-Core items may include adjustments related to the fair value adjustment of the embedded derivative in the MAA Series I preferred shares, adjustments for gains

 or losses from an unconsolidated limited partnership, merger and integration expenses, mark-to-market debt adjustments, loss or gain on debt extinguishment, net
 casualty gain or loss, and loss or gain on sale of non-depreciable assets. Results for the year ended December 31, 2019 included $0.15 per Share of non-cash income
 related to the fair value adjustment of the embedded derivative in the MAA Series I preferred shares, $0.10 per Share of gains related to the sale of non-depreciable
 real estate assets and $0.04 per Share of income related to other net adjustments.

                                                                                                                                                                           30
Definitions of Non-GAAP Financial Measures

Adjusted EBITDAre
For purposes of calculations in this release, Adjusted Earnings Before Interest, Income Taxes, Depreciation and Amortization for real estate, or Adjusted EBITDAre, is composed
of EBITDAre adjusted for net gain or loss on non-depreciable asset sales, insurance and other settlement proceeds and gain or loss on debt extinguishment. As an owner and
operator of real estate, MAA considers Adjusted EBITDAre to be an important measure of performance from core operations because Adjusted EBITDAre does not include
various income and expense items that are not indicative of operating performance. MAA's computation of Adjusted EBITDAre may differ from the methodology utilized by
other companies to calculate Adjusted EBITDAre. Adjusted EBITDAre should not be considered as an alternative to Net income as an indicator of operating performance.

Adjusted Funds From Operations (AFFO)
AFFO is composed of FFO less recurring capital expenditures. In order to better align the classification of capital expenditures with business goals, certain capital expenditures
related to commercial properties have been reclassified out of recurring capital expenditures and revenue enhancing capital expenditures for comparative purposes. AFFO
should not be considered as an alternative to Net income available for MAA common shareholders as an indicator of operating performance. As an owner and operator of real
estate, MAA considers AFFO to be an important measure of performance from operations because AFFO measures the ability to control revenues, expenses and recurring
capital expenditures.

Core Adjusted Funds from Operations (Core AFFO)
Core AFFO is composed of Core FFO less recurring capital expenditures. Core AFFO should not be considered as an alternative to Net income available for MAA common
shareholders as an indicator of operating performance. As an owner and operator of real estate, MAA considers Core AFFO to be an important measure of performance from
core operations because Core AFFO measures the ability to control revenues, expenses and recurring capital expenditures.

Core Funds from Operations (Core FFO)
Core FFO represents FFO further adjusted for items that are not considered part of MAA’s core business operations such as adjustments related to the fair value adjustment of
the embedded derivative in the MAA Series I preferred shares, adjustments for gains or losses from an unconsolidated limited partnership, merger and integration expenses,
mark-to-market debt adjustments, loss or gain on debt extinguishment, net casualty gain or loss and loss or gain on sale of non-depreciable assets. While MAA's definition of
Core FFO may be similar to others in the industry, MAA's methodology for calculating Core FFO may differ from that utilized by other REITs and, accordingly, may not be
comparable to such other REITs. Core FFO should not be considered as an alternative to Net income available for MAA common shareholders as an indicator of operating
performance. MAA believes that Core FFO is helpful in understanding our core operating performance between periods in that it removes certain items that by their nature are
not comparable over periods and therefore tend to obscure actual operating performance.

EBITDA
For purposes of calculations in this release, Earnings Before Interest, Income Taxes, Depreciation and Amortization, or EBITDA, is composed of net income plus depreciation
and amortization, interest expense, and income taxes. As an owner and operator of real estate, MAA considers EBITDA to be an important measure of performance from core
operations because EBITDA does not include various expense items that are not indicative of operating performance. EBITDA should not be considered as an alternative to Net
income as an indicator of operating performance.

                                                                                                                                                                                     31
Definitions of Non-GAAP Financial Measures

EBITDAre
For purposes of calculations in this release, Earnings Before Interest, Income Taxes, Depreciation and Amortization for real estate, or EBITDAre, is composed of EBITDA, as
defined above, excluding the gain or loss on sale of depreciable asset sales and plus adjustments to reflect MAA's share of EBITDAre of unconsolidated affiliates. As an owner
and operator of real estate, MAA considers EBITDAre to be an important measure of performance from core operations because EBITDAre does not include various expense
items that are not indicative of operating performance. While MAA's definition of EBITDAre is in accordance with NAREIT's definition, it may differ from the methodology utilized
by other companies to calculate EBITDAre. EBITDAre should not be considered as an alternative to Net income as an indicator of operating performance.

Funds Available for Distribution (FAD)
FAD is composed of FFO less total capital expenditures, excluding development spending and property acquisitions. FAD should not be considered as an alternative to Net
income available for MAA common shareholders as an indicator of operating performance. As an owner and operator of real estate, MAA considers FAD to be an important
measure of performance from core operations because FAD measures the ability to control revenues, expenses and total capital expenditures.

Funds From Operations (FFO)
FFO represents net income available for MAA common shareholders (calculated in accordance with GAAP) excluding gains or losses on disposition of operating properties and
asset impairment, plus depreciation and amortization of real estate assets, net income attributable to noncontrolling interests, and adjustments for joint ventures. Because
noncontrolling interest is added back, FFO, when used in this document, represents FFO attributable to the Company. While MAA's definition of FFO is in accordance with
NAREIT's definition, it may differ from the methodology for calculating FFO utilized by other companies and, accordingly, may not be comparable to such other companies. FFO
should not be considered as an alternative to Net income available for MAA common shareholders as an indicator of operating performance. MAA believes that FFO is helpful
in understanding operating performance in that FFO excludes depreciation and amortization of real estate assets. MAA believes that GAAP historical cost depreciation of real
estate assets is generally not correlated with changes in the value of those assets, whose value does not diminish predictably over time, as historical cost depreciation implies.

Gross Assets
Gross Assets represents Total assets plus Accumulated depreciation. MAA believes that Gross Assets can be used as a helpful tool in evaluating its balance sheet positions.
MAA believes that GAAP historical cost depreciation of real estate assets is generally not correlated with changes in the value of those assets, whose value does not diminish
predictably over time, as historical cost depreciation implies.

Gross Real Estate Assets
Gross Real Estate Assets represents Real estate assets, net plus Accumulated depreciation and Cash and cash equivalents. MAA believes that Gross Real Estate Assets can
be used as a helpful tool in evaluating its balance sheet positions. MAA believes that GAAP historical cost depreciation of real estate assets is generally not correlated with
changes in the value of those assets, whose value does not diminish predictably over time, as historical cost depreciation implies.

Net Debt
Net Debt represents Unsecured notes payable and Secured notes payable less Cash and cash equivalents. MAA believes Net Debt is a helpful tool in evaluating its debt
position.

                                                                                                                                                                                  32
Definitions of Non-GAAP Financial Measures

Net Operating Income (NOI)
Net Operating Income represents Rental and other property revenues less Total property operating expenses, excluding depreciation, for all properties held during the period,
regardless of their status as held for sale. NOI should not be considered as an alternative to Net income available for MAA common shareholders. MAA believes NOI by market
is a helpful tool in evaluating the operating performance within MAA's markets because it measures the core operations of property performance by excluding corporate level
expenses and other items not related to property operating performance.

Recurring Adjusted EBITDAre
Recurring Adjusted EBITDAre represents Adjusted EBITDAre further adjusted to exclude certain items that are not considered part of MAA's core business operations such as
acquisition and merger and integration expenses. MAA believes Recurring Adjusted EBITDAre is an important performance measure as it adjusts for certain items that by their
nature are not comparable over periods and therefore tend to obscure actual operating performance. MAA's definition of Recurring Adjusted EBITDAre may differ from the
methodology utilized by other companies to calculate Recurring Adjusted EBITDAre. Recurring Adjusted EBITDAre should not be considered as an alternative to Net income as
an indicator of operating performance.

Same Store NOI
Same Store NOI represents Rental and other property revenues less Total property operating expenses, excluding depreciation, for all properties classified within the Same
Store Portfolio during the period. Same Store NOI should not be considered as an alternative to Net income available for MAA common shareholders. MAA believes Same
Store NOI is a helpful tool in evaluating the operating performance within MAA's markets because it measures the core operations of property performance by excluding
corporate level expenses and other items not related to property operating performance.

                                                                                                                                                                                33
Definitions of Other Key Terms

Average Effective Rent per Unit
Average Effective Rent per Unit represents the average of gross rent amounts after the effect of leasing concessions for occupied units plus prevalent market rates asked for
unoccupied units, divided by the total number of units. Leasing concessions represent discounts to the current market rate. MAA believes average effective rent is a helpful
measurement in evaluating average pricing. It does not represent actual rental revenue collected per unit.

Average Physical Occupancy
Average Physical Occupancy represents the average of the daily physical occupancy for the respective period.

Development Communities
Communities remain identified as development until certificates of occupancy are obtained for all units under development. Once all units are delivered and available for
occupancy, the community moves into the Lease-up Communities portfolio.

Lease-up Communities
New acquisitions acquired during lease-up and newly developed communities remain in the Lease-up Communities portfolio until stabilized. Communities are considered
stabilized after achieving at least 90% occupancy for 90 days.

Non-Same Store Portfolio
Non-Same Store Portfolio includes recent acquisitions, communities that have been identified for disposition, communities that have undergone a significant casualty loss,
and stabilized communities that do not meet the requirements defined by the Same Store Portfolio.

Same Store Portfolio
MAA reviews its Same Store Portfolio at the beginning of each calendar year, or as significant transactions warrant. Communities are generally added into the Same Store
Portfolio if they were owned and stabilized at the beginning of the previous year. Communities are considered stabilized after achieving at least 90% occupancy for 90 days.
Communities that have been approved by MAA's Board of Directors for disposition are excluded from the Same Store Portfolio. Communities that have undergone a significant
casualty loss are also excluded from the Same Store Portfolio.

Unencumbered NOI
Unencumbered NOI represents NOI generated by unencumbered assets (as defined in MAALP's bond covenants).

                                                                                                                                                                                34
You can also read