2021 Citi Virtual Global Property CEO Conference - March 8-11, 2021

Page created by Dan Maxwell
 
CONTINUE READING
2021 Citi Virtual Global Property CEO Conference - March 8-11, 2021
2021 Citi Virtual Global
Property CEO Conference
March 8-11, 2021
2021 Citi Virtual Global Property CEO Conference - March 8-11, 2021
FORWARD-LOOKING STATEMENTS
This presentation contains forward-looking statements within the meaning of Section 27A of the Securities Act of 1933, as amended, and Section 21E of the Securities Exchange Act of 1934, as
amended, with respect to our expectations for future periods. Forward-looking statements do not discuss historical fact, but instead include statements related to expectations, projections,
intentions or other items related to the future. Such forward-looking statements include, without limitation, statements regarding the potential impact of the COVID-19 pandemic on our business,
statements regarding expected operating performance and results, property stabilizations, property acquisition and disposition activity, joint venture activity, development and renovation activity
and other capital expenditures, and capital raising and financing activity, as well as lease pricing, revenue and expense growth, occupancy, supply level, job growth, interest rate and other
economic expectations. Words such as “expects,” “anticipates,” “intends,” “plans,” “believes,” “seeks,” “estimates,” “forecasts,” “projects,” “assumes,” “will,” “may,” “could,” “should,” “budget,”
“target,” “outlook,” “guidance” and variations of such words and similar expressions are intended to identify such forward-looking statements. Such forward-looking statements involve known and
unknown risks, uncertainties and other factors, as described below, which may cause our actual results, performance or achievements to be materially different from the results of operations,
financial conditions or plans expressed or implied by such forward-looking statements. Although we believe that the assumptions underlying the forward-looking statements contained herein are
reasonable, any of the assumptions could be inaccurate, and therefore such forward-looking statements included in this presentation may not prove to be accurate. In light of the significant
uncertainties inherent in the forward-looking statements included herein, the inclusion of such information should not be regarded as a representation by us or any other person that the results or
conditions described in such statements or our objectives and plans will be achieved.

The following factors, among others, could cause our actual results, performance or achievements to differ materially from those expressed or implied in the forward-looking statements: the COVID-
19 pandemic and measures taken or that may be taken by federal, state and local governmental authorities to combat the spread of the disease; inability to generate sufficient cash flows due to
unfavorable economic and market conditions, changes in supply and/or demand, competition, uninsured losses, changes in tax and housing laws, or other factors; exposure, as a multifamily
focused REIT, to risks inherent in investments in a single industry and sector; adverse changes in real estate markets, including, but not limited to, the extent of future demand for multifamily units
in our significant markets, barriers of entry into new markets which we may seek to enter in the future, limitations on our ability to increase rental rates, competition, our ability to identify and
consummate attractive acquisitions or development projects on favorable terms, our ability to consummate any planned dispositions in a timely manner on acceptable terms, and our ability to
reinvest sale proceeds in a manner that generates favorable returns; failure of new acquisitions to achieve anticipated results or be efficiently integrated; failure of development communities to be
completed within budget and on a timely basis, if at all, to lease-up as anticipated or to achieve anticipated results; unexpected capital needs; material changes in operating costs, including real
estate taxes, utilities and insurance costs; inability to obtain appropriate insurance coverage at reasonable rates, or at all, or losses from catastrophes in excess of our insurance coverage; ability to
obtain financing at favorable rates, if at all, and refinance existing debt as it matures; level and volatility of interest or capitalization rates or capital market conditions; price volatility, dislocations
and liquidity disruptions in the financial markets and the resulting impact on financing; the effect of any rating agency actions on the cost and availability of new debt financing; the effect of the
phase-out of the London Interbank Offered Rate, or LIBOR, as a variable rate debt benchmark by the end of 2021 and the transition to a different benchmark interest rate; significant decline in
market value of real estate serving as collateral for mortgage obligations; significant change in the mortgage financing market that would cause single-family housing, either as an owned or rental
product, to become a more significant competitive product; our ability to continue to satisfy complex rules in order to maintain our status as a REIT for federal income tax purposes, the ability of
MAALP to satisfy the rules to maintain its status as a partnership for federal income tax purposes, the ability of our taxable REIT subsidiaries to maintain their status as such for federal income tax
purposes, and our ability and the ability of our subsidiaries to operate effectively within the limitations imposed by these rules; inability to attract and retain qualified personnel; cyber liability or
potential liability for breaches of our or our service providers’ information technology systems, or business operations disruptions; potential liability for environmental contamination; adverse
legislative or regulatory developments; extreme weather, natural disasters, disease outbreak and public health events; legal proceedings or class action lawsuits; compliance costs associated with
numerous federal, state and local laws and regulations; and other risks identified in reports we file with the Securities and Exchange Commission from time to time, including those discussed under
the heading “Risk Factors” in our most recently filed Annual Report on Form 10-K and subsequent Quarterly Reports on Form 10-Q. We undertake no duty to update or revise any forward-looking
statements appearing in this presentation to reflect events, circumstances or changes in expectations after the date of this presentation.

REGULATION G
This presentation contains certain non-GAAP financial measures within the meaning of the Securities Exchange Act of 1934, as amended. Our definitions of such non-GAAP financial measures and
reconciliations to the most directly comparable GAAP measures can be found in the accompanying Appendix and under the “Filings & Financials – Quarterly Results” navigation tab on the “For
Investors” page of our website at www.maac.com.

                                                                                                                                                                                                                   2
2021 Citi Virtual Global Property CEO Conference - March 8-11, 2021
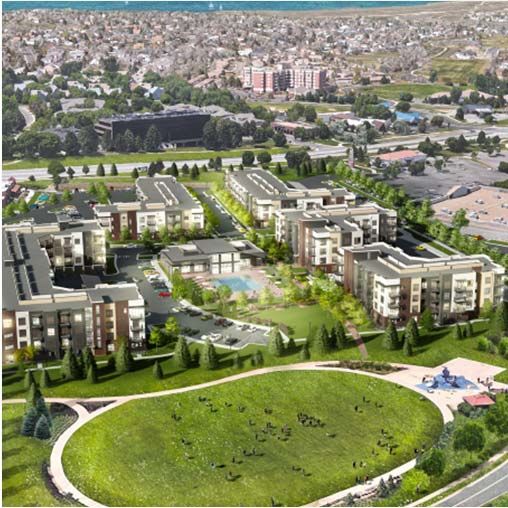
A Strategy Focused On Creating Value Through The Full Market Cycle

                           DIFFERENTIATED
                                            • MAA has broad diversification and balance across the high-growth
                              PORTFOLIO
                                              Sunbelt region, appealing to the largest segment of the rental market.
                              STRATEGY

                                            • Portfolio strategy supports above-sector-average operating expectations.
                           2021 OUTLOOK &
                                            • MAA’s differentiated approach and strategy has supported long-term TSR
                               UPDATE
                                              outperformance.

                                            • MAA’s focus on technology at both the property and corporate level drive
                                              additional value and competitive advantage.
                            TECHNOLOGY
                                            • Smart home installations and bulk internet program expected to enhance
                            INITIATIVES &
                                              2021 revenue.
                             INNOVATION     • Advances in website lead generation technology expand our ability to
                                              reach prospective residents.

                                            • MAA’s proven kitchen and bath redevelopment program enhances
                               ROBUST
                                              earnings potential.
                           REDEVELOPMENT
                                            • Significant opportunities remain throughout portfolio.
                              PROGRAM       • Repositioning program expected to drive property level rent growth.

                                            • MAA’s exclusive focus on high-growth Sunbelt region for over 25 years,
                                              superior track record of closing performance and strong balance sheet
                          EXTERNAL GROWTH
                                              drive robust deal flow.
                            OPPORTUNITIES
                                            • Expanded growth platform through new development
                                            • Joint ventures with developers (pre-purchase of developments)

                                            • MAA maintains a strong investment grade balance sheet and strong
                           BALANCE SHEET
                                              dividend payout ratio - positioning us well for new growth opportunities
                             STRENGTH
                                              and offering protection from potential downside pressures.

                                            • MAA’s sustainability commitment is a key part of how we provide
                           SUSTAINABILITY
                                              exceptional service and long-term value for our stakeholders.

                                                                                                                         3
2021 Citi Virtual Global Property CEO Conference - March 8-11, 2021
Market Diversification and Submarket Balance across the Sunbelt Region

TOP 10 MARKETS                   % 4Q 2020
                                   SS NOI

Atlanta, GA                         12.8%
Dallas, TX                           8.6%
Tampa, FL                            6.8%
Charlotte, NC                        6.7%
Washington, DC                       6.5%
Austin, TX                           6.2%                 67.1%
Orlando, FL                          6.2%
Nashville, TN                        4.7%                         Multifamily Market
Raleigh/Durham, NC                   4.6%
                                                                  Multifamily Market and Regional Office
Houston, TX                          4.0%
                                                                  Multifamily Market and Corporate Headquarters

                                                                DIVERSIFIED WITHIN                                DIVERSIFIED IN                                       DIVERSIFIED IN
                                                                   SUBMARKETS1                                    PRICE POINTS1,2                                      ASSET TYPES1,3
                    287
             SS COMMUNITIES
                                                                                     42%                                                                             64%
                                                                                                               54%
                95,113                                          48%                                                                    46%
                                                                                                                                                                                           32%
                   SS UNITS
                                                                              10%                                                                                                 4%

                                                   Inner Loop   Suburban/Satellite City   Downtown/CBD              A to A+       B to B+                         Garden      Mid-Rise     High Rise

               1Based on gross asset value at 12/31/2020 for total multifamily portfolio              3 Garden style = 3 stories or less; Mid-rise = 4 to 9 stories; High rise = 10+ stories
               2 Averageeffective rent/unit for 4Q 2020 of $1,325 or higher for A to A+ and below     Source: Company and Company 4Q 2020 Earnings Release Supplemental                                4
               $1,325 for B to B+ for total multifamily portfolio
2021 Citi Virtual Global Property CEO Conference - March 8-11, 2021
2021 Supply and Demand Expectations

   MAA Footprint
   JOB GROWTH                                                                        NEW SUPPLY
   • 1.6 Million jobs lost in our markets in 2020                                    • Supply deliveries in our markets elevated last few
   • 2021 job recovery expected to be swift augmented                                  years
     by inbound migration of jobs and households to the                              • Due to higher starts in 2019, 2021 expected supply
     Sunbelt from higher cost Coastal markets                                          picture similar to 2020
   • 3.5% Job growth expected in our markets in 2021                                 • 2.5% - 3.0% higher inventory YOY expected in 2021
   • Timing of employment recovery expected to be tied to                            • Lower supply expected in 2022 due to decline in
     wider vaccine rollout and government stimulus                                     permits and starts

   Portfolio Level
   Though 2021 estimated Market Level Supply picture looks similar to 2020, 2021 anticipated Job Growth outlook
   is expected to be much improved from last year.
                                                                                                              JOBS TO COMPLETION
                                  2021 SUPPLY DELIVERIES (YOY)                 JOB GROWTH (YOY)                          Projected

                                MARKET LEVEL                RADIUS LEVEL        MARKET LEVEL                     2020                2021
   Atlanta, GA                          =                           =               >3.0%
                                                                                                                -10:1                8:1
   Dallas, TX                           =                           =               >4.0%
                                                                                                                NOTES ON SUPPLY
   Charlotte, NC                        =                           +             2.5% - 3.0%
                                                                                                         New and expected 2021 supply deliveries
   Tampa, FL                            =                           =               >3.0%              primarily in URBAN submarkets (10% of our
                                                                                                       portfolio) and averaging $0.35/square foot or
   Washington, DC                       =                           +             2.5% - 3.0%           25% higher than our average rents nearby.

         Source: Moody’s, Witten Advisors, Yardi Matrix, company information                                                                           5
2021 Citi Virtual Global Property CEO Conference - March 8-11, 2021
2021 Same Store Outlook

                               REVENUE                                                           EXPENSE
  Property Revenue Growth                     1.0% - 3.0%            Property Expense Growth                  3.0% - 5.0%
  Full Year 2021 Forecast                                            Full Year 2021 Forecast
                                                 2.0%                                                           4.0%
                                                Midpoint                                                        Midpoint

  Effective Rent Growth                       1.2% - 2.2%              Real Estate Tax Growth               3.25% - 4.25%
  Full Year 2021 Forecast                                              Full Year 2021 Forecast
                                                 1.7%                                                          3.75%
  Combination of blended LOL% growth            Midpoint                                                        Midpoint
  achieved in 2020 and blended LOL%
  growth expected in 2021

  Average Physical Occupancy                95.25% - 95.75%            Insurance Expense              Expected to contribute 70bps
  Full Year 2021 Forecast                                              Full Year 2021 Forecast          to expense growth for the
  10bps below prior year
                                                95.5%
                                                Midpoint                                                          year

  Double Play Internet                  Expected to contribute 30-     Double Play Internet            Expected to contribute 70-
  Full Year 2021 Forecast                                              Full Year 2021 Forecast        80bps to expense growth for
                                       40bps to revenue growth for
                                                the year                                                       the year

  Other Fee/Ancillary Income            Expected to be in the 2.0%     All Other Expenses              Expected to be in the 2.0%
  Full Year 2021 Forecast              growth range on average for     Full Year 2021 Forecast        growth range on average for
                                                the year                                                       the year

                                 Full Year 2021 NOI Growth Range Forecast of 0.0% - 2.0%

                                                                                                                                     6
2021 Citi Virtual Global Property CEO Conference - March 8-11, 2021
2021 Core FFO and Investment Outlook

  EXPECTED CORE FFO/SHARE1                                              CAPITAL INITIATIVES4                                      TRANSACTIONS4/FINANCING

Full Year 20212                $6.30 - $6.60                Smart Home                          $28M - $35M                  Multifamily                       $200M - $250M
                                   $6.45                    Investment                          Capital Spend                Dispositions                           $225M
                                   Midpoint                 20K to 25K units                                                                                         Midpoint
                                                            installed in 2021

Q1 20213                       $1.51 - $1.67                Repositioning                       $28M - $32M                  Multifamily                       $250M - $350M
                                   $1.59                    Program                             Capital Spend                Development                            $300M
                                   Midpoint                 8 new properties                                                 Funding                                 Midpoint
                                                            targeted for 2021;                                               Expect a
                                                            continuation of                                                  combination of
                                                            projects started in                                              wholly-owned and
                                                            2020                                                             pre-purchase JV
                                                                                                                             deals

Total Overhead                $105 - $109M                  Kitchen & Bath                      $42M - $49M                  Unsecured Bond                    $300M - $400M
Midpoint is up                    $107M                     Redevelopment                       Capital Spend                Exploring 5 year to                 2.0% - 3.0%
approximately 8%                   Midpoint                 6K to 7K units in                                                30 year options                   [TIMING: Q3 2021]
from 2020 but less                                          2021
than 3% from                                                                                                                 Equity Issuance                 No equity issuance
original 2020                                                                                                                                              required in current plan
pre-pandemic
expectations

                                                         UPDATE: TEXAS WINTER STORM 2021
   While we expect minimal impact to Core FFO, uninsured costs related to the storm are expected to impact FFO by $1.0 – $2.0 million for Q1 2021.

           1 In this context, per Share means per diluted common share and unit.
           2 Net income per diluted common share is expected to be in the range of $3.26 to $3.56 per diluted common share ($3.41 at the midpoint) for the full year 2021.
           3 MAA does not forecast Net income per diluted common share on a quarterly basis as MAA cannot predict the timing of forecasted acquisition and disposition

             activity within a particular quarter (rather than during the course of the full year).
           4 Expectations for the full year 2021
                                                                                                                                                                                      7
2021 Citi Virtual Global Property CEO Conference - March 8-11, 2021
2021 Operating Update

                                SAME STORE            FULL YEAR 2020   JANUARY 2021   FEBRUARY 2021

                                NEW LEASE
                              AVG Pricing Growth               -2.5%          -2.0%           -1.1%
      EFFECTIVE LEASES

                               Lease Over Lease

                                 RENEWAL
                             AVG Pricing Growth                5.2%           6.4%            7.1%
                              Lease Over Lease

                                 BLENDED
                             AVG Pricing Growth                1.3%           2.2%            2.4%
                              Lease Over Lease

                         Average Physical OCCUPANCY           95.6%          95.4%           95.6%

                                                                                                      8
2021 Citi Virtual Global Property CEO Conference - March 8-11, 2021
High Quality Resident Profile + Affordable Rents = Solid Collections Performance and
Upside Opportunity
 PRIMARY EMPLOYMENT SECTORS FOR EXISTING RESIDENTS

                                                                                                                                                                 Manufacturing
                                                                                                                                  Restaurants/
                                                                                                                                  Food Service
                                                  Professional

                                                                                                                                                                                 Government
                                                                                                                   Technology
                                Healthcare

                                                                                                                                                 Hospitality
                                                                                                   Education
                                                                    Insurance
                                                                    Banking/
                                                                     Finance/
                                                    Services

                                                                                     Retail
 Total Portfolio            13%                   10%                 8%             8%           7%           7%                  5%            4%              4%              4%

 SAME STORE RESIDENT PROFILE IN TOP MARKETS
                       Q4 2020    AVG                                        MEDIAN                                             TOP 5 EMPLOYMENT SECTORS
                                                                  RENT/
                      EFFECTIVE RESIDENT                                    RESIDENT          % SINGLE
                                                                 INCOME
                      RENT/UNIT INCOME                                        AGE                              1                  2              3                 4                 5

 Atlanta, GA           $1,465                $82,212             21.4%          33              82%

 Dallas, TX            $1,297                $76,008             20.5%          32              84%

 Charlotte, NC         $1,239                $69,084             21.5%          33              83%

 Austin, TX            $1,268                $68,436             22.2%          34              80%

 Washington, DC        $1,792                $92,640             23.2%          34              78%                                                            MILITARY

 Tampa, FL             $1,517                $80,544             22.6%          37              80%

 Orlando, FL           $1,452                $77,544             22.5%          37              70%

 Nashville, TN         $1,309                $70,512             22.3%          34              81%

 Raleigh/Durham, NC    $1,151                $64,320             21.5%          34              81%

 Houston, TX           $1,208                $70,596             20.5%          34              83%

                                                                                                                                                                                              9
2021 Citi Virtual Global Property CEO Conference - March 8-11, 2021
Continued Low Resident Turnover

                                                 Resident Turnover and Move Outs Associated with Single Family Housing Remain Low

                                         53.0%                                                                                                                                                                                            25.0%

                                         52.0% 52.2%

                                                                                                                                                                                                                                                  % of Total Move Outs to Rent or Buy Single Family Homes
                                                                                                                                                                                                                              23.0%
                                         51.0%                                                                                                                                                                                            20.0%
   Trailing 12 Month Resident Turnover

                                         50.0% 19.3%

                                         49.0%
                                                                                                                                                                                                                                          15.0%
                                         48.0%

                                         47.0%
                                                                                                                                                                                                                                    10.0%
                                         46.0%                                                                                                                                                                                  46.1%

                                         45.0%
                                                  6.8%
                                         44.0%                                                                                                                                                                                            5.0%

                                         43.0%                                                                                                                                                                                          4.0%

                                         42.0%                                                                                                                                                                                            0.0%
                                                   Q12016

                                                            Q22016

                                                                     Q32016

                                                                              Q42016

                                                                                       Q12017

                                                                                                Q22017

                                                                                                         Q32017

                                                                                                                  Q42017

                                                                                                                           Q12018

                                                                                                                                    Q22018

                                                                                                                                             Q32018

                                                                                                                                                      Q42018

                                                                                                                                                               Q12019

                                                                                                                                                                        Q22019

                                                                                                                                                                                 Q32019

                                                                                                                                                                                          Q42019

                                                                                                                                                                                                   Q12020

                                                                                                                                                                                                            Q22020

                                                                                                                                                                                                                     Q32020

                                                                                                                                                                                                                               Q42020
                                                                      Move Outs to Buy Home                                Move Outs to Rent Home                                12 Month Turnover Rate

                                Move outs to buy a single family home increased some in Q4 but move outs to rent a single family home
                              dropped keeping total move outs due to moving to a home consistent with the historical 25% to 27% range.

                                                                                                                                                                                                                                                                                                            10
Technology Advances Enhance Operations and Add Value

                                                                       Double Play Bulk Internet Roll-out Nears
    Smart Home Technology Roll-out Continues                           Completion
                                                                       High-Speed Internet added to Bulk Cable Program
 20K – 25K installs planned for 2021                                   • Program initiated in the back half of 2019 adds
                                                                          high-speed internet access at discounted price to
                                                                          residents
    2020 and 2021 Roll-out                                             • Opportunity exists for approximately half of the
    • Mobile control of lights, thermostat and security as                Same Store Portfolio
      well as leak monitoring provides additional value to             • Contracts are in place for 92% of all available
      residents                                                           units, with NOI growth contribution of
    • Additional synergy opportunities in repairs and                     approximately 70bps in 2020.
      maintenance, capex, and vacant and house electric                • Projected 2021 benefit of 10-20bps of NOI
      charges                                                             growth
    • Continued enhancement and expansion will
      enhance quality of self touring experience                       Other Programs Recently Completed or
    • Installed approximately 24K units in 2020                        Currently in Review/Testing Phase
    • Approximately $25 per unit additional rent revenue
                                                                        New and Improved Single Operating Platform
                                                                        Improvements to Intranet, Digital Content and
                                                                         Training for Employees
                                                                        Enhanced Online Recruiting Tools
 MOBILE    LIGHTING     SMART       SMART      VOICE           LEAK     Utility Monitoring Enhancements
  APP      CONTROL       LOCK    THERMOSTAT   CONTROL        SENSORS
                                                                        SightPlan – Mobile Inspections for Service
                                                                         Technicians
                                                                        Enhanced Company Website and Data
                                                                         Analysis
                                                                        Artificial Intelligence, Chat, CRM, and Prospect
                                                                         Engagement Tools

                                                                                                                              11
Virtual Leasing Platform Creates Competitive Advantage

                    MAA continues to adopt, develop and deploy innovative solutions to enhance our leasing
                                 efficiency and effectiveness as well as our online presence
                                                                    Personalization strategy focuses on increasing and accelerating online
                                                                    conversions using targeted content as well as making desired content
  Continuous                                                        easier to find                                                                      Online
Search Engine
                                                                                                                                                     Reputation
 Optimization
                                                                                                                                                    Management
enhancements
                                                                                                                                                      increases
help keep MAA
                                                                                                                                                     digital curb
at top of page
                                                                                                                                                   appeal through
                                                                                                                                                   online reviews

 Prominent Call
 to Action                                                                                                                                          Community
 buttons to                                                                                                                                         features, floor
 increase and                                                                                                                                       plans, points of
 accelerate                                                                                                                                         interest and more
 conversions                                                                                                                                        tailored to each
                                                                                                                                                    prospect

Google Analytics
    provides
concrete data for               Adapting our approach as prospects’                                      Online conversion tool guides prospects
                                needs change, multiple tour options                                      throughout their rental journey with an
    strategic                   available including contactless visits                                   interactive and personalized experience
implementations
 on the website

                                   MAA’s Next Generation Platform Expands and Upgrades Leasing Toolbox
                                   •      Objective to create a multi-functional and fully integrated self-service/self-touring leasing platform
                                   •      Technology rollout staggered with careful piloting of complementary platforms
                                   •      Investments expected to aid in driving more leads and higher conversion rates with implications for
                                          personnel expense savings in the long-term
                                                                                                                                                                  12
Unit Interior Upgrades Will Drive Higher Value over Next Two to Three Years

    Property Redevelopment Program                                        Kitchen Update

 ~21K unit upgrades over last 3 years

    OPPORTUNITY                                                                                                              Before
    • Approximately 13K units remaining for
      redevelopment across same store portfolio with
      potential to create additional rent growth value
    SCOPE
    • Redevelopments are performed on turn at select
      communities (properties remain in Same Store
      group), minimizing down time and allowing us to
      continually refine the program for real-time
      improvements
    • Standard program includes kitchen and bath                                                                               After
      upgrades
           • Stainless ENERGY STAR rated appliances                                                          MAA Gateway, Charlotte, NC
           • Counter top replacement
           • Updated cabinetry
           • Water efficient plumbing fixture updates                     Redevelopment Program provides opportunity
           • Energy efficient light fixture updates                                to further green portfolio.
           • Flooring

                                                                           2018A           2019A    2020A              2021F
                                                  Production                8,155          8,329    4,211          6,000-7,000
                   PROGRAM RESULTS                Average Per Unit Cost    $6,138          $5,876   $6,201        $6,500-$7,500
                                                  Average Rent Increase     10.5%          9.8%     9.5%              9%-10%
                                                                                                                                          13
Future Opportunity to Capture

                                                        MAA REDEVELOPMENT PIPELINE
                                             Pipeline of Units Yet to be Redeveloped

   Currently Identified Redevelopment Opportunity                                                Future Value Opportunity
                                                                                                              At 5.0%   Net Value
                                Legacy   Legacy       Legacy    Total                              Revenue
                                                                                                             Cap Rate   Creation
                                 MAA      CLP          PPS      MAA
                                                                                                   $17.3M    $346.0M $264.8M

 13K              Units

                  Capital
                                4,308

                                $19.4M
                                          3,279

                                         $14.8M
                                                      5,714

                                                     $47.0M
                                                               13,301

                                                               $81.2M
   units of
 opportunity      Incremental
                                $4.0M    $3.1M       $10.2M    $17.3M
                  Revenue

   Top 10 2021 Markets For Redevelopment
    Atlanta, GA                      Phoenix, AZ
    Tampa, FL                        Nashville, TN
    Charlotte, NC                    Raleigh/Durham, NC
    Dallas, TX                       Orlando, FL
    Washington, DC                   Charleston, SC                     250 Redeveloped Units

                                                                                                                                    14
Repositioning Select Properties to Drive Additional Value

    Property Repositioning Program
                                                                                    Dramatic
                                                                             Transformations
  8 NEW projects planned for 2021
                                                                                                                                        Before

    Thoughtful Upgrades to Maximize Revenue
    • Program differentiated from kitchen/bath
      redevelopment – includes upgrade of amenities,
      exteriors and common areas to keep pace with
      market demand
    • Candidates evaluated on location, potential for
      rent growth, competition and incoming supply
    • Expected 2021 investment of $30M including
      continued spending on projects started in 2020
      (average 8% cash on cash return)
                                                                                                                                           After

                                                                                                                      MAA Worthington, Dallas, TX

   Updated Leasing Centers                        Conference Areas to Support Remote Work         Exterior Amenities for Today’s Lifestyles

                      MAA Buckhead, Atlanta, GA                      MAA Stratford, Atlanta, GA                         MAA McKinney, Dallas, TX

                                                                                                                                                    15
Development Program Supports Balanced and Diversified Portfolio Strategy

    MIDRISE                            MIDRISE                       MIDRISE                       HIGH RISE

  SUBURBAN                            SUBURBAN                     SUBURBAN                          URBAN

MAA Frisco Bridges II, Dallas, TX   Novel Midtown, Phoenix, AZ   Westglenn, Denver, CO           The Robinson, Orlando, FL

    MIDRISE                         GARDEN STYLE                 GARDEN STYLE                       MIDRISE

 INNER LOOP                           SUBURBAN                     SUBURBAN                        SUBURBAN

Sand Lake, Orlando, FL              Long Point, Houston, TX      MAA Windmill Hill, Austin, TX   Novel Val Vista, Phoenix, AZ

                                                                                                                                16
Development Pipeline and Lease-ups Poised To Deliver Value

  • Established history and success of disciplined capital deployment will govern growth through new development
  • Design and investment managed from an owner/operator perspective; long-term margins optimized
  • Spread between forecasted cost basis and current cap rates supports value accretion of approximately $144M from the current pipeline1

                             ACTIVE DEVELOPMENTS AT 12/31/2020
                                                                                                                                            EXPECTED
                                                                                                  TOTAL           TOTAL EXP COST               INITIAL       EXPECTED
                                                                                                                                                                      2
                              PROPERTY                              MSA                           UNITS             (IN MILLIONS)          OCCUPANCY     STABILIZATION
        6.1%                  MAA Frisco Bridges II                 Dallas, TX                      348                $       69.0            2Q 2020        1Q 2022
     AVERAGE EXPECTED         Novel Midtown3                        Phoenix, AZ                     345                $       82.0            1Q 2021        4Q 2022
    STABILIZED NOI YIELD
                              Westglenn                             Denver, CO                      306                $       84.5            2Q 2021        4Q 2022
                              The Robinson                          Orlando, FL                     369                $       99.0            2Q 2021        1Q 2023
$36M - $37M                   Sand Lake4                            Orlando, FL                     264                $       68.0            2Q 2021        1Q 2023
 TOTAL EXPECTED STABILIZED
     INCREMENTAL NOI
                              Long Point                            Houston, TX                     308                $       57.0            3Q 2021        1Q 2023
                              MAA Windmill Hill                     Austin, TX                      350                $       63.0            1Q 2022        4Q 2023
                              Novel Val Vista3                      Phoenix, AZ                     317                $       72.5            3Q 2022        2Q 2024
                              TOTAL ACTIVE DEVELOPMENTS                                           2,607                $      595.0

         7.0%                 ACTIVE LEASE-UPS AT 12/31/2020
    STABILIZED NOI YIELD
                                                                                                  TOTAL               TOTAL COST             PHYSICAL        EXPECTED
                                                                                                                                                                      2
                               PROPERTY                               MSA                         UNITS             (IN MILLIONS)          OCCUPANCY     STABILIZATION
$1.5M - $2.0M
 TOTAL EXPECTED STABILIZED     Copper Ridge II                        Fort Worth, TX                 168              $       26.3               79.8%        2Q 2021
     INCREMENTAL NOI

                             Source: Company 4Q 2020 Earnings Release Supplemental
                             1 Based on 5.0% Cap Rate; includes 4Q 2020 development and lease-up pipeline
                             2 Communities are considered stabilized after achieving 90% occupancy for 90 days
                             3 MAA owns 80% of the joint venture that owns this property with a right to purchase the remainder after stabilization
                             4 MAA owns 95% of the joint venture that owns this property with a right to purchase the remainder after stabilization

                                                                                                                                                                          17
Strong Balance Sheet and Manageable Debt Maturity Profile

      CREDIT METRICS AT 12/31/2020
                                                                                                                                                MAA               SECTOR AVG2,3
     Total debt / adjusted total assets1                                                                                                       31.2%                      33.1%
     Total secured debt / adjusted total             assets1                                                                                    3.3%                      4.7%
     Unencumbered NOI / total NOI                                                                                                              93.4%                      92.8%
     Net Debt / Adjusted EBITDAre4                                                                                                             4.81x3                     5.65x
     Consolidated income available for debt service to total annual debt service                        charge1,2                               5.40x                     5.40x
     Weighted average maturity of debt (in years)                                                                                                7.4                       8.6

     1 MAA  calculations as specifically defined in Mid-America Apartments, L.P.’s debt agreements.
     2 Sector average represents publicly disclosed sector equivalent.
     3 Sector constituents include AVB, CPT, EQR, ESS and UDR; data is from 4Q 2020 company filings
     4 Adjusted EBITDAre in this calculation represents the trailing twelve month period ended December 31, 2020. A reconciliation of the following items and an expanded discussion of

     their respective components can be found in the accompanying appendix: (i) EBITDA, EBITDAre and Adjusted EBITDAre to Net income; and (ii) Net Debt to Unsecured notes payable and
     Secured notes payable.

      DEBT MATURITY PROFILE ($ IN MILLIONS) AT 12/31/2020
                                                                                             1
       Weighted Average             3.6%                                                Debt         Revolving Credit Facility & Commercial Paper
       Interest Rate

       Weighted Average             7.4 years
       Maturity

                          $172.0
                          $191.5          $366.1         $360.4          $417.2         $403.0                      $595.0        $395.5         $561.7          $296.9          $803.4

                           2021            2022           2023           2024            2025           2026         2027          2028             2029          2030           2031+

% MATURING                 8.0%            8.0%           7.9%            9.1%          8.8%             0%         13.1%         8.7%           12.3%           6.5%            17.6%

             1 Debt   excluding unsecured revolving credit facility and unsecured commercial paper program.

                                                                                                                                                                                          18
Solid Investment Grade Balance Sheet

                                 Preferred                                                                    DEBT SUMMARY ($ IN MILLIONS)
                                   Stock
                                   0.2%              Secured Debt                                                                              AT 12/31/2020
                                                        2.5%

  $13.7B                                                                      $4.6B             Unsecured Public Bonds                                 $3,683.6            80.7%
 Common                                                                    Total Debt +
  Equity                                                                    Preferred           Unsecured Private Bonds                                     221.8            4.9%

                                                        Unsecured                               Commercial Paper                                            172.0            3.8%
                                                           Debt
                                                          20.8%
                                                                                                Total Unsecured Debt1                                   $4,077.4           89.4%

                                                                                                Total Secured Debt                                        $485.3           10.6%

                          Common                                                                  TOTAL DEBT                                           $4,562.7
                           Equity
                           76.5%

                                                                                                                                      SHORT TERM LONG TERM            OUTLOOK

                                                                                                                  Standard & Poor’s
                                                                                                                                         A-2 BBB+

                                                                                                   RATINGS
                                                                                                                                                                     STABLE

                                                                                                   CREDIT
                                                                                                                  Ratings Services2

                                                                                                                  Moody’s Investors
                                                                                                                     Service3            P-2 Baa1                    STABLE
   DEBT + PREFERRED/TOTAL CAPITALIZATION: 23.5%                                                                     Fitch Ratings2
                                                                                                                                          F2         BBB+            STABLE

 Note: Total Capitalization is defined here as common shares and units outstanding multiplied   1 At12/31/2020, there was no outstanding balance on the revolving credit facility.
 by the closing stock price on 12/31/2020, plus total debt outstanding at 12/31/2020, plus      2 Corporate credit rating assigned to MAA and MAALP
 Preferred stock ($50 redeemable stock price multiplied by total shares outstanding).           3 Corporate credit rating assigned to MAALP, the operating partnership of MAA

                                                                                                                                                                                     19
A Brighter View for Today and Tomorrow: MAA’s Commitment to Sustainability

  As part of our ongoing mission to provide                                    SETTING MEASURABLE TARGETS
  exceptional service and superior value to our
                                                                                           2018 – 2028
  stakeholders, we are committed to the
                                                                                        REDUCTION GOALS
  responsible stewardship of our resources and
  the enhancement of programs that support our                 ENERGY USE                GREEN HOUSE GAS                WATER USE
  environmental, social and governance practices.               INTENSITY                   INTENSITY                   INTENSITY
  We demonstrate this commitment by

                                                                  15%                         15%                         10%
     IMPROVING DISCLOSURES
                  ENVIRONMENTAL        SOCIAL       GOVERNANCE          SCALE RANGE
  ISS                                                                   1: LOW RISK
  QUALITY SCORE         4                3               1              10: HIGH RISK           IMPLEMENTING PROGRAMS
                                                                                              FOCUSED ON THE ENVIRONMENT
2020 Achievements Public GRESB Assessment | Corporate Responsibility Report               • LED lighting retrofits in interior and exterior
                                                                                            common areas
                                                                                          • Incorporating energy and water efficient
                            35% Improvement                                                 options in redevelopment program
                                                                                          • Routine unit maintenance and audits
                             over Prior Year                                              • ENERGY STAR appliances on replacements
                                                                                          • Smart Home technology roll-out throughout
                                                                                            portfolio
  GRESB SCORE       MANAGEMENT        PERFORMANCE                                         • Smart irrigation controls and monitoring
   GREEN STAR         SCORE              SCORE                                            • Landscapes with drought tolerant plantings
                                                                                            and turf reduction through xeriscaping
                                                                                          • Real time water use monitoring at sub-metered
                                                                                            communities
       67               30                   38                                           • ENERGY STAR benchmarking and certifications
      100               30                   70                                           • Green Building Certification for all new
                                                                                            developments
                                                                                          • Community and office recycling programs
                                                       Available on “For Investors”
                                                         page at www.maac.com                   15 Green Building Certifications              20
                                                                                                        NGBS/LEED Achieved
A Brighter View for Today and Tomorrow: MAA’s Commitment to Sustainability

 SUPPORTING OUR ASSOCIATES’ WELL--BEING                                  CARING FOR OUR BROADER COMMUNITY
  HEALTH & WELLNESS Comprehensive Medical,
  Dental and Vision Insurance; Flexible Spending                           Open Arms now in its 26th year continues its
  Accounts; Employee Assistance Program                                    mission to provide fully-furnished apartment
  FINANCIAL WELL-BEING Competitive Pay;                                    homes in MAA’s existing communities to
  Incentive Bonuses; 401(k) Savings Plan with Company
  Match; Rent Discount
                                                                           individuals and families who must travel for
  CAREER DEVELOPMENT Ongoing Education and
                                                                           critical medical treatment.
  Training opportunities; Tuition & Certification
  Reimbursement; Career Mentor Program; Leadership
  Development                                                                                                    53 homes in 13 states
  BELONGING Strong Company Culture; Robust
  Communication & Recognition Programs; Inclusive
  Diversity Council; Associate Surveys; Disaster Relief                                                          Over 3,000 families
  Program
                                                                                                                 helped

                                                                                                                 Over 250,000 nights of
  FOCUSING ON DIVERSITY AND INCLUSION                                                                            rest provided

                                                                                                                 Approximately $308K
• Inclusive Diversity Council                                                                                    raised by employees
• Unconscious Bias Training for Leaders                                                                          in 2020 (despite
• Required Annual Training on Harassment                                                                         pandemic)
  and Discrimination for all Associates
• Culture Committee
                                                                         • Responsive service program and routine surveys
                                                                         • Online resident portal for ease of transactions, service
                                                         ELEVATING THE     request submission and communication
                                                   RESIDENT EXPERIENCE   • Property amenities to promote healthy lifestyles
                                                                         • Ongoing resident engagement and events                        21
Performance for Shareholders

         FOR                                Steady Core FFO growth
                                            Top tier long-term total shareholder returns versus multifamily peers
SHAREHOLDERS                                Strong dividend track record; steady growth, well covered

Steady Core FFO Growth                                                                                              Annual Compounded Total Shareholder Return
                                                                                                                    At February 28, 2021
$6.60                                                                                  $6.45
$6.40                                                                                                                                     1 YR          3 YR          5 YR         10 YR          15 YR          20 YR
$6.20                                                                                                               MAA                   7.8%         20.3%         12.2%         11.7%          10.8%          15.2%
$6.00                                                                                                               PEER AVG1            -5.5%         9.6%          6.8%          8.8%           8.1%           11.4%
$5.80
                                                                                                                    SOURCE: S&P Global
$5.60                                                                                                               1 Peer average includes multifamily peers: AVB, CPT, EQR, ESS and UDR
          2016          2017          2018            2019           2020              2021F
                                         Core FFO/Share

                                                                          Annual Common Dividends Paid
                                                                                A solid record of growth and stability
        $4.50                                                                                                                                                                                             $4.10
        $4.00
        $3.50
        $3.00
        $2.50
        $2.00
        $1.50
        $1.00
        $0.50
          $-

                                                                                                                                                                                                               2021F
                 1994

                        1995

                               1996

                                      1997

                                             1998

                                                    1999

                                                           2000

                                                                  2001

                                                                         2002

                                                                                2003

                                                                                        2004

                                                                                               2005

                                                                                                      2006

                                                                                                             2007

                                                                                                                    2008

                                                                                                                           2009

                                                                                                                                  2010

                                                                                                                                         2011

                                                                                                                                                2012

                                                                                                                                                       2013

                                                                                                                                                              2014

                                                                                                                                                                     2015

                                                                                                                                                                            2016

                                                                                                                                                                                   2017

                                                                                                                                                                                          2018

                                                                                                                                                                                                 2019

                                                                                                                                                                                                        2020
                                                                                                                                                                                                                         22
•   Reconciliation of Non-GAAP Financial Measures
 APPENDIX              •   Definitions of Non-GAAP Financial Measures and Other Key
                           Terms

At December 31, 2020

                                                                                      23
Reconciliation of Non-GAAP Financial Measures

 RECONCILIATION OF FFO, CORE FFO, CORE AFFO AND FAD TO NET INCOME AVAILABLE FOR MAA COMMON SHAREHOLDERS
Amounts in thousands, except per share and unit data                                                             Three months ended December 31,                          Year ended December 31,
                                                                                                                  2020                   2019                           2020                  2019
Net income available for MAA common shareholders                                                          $             82,420       $           148,667        $         251,274        $          350,123
    Depreciation and amortization of real estate assets                                                               127,934                    123,928                  504,364                   490,632
    Gain on sale of depreciable real estate assets                                                                           (16)                 (80,001)                         (9)               (80,988)
    Depreciation and amortization of real estate assets of real estate joint venture                                        154                        153                      612                       618
    Net income attributable to noncontrolling interests                                                                   2,957                      5,471                    9,053                   12,807
Funds from operations attributable to the Company                                                                     213,449                    198,218                  765,294                   773,192
    (Income) loss on embedded derivative in preferred shares (1)                                                       (17,165)                      1,706                   (2,562)                 (17,886)
    Gain on sale of non-depreciable real estate assets                                                                       (29)                   (2,787)                  (1,024)                 (12,047)
    (Gain) loss from unconsolidated limited partnerships, net of tax (1)(2)                                                (672)                       215                   (4,757)                   (2,954)
    Net casualty (gain) loss and other settlement proceeds (1)                                                             (723)                    (1,491)                     484                    (3,390)
    Loss on debt extinguishment (1)                                                                                            —                       193                      344                       253
    Non-routine legal costs and settlements (1)                                                                              (78)                         —                      (38)                   2,276
    COVID-19 related costs (1)                                                                                              553                           —                   3,536                         —
    Mark-to-market debt adjustment (3)                                                                                        83                        (34)                      75                     (256)
Core funds from operations                                                                                            195,418                    196,020                  761,352                   739,188
    Recurring capital expenditures                                                                                     (21,008)                   (14,320)                 (80,420)                  (72,781)
Core adjusted funds from operations                                                                                   174,410                    181,700                  680,932                   666,407
    Redevelopment capital expenditures                                                                                 (41,078)                   (13,139)                 (76,728)                  (58,199)
    Revenue enhancing capital expenditures                                                                             (15,019)                     (6,804)                (39,529)                  (32,871)
    Commercial capital expenditures                                                                                      (1,174)                    (2,056)                  (3,477)                   (7,075)
    Other capital expenditures                                                                                           (8,287)                    (5,785)                (25,352)                  (19,280)
Funds available for distribution                                                                          $           108,852        $           153,916        $         535,846        $          548,982

Dividends and distributions paid                                                                          $           118,622        $           113,630        $         473,598        $          453,682

Weighted average common shares - diluted                                                                              114,535                    114,309                  114,500                   114,113
FFO weighted average common shares and units - diluted                                                                118,437                    118,214                  118,409                   118,127

Earnings per common share - diluted:
Net income available for common shareholders                                                              $                0.72      $                1.30      $              2.19      $              3.07

Funds from operations per Share - diluted                                                                 $                1.80      $                1.68      $              6.46      $              6.55
Core funds from operations per Share - diluted                                                            $                1.65      $                1.66      $              6.43      $              6.26
Core adjusted funds from operations per Share - diluted                                                   $                1.47      $                1.54      $              5.75      $              5.64

             (1) Included in Other non-operating (income) expense in the Consolidated Statements of Operations.
             (2) For the year ended December 31, 2020, $5.6 million of gains from unconsolidated limited partnerships are offset by $0.8 million of income tax expense as compared to $3.9 million of gains from
             unconsolidated limited partnerships offset by $0.9 million of income tax expense for the year ended December 31, 2019.
             (3) Included in Interest expense in the Consolidated Statements of Operations.                                                                                                                        24
Reconciliation of Non-GAAP Financial Measures

RECONCILIATION OF NET OPERATING INCOME TO NET INCOME AVAILABLE FOR MAA COMMON SHAREHOLDERS
Dollars in thousands                                                            Three Months Ended                                      Year Ended
                                                             December 31,          September 30,          December 31,       December 31,        December 31,
                                                                2020                   2020                  2019               2020                2019
Net Operating Income
   Same Store NOI                                        $         248,628      $        238,702      $         250,974 $          979,330 $           968,190
   Non-Same Store and Other NOI                                      15,019                14,683                 16,056            58,183               59,982
Total NOI                                                          263,647               253,385                267,030          1,037,513           1,028,172
   Depreciation and amortization                                  (129,585)             (127,679)              (125,426)          (510,842)           (496,843)
   Property management expenses                                     (13,236)              (12,691)               (13,816)          (52,300 )           (55,011 )
   General and administrative expenses                             (11,677)               (11,360)               (10,885)          (46,858 )           (43,845 )
   Interest expense                                                 (40,952)              (41,010)               (43,698)         (167,562)           (179,847)
   Gain on sale of depreciable real estate assets                         16                    20                80,001                  9              80,988
   Gain on sale of non-depreciable real estate assets                     29                 1,366                  2,787             1,024              12,047
   Other non-operating income (expense)                              18,504                    242                   (495)            4,857              22,999
   Income tax expense                                                   (795)                 (665)                  (882)           (3,327 )             (3,696 )
   Income from real estate joint venture                                 348                   428                    444             1,501                1,654
   Net income attributable to noncontrolling interests                (2,957)               (2,126)                (5,471)           (9,053 )           (12,807 )
   Dividends to MAA Series I preferred shareholders                     (922)                 (922)                  (922)           (3,688 )             (3,688 )
Net income available for MAA common shareholders         $           82,420     $          58,988     $         148,667 $          251,274 $           350,123

                                                                                                                                                                     25
Reconciliation of Non-GAAP Financial Measures

RECONCILIATION OF EBITDA, EBITDAre AND ADJUSTED EBITDAre TO NET INCOME
Dollars in thousands                                                                                    Three Months Ended                                    Year Ended

                                                                                           December 31, 2020         December 31, 2019        December 31, 2020       December 31, 2019
Net income                                                                                 $           86,299       $          155,060       $          264,015       $         366,618
   Depreciation and amortization                                                                      129,585                  125,426                  510,842                 496,843
   Interest expense                                                                                    40,952                    43,698                 167,562                 179,847
   Income tax expense                                                                                     795                       882                   3,327                    3,696
EBITDA                                                                                                257,631                  325,066                  945,746               1,047,004
   Gain on sale of depreciable real estate assets                                                          (16 )                (80,001 )                     (9 )               (80,988)
   Adjustments to reflect the Company’s share of EBITDAre of unconsolidated
   affiliates                                                                                              339                      336                    1,349                     1,351
EBITDAre                                                                                              257,954                  245,401                  947,086                  967,367
   (Gain) loss on embedded derivative in preferred shares (1)                                          (17,165 )                  1,706                   (2,562 )                (17,886)
   Gain on sale of non-depreciable real estate assets                                                       (29 )                (2,787 )                 (1,024 )                (12,047)
   (Gain) loss from unconsolidated limited partnerships, net of tax (1)(2)                                (672 )                    215                   (4,757 )                  (2,954)
   Net casualty (gain) loss and other settlement proceeds (1)                                             (723 )                 (1,491 )                    484                    (3,390)
   Loss on debt extinguishment (1)                                                                            —                     193                      344                       253
   Non-routine legal costs and settlements (1)                                                              (78 )                      —                      (38 )                  2,276
   COVID-19 related costs (1)                                                                              553                         —                   3,536                         —
   Mark-to-market debt adjustment (3)                                                                        83                      (34 )                     75                     (256)
Adjusted EBITDAre                                                                          $          239,923       $          243,203       $          943,144       $          933,363

 (1)    Included in Other non-operating (income) expense in the Consolidated Statements of Operations.
 (2)    For the year ended December 31, 2020, $5.6 million of gains from unconsolidated limited partnerships are offset by $0.8 million of income tax expense as compared to $3.9 million
        of gains from unconsolidated limited partnerships offset by $0.9 million of income tax expense for the year ended December 31, 2019.
 (3)    Included in Interest expense in the Consolidated Statements of Operations.

                                                                                                                                                                                              26
Reconciliation of Non-GAAP Financial Measures

RECONCILIATION OF NET DEBT TO UNSECURED NOTES PAYABLE AND SECURED NOTES PAYABLE
Dollars in thousands
                                                                                  December 31, 2020                 December 31, 2019
Unsecured notes payable                                                     $                 4,077,373     $                   3,828,201
Secured notes payable                                                                           485,339                           626,397
Total debt                                                                                    4,562,712                         4,454,598
   Cash and cash equivalents                                                                     (25,198)                          (20,476)
   1031(b) exchange proceeds included in Restricted cash (1)                                           —                           (33,843)
Net Debt                                                                    $                 4,537,514     $                   4,400,279

 (1)   Included in Restricted cash in the Consolidated Balance Sheets.

RECONCILIATION OF GROSS ASSETS TO TOTAL ASSETS
Dollars in thousands
                                                                                   December 31, 2020                 December 31, 2019
Total assets                                                                 $                11,194,791        $               11,230,450
   Accumulated depreciation                                                                    3,415,105                         2,955,253
Gross Assets                                                                 $                14,609,896        $               14,185,703

RECONCILIATION OF GROSS REAL ESTATE ASSETS TO REAL ESTATE ASSETS, NET

Dollars in thousands
                                                                                  December 31, 2020                 December 31, 2019
Real estate assets, net                                                     $               10,967,115      $                 10,987,128
   Accumulated depreciation                                                                  3,415,105                         2,955,253
   Cash and cash equivalents                                                                    25,198                            20,476
   1031(b) exchange proceeds included in Restricted cash (1)                                         —                            33,843
Gross Real Estate Assets                                                    $               14,407,418      $                 13,996,700

 (1)   Included in Restricted cash in the Consolidated Balance Sheets.

                                                                                                                                              27
Reconciliation of Non-GAAP Financial Measures

  RECONCILIATION OF NET INCOME PER DILUTED COMMON SHARE TO CORE FFO AND CORE AFFO PER SHARE FOR 2021 GUIDANCE

                                                                                                                     2021 Full Year Guidance Range
                                                                                                          Low                                                High
Earnings per common share - diluted                                                    $                                     3.26        $                                        3.56
Real estate depreciation and amortization                                                                                    4.35                                                 4.35
Gains on sale of depreciable assets                                                                                         (1.34)                                               (1.34)
   FFO per Share - diluted                                                                                                   6.27                                                 6.57
Non-Core items (1)                                                                                                           0.03                                                 0.03
   Core FFO per Share - diluted                                                                                              6.30                                                 6.60
Recurring capital expenditures                                                                                              (0.68)                                               (0.68)
   Core AFFO per Share - diluted                                                       $                                     5.62        $                                        5.92

 (1)
   Non-Core items may include adjustments related to the fair value of the embedded derivative in the MAA Series I preferred shares, gain or loss on sale of non-depreciable
 assets, adjustments for gains or losses from unconsolidated limited partnerships, net casualty gain or loss, gain or loss on debt extinguishment, non-routine legal costs and
 settlements, COVID-19 related costs, and mark-to-market debt adjustments.

                                                                                                                                                                                          28
Definitions of Non-GAAP Financial Measures

Adjusted EBITDAre
For purposes of calculations in this release, Adjusted Earnings Before Interest, Income Taxes, Depreciation and Amortization for real estate, or Adjusted EBITDAre, represents
EBITDAre further adjusted for items that are not considered part of MAA’s core operations such as adjustments related to the fair value of the embedded derivative in the MAA
Series I preferred shares, gain or loss on sale of non-depreciable assets, adjustments for gains or losses from unconsolidated limited partnerships, net casualty gain or loss,
gain or loss on debt extinguishment, non-routine legal costs and settlements, COVID-19 related costs and mark-to-market debt adjustments. As an owner and operator of real
estate, MAA considers Adjusted EBITDAre to be an important measure of performance from core operations because Adjusted EBITDAre does not include various income and
expense items that are not indicative of operating performance. MAA’s computation of Adjusted EBITDAre may differ from the methodology utilized by other companies to
calculate Adjusted EBITDAre. Adjusted EBITDAre should not be considered as an alternative to Net income as an indicator of operating performance.
Core Adjusted Funds from Operations (Core AFFO)
Core AFFO is composed of Core FFO less recurring capital expenditures. Core AFFO should not be considered as an alternative to Net income available for MAA common
shareholders as an indicator of operating performance. As an owner and operator of real estate, MAA considers Core AFFO to be an important measure of performance from
operations because Core AFFO measures the ability to control revenues, expenses and recurring capital expenditures.
Core Funds from Operations (Core FFO)
Core FFO represents FFO as adjusted for items that are not considered part of MAA’s core business operations such as adjustments related to the fair value of the embedded
derivative in the MAA Series I preferred shares, gain or loss on sale of non-depreciable assets, adjustments for gains or losses from unconsolidated limited partnerships, net
casualty gain or loss, gain or loss on debt extinguishment, non-routine legal costs and settlements, COVID-19 related costs and mark-to-market debt adjustments. While MAA's
definition of Core FFO may be similar to others in the industry, MAA’s methodology for calculating Core FFO may differ from that utilized by other REITs and, accordingly, may
not be comparable to such other REITs. Core FFO should not be considered as an alternative to Net income available for MAA common shareholders as an indicator of
operating performance. MAA believes that Core FFO is helpful in understanding its core operating performance between periods in that it removes certain items that by their
nature are not comparable over periods and therefore tend to obscure actual operating performance.
EBITDA
For purposes of calculations in this release, Earnings Before Interest, Income Taxes, Depreciation and Amortization, or EBITDA, is composed of net income plus depreciation
and amortization, interest expense, and income taxes. As an owner and operator of real estate, MAA considers EBITDA to be an important measure of performance from core
operations because EBITDA does not include various expense items that are not indicative of operating performance. EBITDA should not be considered as an alternative to Net
income as an indicator of operating performance.
EBITDAre
For purposes of calculations in this release, Earnings Before Interest, Income Taxes, Depreciation and Amortization for real estate, or EBITDAre, is composed of EBITDA further
adjusted for the gain or loss on sale of depreciable asset sales and plus adjustments to reflect MAA’s share of EBITDAre of unconsolidated affiliates. As an owner and operator
of real estate, MAA considers EBITDAre to be an important measure of performance from core operations because EBITDAre does not include various expense items that are
not indicative of operating performance. While MAA’s definition of EBITDAre is in accordance with NAREIT’s definition, it may differ from the methodology utilized by other
companies to calculate EBITDAre. EBITDAre should not be considered as an alternative to Net income as an indicator of operating performance.
Funds Available for Distribution (FAD)
FAD is composed of Core FFO less total capital expenditures, excluding development spending and property acquisitions. FAD should not be considered as an alternative to
Net income available for MAA common shareholders as an indicator of operating performance. As an owner and operator of real estate, MAA considers FAD to be an important
measure of performance from core operations because FAD measures the ability to control revenues, expenses and total capital expenditures.

                                                                                                                                                                                  29
Definitions of Non-GAAP Financial Measures

Funds From Operations (FFO)
FFO represents net income available for MAA common shareholders (calculated in accordance with GAAP) excluding gains or losses on disposition of operating properties and
asset impairment, plus depreciation and amortization of real estate assets, net income attributable to noncontrolling interests, and adjustments for joint ventures. Because
net income attributable to noncontrolling interests is added back, FFO, when used in this document, represents FFO attributable to the Company. While MAA’s definition of
FFO is in accordance with NAREIT’s definition, it may differ from the methodology for calculating FFO utilized by other companies and, accordingly, may not be comparable to
such other companies. FFO should not be considered as an alternative to Net income available for MAA common shareholders as an indicator of operating performance. MAA
believes that FFO is helpful in understanding operating performance in that FFO excludes depreciation and amortization of real estate assets. MAA believes that GAAP
historical cost depreciation of real estate assets is generally not correlated with changes in the value of those assets, whose value does not diminish predictably over time, as
historical cost depreciation implies.
Gross Assets
Gross Assets represents Total assets plus Accumulated depreciation. MAA believes that Gross Assets can be used as a helpful tool in evaluating its balance sheet positions.
MAA believes that GAAP historical cost depreciation of real estate assets is generally not correlated with changes in the value of those assets, whose value does not diminish
predictably over time, as historical cost depreciation implies.
Gross Real Estate Assets
Gross Real Estate Assets represents Real estate assets, net plus Accumulated depreciation and Cash and cash equivalents. MAA believes that Gross Real Estate Assets can
be used as a helpful tool in evaluating its balance sheet positions. MAA believes that GAAP historical cost depreciation of real estate assets is generally not correlated with
changes in the value of those assets, whose value does not diminish predictably over time, as historical cost depreciation implies.
Net Debt
Net Debt represents Unsecured notes payable and Secured notes payable less Cash and cash equivalents. MAA believes Net Debt is a helpful tool in evaluating its debt
position.
Net Operating Income (NOI)
Net Operating Income represents Rental and other property revenues less Total property operating expenses, excluding depreciation and amortization, for all properties held
during the period, regardless of their status as held for sale. NOI should not be considered as an alternative to Net income available for MAA common shareholders. MAA
believes NOI by market is a helpful tool in evaluating the operating performance within MAA’s markets because it measures the core operations of property performance by
excluding corporate level expenses and other items not related to property operating performance.
Same Store NOI
Same Store NOI represents Rental and other property revenues less Total property operating expenses, excluding depreciation and amortization, for all properties classified
within the Same Store Portfolio during the period. Same Store NOI should not be considered as an alternative to Net income available for MAA common shareholders. MAA
believes Same Store NOI is a helpful tool in evaluating the operating performance within MAA's markets because it measures the core operations of property performance by
excluding corporate level expenses and other items not related to property operating performance.
Non-Same Store and Other NOI
Non-Same Store and Other NOI represents Rental and other property revenues less Total property operating expenses, excluding depreciation and amortization, for all
properties classified within the Non-Same Store and Other Portfolio during the period. Non-Same Store and Other NOI should not be considered as an alternative to Net income
available for MAA common shareholders. MAA believes Non-Same Store and Other NOI is a helpful tool in evaluating the operating performance within MAA’s markets because
it measures the core operations of property performance by excluding corporate level expenses and other items not related to property operating performance.

                                                                                                                                                                                  30
Definitions of Other Key Terms

Average Effective Rent per Unit
Average Effective Rent per Unit represents the average of gross rent amounts after the effect of leasing concessions for occupied units plus prevalent market rates asked for
unoccupied units, divided by the total number of units. Leasing concessions represent discounts to the current market rate. MAA believes average effective rent is a helpful
measurement in evaluating average pricing. It does not represent actual rental revenue collected per unit.
Average Physical Occupancy
Average Physical Occupancy represents the average of the daily physical occupancy for the respective period.
Development Communities
Communities remain identified as development until certificates of occupancy are obtained for all units under development. Once all units are delivered and available for
occupancy, the community moves into the Lease-up Communities portfolio.
Lease-up Communities
New acquisitions acquired during lease-up and newly developed communities remain in the Lease-up Communities portfolio until stabilized. Communities are considered
stabilized after achieving at least 90% occupancy for 90 days.
Non-Same Store and Other Portfolio
Non-Same Store and Other Portfolio includes recently acquired communities, communities in development or lease-up, communities that have been identified for disposition,
communities that have undergone a significant casualty loss, stabilized communities that do not meet the requirements defined by the Same Store Portfolio, retail properties
and commercial properties.
Same Store Portfolio
MAA reviews its Same Store Portfolio at the beginning of each calendar year, or as significant transactions or events warrant. Communities are generally added into the Same
Store Portfolio if they were owned and stabilized at the beginning of the previous year. Communities are considered stabilized after achieving at least 90% occupancy for 90
days. Communities that have been approved by MAA’s Board of Directors for disposition are excluded from the Same Store Portfolio. Communities that have undergone a
significant casualty loss are also excluded from the Same Store Portfolio.
Unencumbered NOI
Unencumbered NOI represents NOI generated by unencumbered assets (as defined in MAALP’s bond covenants).

                                                                                                                                                                                31
You can also read