Consumer income growth and rhino poaching in South Africa
←
→
Page content transcription
If your browser does not render page correctly, please read the page content below
Environmental Economics, Volume 5, Issue 3, 2014

Collins C. Ngwakwe (South Africa), Nehemia M. Mokgalong (South Africa)

Consumer income growth and rhino poaching in South Africa
Abstract
There is growing research in the market analyses of rhino poaching and the concomitant illicit trading; this paper
adopts a slightly different approach to market dimension by examining the possible relationship between the income
rise in Asian rhino horn customer countries and rhino poaching in South Africa. The paper combines a review approach
with data analysis using the multiple regression statistics. Findings from the regression coefficients suggest that the rise
in the income of Asian rhino horn purchaser countries has a positive significant relationship with the rise in rhino
poaching in South Africa. The findings thus are significant for conservation policy management and research; in addi-
tion to local law enforcement, a greater joint international rhino trading pact is desirable between South Africa and the
rhino horn Asian consumer countries. Literature findings indicate that regulation alone has not, and cannot, achieve
desired rhino conservation; thus the paper suggests, inter alia, the need for a tighter immigration control on hunting
permits to rhino horn consumer Asian countries. Additionally, given that rising income in Asia tends to spur a demand
for rhino horn, the South African government may pursue a joint moral persuasion strategy on the Asian consumers to
reduce the demand for rhino horn. Furthermore, given the relationship found between unemployment and rhino poach-
ing in this analysis, the paper recommends that government needs to consider the creation of a better opportunity cost
of poaching by initiating competitive income earning opportunities around the rhino habitat communities – this could
be done by encouraging and supporting (with competitive financial incentives) rhino farming by communities and
individuals around the rhino habitat in South Africa.
Keywords: rhino, consumer income, poaching, wildlife, conservation, income growth, South Africa.
JEL Classification: M14, M21, Q20, Q21.
Introduction     ©                                             and 2013, a total of 2778 rhinos have been poached
                                                               and killed in South Africa. In 2013, 1004 rhinos
According to the International Union for Conserva-
                                                               were poached and 343 poachers were arrested; 668
tion of Nature (IUCN), South Africa is the source of
                                                               were poached in 2012 and 448 poached in 2011
many of the rhino horns that escape from Africa
                                                               (Department of Environmental Affairs South Africa,
through illicit rhino horn trading (IUCN, 2009). In
                                                               2014). This thus shows that the rhino population in
recent times, there has been a noticeable upsurge in
                                                               South Africa is critically endangered and vulnerable
rhino poaching globally, but particularly in South
                                                               to poaching.
Africa which is home to the greater population of
world rhino (Global Issues, 2014). Experts lament              It is apparent thus, that as global and national cam-
that the rising surge in rhino poaching seems to defy          paigns against illicit killing, poaching and trade on
trade bans, regulations and enforcements globally              rhino horn continue to gather increasing momentum,
and nationally (Challender and MacMillan, 2014;                more poaching and illegal trade in rhino horn take
Biggs et al., 2013). For instance, poaching in Kenya           place (Challender and Macmillan, 2014). Many
overwhelmed all government efforts including well-             current researches have looked at various dimension
armed anti-poaching squads and a ban on rhino horn             of rhino poaching, but of particular interest are those
trading, but poaching in Kenya continued to an                 looking at the causes that sustain rhino poaching and
alarming level that reduced the number of rhinos in            selling: such as corruption, civil strife, poverty, eco-
Kenya from 20,000 in 1975 to only 500 in 1990                  nomic and social drivers, unemployment, ignorance
(Warchol et al., 2003). South Africa appears to be             of conservation or ecology values or regulations
on the same unfortunate trajectory as alarming                 (Milner-Gulland & Leader-Williams, 1992; Dudley
poaching is ubiquitous in South Africa despite huge            et al., 2002; Smith & Walpole, 2005; Mancini et al.,
government commitment in fighting rhino poaching               2011; Raichev and Georgiev, 2012; Lopes, 2014;
using regulations, anti-poaching squads, and recent-           von Essen et al., 2014 ). The closest research so far
ly, backed by well-equipped military assistance. Yet           to the focus of this current research is that of Chal-
in South Africa rhinos are frequently killed just to           lender and Macmillan (2014) which considered both
get the horns, leaving the giant animal to suffer to           the economic growth and demand implications on
death; accordingly rhinos have become critically               rhino poaching. This research does not intend to
endangered (Global Issues, 2014). Official data                replicate these earlier ones, but attempts to look
from the Department of Environmental Affairs                   further into another angle of economic and/or mar-
South Africa (2014, p. 1) indicate that between 2008           ket causes of rhino poaching – the possible relation-
                                                               ship between the rise in the income of the rhino horn
                                                               consumer Asian countries and rhino poaching in
© Collins C. Ngwakwe, Nehemia M. Mokgalong, 2014.              South Africa. This is apposite, as none of the pre-
42
Environmental Economics, Volume 5, Issue 3, 2014
vious researches had looked closely at this relation- stems from the fact that regulations and enforce-
ship within the South African context. According to ments have not yet proved to be very effective and
the IUCN (2009, p. 1) “Rhino poaching worldwide thus the singular panacea for curbing illicit trade in
is poised to hit a 15-year high driven by Asian de- rhino parts (Conrad, 2012), and the concomitant
mand for horns, according to new research related poaching – mostly in South Africa has not solved
literature”; thus attempting to link the Asian market the problem. The Republic of South Africa “is one
with the poaching in South Africa becomes a timely of the world’s biggest mega-diverse countries”
research as South African rhinos face extinction due (African Wildlife Foundation, 2014, p. 1) and South
to increased poaching. Africa is home to the greater population of the
world’s rhinos (Global Issues, 2014; African Wild-
Consequently the major question that underpins this
life Foundation, 2014), it has about 80% of the re-
article is the possible relationship between the in-
maining of the world’s rhinos (Global Issues, 2014;
come of rhino horn consumer Asian countries and
Fight for rhinos, 2014) and this makes South Africa
rhino poaching in South Africa. Hence, the central
an attractive destination for rhino poachers – an in-
aim is to examine a possible relationship between
flux that is thwarting laudable government efforts to
the income of rhino horn consumer Asian countries
abate poaching. Apart from aesthetics and environ-
and the soaring rhino poaching in South Africa.
mental values, South Africa generates part of its for-
Since no research within the South African setting
eign revenue from tourism (African Wildlife Founda-
has yet looked into this relationship, authors of this
tion, 2014), and as such, the threatening extinction of
article therefore hope to modestly add to the litera-
rhinos would be inimical to such foreign revenue
ture on market approaches to understating rhino
earnings. In addition, the conservation of ecosystems
demand and poaching. The paper offers suggestions
and their species is important for restoring the natural
to assist with rhino conservation in South Africa,
environment that is being wrecked by human activi-
including, inter alia, the need to seek joint persua-
ties in the quest to satisfy human’s unbounded yearn-
sive campaign relationships with Asian countries to
ings for wealth (Global Issues, 2014). Hence, one of
use moral persuasion to curb the high demand for
the vital supports that academics all over the world
rhino horns in Asia, and to encourage and support
may lend to South Africa’s poaching crisis is research
rhino farming in communities near to rhino habitat
that points to the causes and remedies to rhino poach-
in South Africa.
ing in South Africa.
The paper is constructed as follows: Section 1
In a current research, Lopes (2014) finds that civil
presents a review of related literature. Section 2
unrest is positively associated with rhino poaching –
examines the income-demand theory for luxury
indicating that societies with a greater propensity of
goods. Following this Section 3 is the methodology
civil disobedience may be susceptible to poaching
section which presents an analysis of the relevant
of endangered species, whilst cultural reasons have
data. The final section draws conclusions.
been suggested by Harding (2013) and Alves et al.
1. Related literature (2010) as a cause of demand and associated poach-
ing of endangered species in Asia; it is perturbing
South Africa is located in the most southern part of
that the use, consumption and/or acquisition and
the African continent, and it is embellished with an
display of carvings from endangered species such as
extensive coastline spanning beyond 1,500 miles
rhino horn or parts is regarded as a luxury and a sign
between the Southern Atlantic Ocean and Indian
of affluence in Asia (Harding, 2013) – a display of
Ocean; it is also adorned with a luxurious shoreline
individual wealth (National Geographic, 2012);
with a massive geography but yet often dry and
since economic theory indicates that demand and
sparsely populated (African Wildlife Foundation,
acquiring of luxury goods increases with an increase
2014). Although poaching of wild life is rife in other
in income (Dubois & Duquesne, 1993). This is ap-
countries, the greatest threat to one of South Afri-
posite to examine whether rhino poaching in South
ca’s endangered species, rhino, is poaching. Poach-
Africa can be related to the increase in the income
ing and killing of wildlife is thus attracting research
of rhino horn consumer Asian countries; this is im-
across the globe to make a contribution to wildlife
portant toward rethinking conservation policies in
conservation – mostly the rhino (Manel et al., 2002;
South Africa. Harding (2013) posits that rising eco-
Gibson, 1999; Wright, 1992).
nomic development in China has created a huge
Growing research that attempts to suggest policy market for the demand and consumption of endan-
solutions to curb the extinction of endangered spe- gered species – luxury goods in Asia (Harding,
cies, amongst which, rhino has currently been in the 2013); and this demand has not been deterred by
lime light (Lopes, 2014; Harding, 2013; Alves et al., rising prices of rhino parts: “It would appear that
2010). The interest and need for more research escalating prices for rhino trophies in South Africa
43Environmental Economics, Volume 5, Issue 3, 2014
apparently have been of little concern to Vietnamese In another similar empirical research on the analysis
hunters who were seeking to acquire horns for of ivory seizure data, Underwood et al. (2013) dis-
commercial trade transactions in Asia, suggesting cover an alarming increase in global illicit trade in
that demand for rhino horn in Viet Nam is price ivory, which they conclude is due to increased de-
inelastic” (Milliken and Shaw, 2012, p. 56). mand for ivory in the east and south-east of Asia.
Underwood et al. (2013) also conclude that the ma-
Although National Geographic (2012) alludes to the
jor stock of raw ivory traded and consumed in the
demand for religious uses as one reason for accele-
rating slaughter of endangered species, but an ivory east and south-east of Asia are shipped from Africa
carving with a display price in the range of “hun- and that the shipping route bypass other Asian coun-
dreds of thousands of Dollars” (National Geograph- tries – an indication of the complicity of not only the
ic, 2012, p. 1) cannot be within the reach of a poor consuming countries, but also the route countries.
Asian; hence be it religion, culture, nutrition, and/or Other researchers such as Wittemyer et al. (2011)
aesthetics, a rhino ivory carving is seen as luxury find that rising ivory prices threaten the survival of
goods for the affluent (National Geographic, 2012); endangered species such as the elephants and rhinos,
this thus suggests economic power – income, as an reason being that poachers are highly incentivised
important factor deserving consideration in the dis- and attracted by the rising prices that also leads to
courses on rhino poaching and conservation. It is no more income from the illicit trading in wildlife
wonder therefore that increased poaching in South ivory; this thus corroborates the Challender and
Africa seems to be increasing in response to the Macmillan (2014) findings that poaching crisis is
increase in the income of Asian countries. It is beyond enforcement, it is embroiled in a market
therefore apposite to reflect briefly on the income economic behavior of prices, income, demand and
and demand theory for luxury goods. illegal supply (Underwood et al., 2013; Challender
and Macmillan, 2014). A research conducted by
Empirical literature Biggs et al. (2013) find that legal trade in rhino
Related empirical literature includes those of Ma- horns may reduce the enticement to poach if the
chin and Meghir (2000) on crime and economic demand for rhino horns does not rise beyond normal
incentives; Challender and Macmillan, (2014) on market levels; this indicates the overriding power of
the economic growth and demand implications on demand on rhino poaching in the source countries
rhino poaching. In their research, Challender and such as South Africa; furthermore the research find-
Macmillan, (2014) find that demand for rhino horn ing of Biggs et al. (2013) may indicate that even
in Asia is price-inelastic – despite rising prices in with the legalization of rhino trade, there is the pos-
African rhino horn. They also posit that rising eco- sibility that uncontrollable demand may still retain
nomic growth in the Asian rhino horn consumer the poaching appetite of poachers. This is perhaps
countries pose a major drive to demand for more why in their research on the supply and demand
rhino horns as consumers have more disposal in- uncertainties of rhino poaching Collins et al. (2013)
come within their reach. In their study on the eco- find that conservation psychology, if applied, may
nomic incentives of crime Machin and Meghir function positively to reduce rhino poaching, but
(2000) studied the effect of low wage on the incen- highlights the seeming neglect of this psychology in
tive to commit crime; they find that those at the conservation contemporary management policies.
lower level of wage income pyramid are more pre- They lament thus that:
disposed to commit crime; this finding resonates
closely with the findings of Challender and Macmil- “Psychological principles of persuasion, attitude,
lan (2014), that the income of rural dwellers close to and behavior change have been used effectively for
wildlife habitat are generally low and hence they many decades, but they have been largely ignored
have innate pressure to poach in order to increase or underutilized within biodiversity conservation”
the means of livelihood. Also in their empirical (Collins et al., 2013, p. 1168).
study, MacMillan & Nguyen (2013) studied the
wildlife killing habit and incentive of indigenous The application of psychology in conservation man-
forest dwelling people of Katu in Vietnam, find that agement is well expounded by Clayton (2012).
the incentive for illicit killing and trading of wildlife Clayton (2012) stresses that applications of psycho-
through hunting, trapping and snaring includes fi- logical positivity in sustainability present a renewed
nancial gains and social status and the fun of engag- optimism for reduction in wildlife poaching and
ing in such despicable practice; this thus shows the thus conservation. In a related empirical research in
dire need for a psychology approach to the man- a zoology park, Clayton et al. (2013) find that there
agement of poaching and conservation – a people is little or no application of behavioral psychology
centred approach as espoused in the research of in current conservation science, they adduce that
Algotsson (2006). this knowledge is not widely prominent to conserva-
44Environmental Economics, Volume 5, Issue 3, 2014
tion scientists. Thus in their conclusion of the results and controlling of illicit trading in rhino horns. Sta-
of empirical study of a zoology Park, Clayton et al. tus seeking consumers are not deterred by prices of
(2013) suggest: luxury goods (O’cass & Frost, 2002) and this con-
sumer behavior accounts for the reason why the
“To protect natural resources and biological diversity,
high price of rhino horn does not deter the status
both behavioral and natural scientists should do more
seeking consumers of rhino horn, more so in the
to look beyond their disciplinary boundaries. Psychol-
absence of a close substitute (Conrad, 2012).
ogists ought to be involved in environmental conserva-
tion and sustainability, conservation professionals, in Recent income trends as published by the World
turn, should consider the human dimensions of con- Bank indicate a rising income in the Asian countries –
servation initiatives” (Clayton et al., 2013, p. 382). including those identified for their penchant for rhino
horn – Vietnam, Thailand, China, Malaysia (Global
In a related empirical research, Mackenzie and Hart-
Issues, 2014). Drawing from the theory of income
ter (2013) find that socioeconomic conditions trigger
and demand, it seems therefore that the rising income
illegal extraction of natural forest resources from the
in Asia supports the demand for rhino horns despite
Uganda parks, they thus conclude that in order to
the high price of rhino horn. Accordingly the TRAF-
enhance successful conservation, policies should
FIC indicates that rhino poaching in South Africa is
integrate the economic needs of the local communi-
escalating “with the surging demand from Asia,
ties. In support of this view, Hamilton (2014) con-
people willing to pay high prices to get their hands
cludes that conservation of wildlife and reduction of
on rhino horn”(TRAFFIC, 2012, p. 1).
poaching may be successful if the well-being local
communities are considered in conservation policies. There is thus an allusion that the Illegal trade and
Moro et al. (2013) studied the trade-off between il- demand for rhino horn in Asia is driving the poach-
legal hunting and other means of income, they find ing and killing of rhinos:
that illegal hunting compares well with other sources “Illegal rhino horn trade to destinations in Asia is
of income, but illegal hunting is not pervasive driving the killing, with growing evidence of in-
amongst all wealth groupings, suggesting the need volvement of Vietnamese, Chinese and Thai nation-
for conservation management to incorporate the als in the illegal procurement and transport of rhino
hunting group in conservation management policies. horn out of Africa” (IUCN, 2009, p. 3).
2. Conceptual framework Thus IUCN believes that illegal Rhino horns from
Perhaps the most fitting theoretical framework to South Africa find their destination or route in Viet-
this article is the income and demand theory for nam, Thailand and China “It is believed that rhinoce-
luxury goods, thus in this section, the theory of in- ros horns illegally leaving Southern Africa are mov-
come and demand for luxury goods is brought to the ing into or through Thailand, Vietnam and China”
fore using the seminal essay of Dubois & Duquesne (IUCN, 2009, p. 3). This is further confirmed by
(1993). This theory is deemed fitting to contribute to TRAFFIC – a wildlife trade monitoring network that:
the literature on the market causes of rhino poach- “Of 43 documented arrests of Asian nationals for
ing, with emphasis on South Africa. In their income rhino crimes in South Africa, 24 have been Vietnamese
demand theory for luxury goods, Dubois & Du- (56%) and 13 Chinese (28%), with the remainder from
quesne (1993) stress that income is the most suitable Thailand and Malaysia” (TRAFFIC, 2012, p. 6.).
indicator to measure demand. Dubois & Duquesne
observe that there has recently been a boost in the This thus gives some clue to the high demand for rhino
market for luxury goods (Dubois & Duquesne, horn in these Asian countries and the apparent implicit
financial gain. According to Challender and Macmillan
1993) and rhino parts – most prominently, the horn,
(2014), the retail price of African rhino horn has risen
which has been classified as one of the luxury goods
in Asia to about US$65,000 per kg, a high price that
and hence a status symbol in the Vietnam market
supersedes previous years’ rhino horn prices in Asia.
(Conrad, 2012; see also Harding, 2013). Thus Du-
bois & Duquesne (1993) hypothese that “the higher Thus with the willingness to pay high prices and the
the income of an individual, the higher the propensi- rising demand that lures poachers, it therefore means
ty to purchase luxury goods”. It is therefore not that rhino conservation policy makers should follow
surprising the literature assertion that the demand the route of negotiations with the rhino horn con-
for rhino parts in Asia has been on the rise despite sumer countries to fashion some moral and persua-
the high price of rhino horn (Milliken and Shaw, sive strategies to reduce the rate of demand for rhino
2012). Hence the economic or market approach of horn. In corroboration with the income and demand
understanding the rhino poaching may be necessary theory for luxury goods, Challender and Macmillan
toward assisting with policies for rhino conservation (2014) posit eloquently that the rising economy of
45Environmental Economics, Volume 5, Issue 3, 2014
the Asian rhino horn consuming countries is a factor 3. Method
likely to be contributing to the boost in the demand
In the search for solutions to conservation of wildlife,
for the rhino horn in these countries. According to
a few researches on illicit wildlife poaching and trad-
Challender and Macmillan (2014), the GDP per capi-
ing have recently turned attention to market condi-
ta growth of some Asian consuming countries such
tions – most current amongst these researchers are
as China dwarfs the GDP of some rhino horn suppli-
Challender and Macmillan (2014) who alluded to the
ers from Africa, a reason that leaves the Asian con-
possibility that low economic growth and income in
sumers with affluent financial girth to demand and
wildlife source countries is an important factor in
purchase the rhino ivory despite the rising price.
illicit trade in wildlife. But South African economic
Drawing therefore from the income and luxury good growth and income has not declined within the pe-
demand theory, and the literature evidence of rhino riods of increasing growth in poaching of rhino in
horn destinations coupled with the resounding in- South Africa – 2002-2012; hence in this analysis, low
volvement of the consuming country’s nationals, this economic growth and income in South Africa is not
paper proceeds to examine a possible relationship regarded as a possible causative factor as Figure 1
between the rising income in Vietnam, Thailand, Chi- and Figure 2 depict a rising South African economy
na, Malaysia and rhino poaching in South Africa. The with a growing GDP per capita and GNI PPP of
analysis is thus presented in the following section. South Africa within the period of 2002 to 2012.
Source: Authors’ graph with data from World Bank (2014c) GDP per capita (current US$). http://data.worldbank.org/indicator/
NY.GDP.PCAP.CD/countries?page=1&display=default.
Fig.1. South Africa GDP per capita (current US$)
Source: Authors’ graph with data from World Bank (2014d) GNI per capita, PPP (current international $) http://data.worldbank.org/
indicator/NY.GNP.PCAP.PP.CD?page=2.
Fig. 2. South Africa GNI per capita, PPP (current international $).
46Environmental Economics, Volume 5, Issue 3, 2014
The analysis thus considered other factors alluded to SA); x3 = violence in South Africa (third predictor)
in the literature as possible causes of rhino poach- (shortened as: ViolenceinSA); e = error = 0.
ing: drawing from the work of Challender and The model is thus rewritten as:
Macmillan (2014) the independent variable in this
analysis is the income of Asian purchasing coun- ^R_PouchinSA = β0 + β1*IncofCon_ +
tries. Douglas & Alie (2014) suggest that violence β2*unemploySA + β3*ViolenceinSA.
may be linked to wildlife crime; and Kühl et al.
(2009) also suggest that unemployment may trigger Data is collected from the World Bank Economic
poaching behavior. Accordingly, the control va- Indicators and Governance Indicators respectively.
riables in this analysis are: rate of violence in South The income of five Asian rhino horn consumer
Africa and unemployment in South Africa. countries, which according to official sources are –
Vietnam, China, Hong Kong, Thailand and Malay-
Therefore the regression model of analysis is sia (IUCN, 2009, p. 3; TRAFFIC, 2012, p. 6; Global
represented as: Issues, 2014) is aggregated together as the major
Y = β0 + β1X1 + β2X2 + β3X3 + ε, independent variable. The income proxy for the
Asian consumer countries is the GNI per capita,
where: Y = Rhino Poaching (dependent variable)
PPP (current international $) World Bank (2014a)
(shortened as: PouchinSA); b0 = constant (Y inter-
for the five countries. Unemployment in South Afri-
cept) b1-3 = intercept (regression coefficient); x1 =
ca is also retrieved from the World Bank (2014b)
income of purchasing countries (first predictor)
worldwide governance indicators. And violence data
(shortened as: IncofCon.).
for South Africa is retrieved from the World Bank
Control variables: x2 = unemployment in South (2013) worldwide governance indicators. Data were
Africa (second predictor) (shortened as: unemploy- sourced as follows:
Table 1. Sources of data
Data & period Source
Stop rhino poaching (2014) the many faces of rhino poaching: rhinos poached in South Africa, http://www.timbavati.co.za/timbavati-
Y [2002-2012]
foundation/newsletters/doc_download/95-the-many-faces-of-rhino-poachingsrpfebruary-2014
x1 [2002-2012] World Bank (2014a) GNI per capita, PPP (current international $), http://data.worldbank.org/indicator/NY.GNP.PCAP.PP.CD
World Bank (2014b) South Africa: unemployment, total (% of total labor force) (modeled ILO estimate),
x2 [2002-2012]
http://data.worldbank.org/indicator/SL.UEM.TOTL.ZS?page=2
x3 [2002-2012] World Bank (2013) worldwide governance indicators, http://info.worldbank.org/governance/wgi/index.aspx#reports
The regression output is as below:
Table 2. Statistical result
Summary output
Regression statistics
Multiple R 0.956939839
R2 0.915733855
Adjusted R2 0.879619793
Standard error 77.56621283
Observations 11
ANOVA
df SS MS F Significance F
Regression 3 457677.2875 152559.1 25.35671 0.000390908
Residual 7 42115.62161 6016.517
Total 10 499792.9091
Coefficients Standard error t-stat. p-value Lower 95% Upper 95% Lower 95.0% Upper 95.0%
Intercept -
663.4025026 -5.01002 0.001548 -4892.354322 -1754.959 -4892.35432 -1754.96
3323.656676
IncofCon 0.015734016 0.002679282 5.872475 0.000616 0.009398521 0.02206911 0.00939852 0.02207
UnemploySA 97.91841896 29.88623861 3.276371 0.013555 27.24869435 168.588144 27.2486943 168.5881
ViolenceinSA 182.1377369 393.7273621 0.462599 0.657688 -748.8795319 -748.8795319 -748.879532 1113.155
The model estimate from the above output is thus:
ܻ = -3323.656676 + 0.015734016x1 + 97.91841896x2 + 182.1377369x3,
^R_PouchinSA = -3.32e + 03 + 0.0157*IncofCon + 97.9*unemploySA + 182*ViolenceinSA.
47Environmental Economics, Volume 5, Issue 3, 2014
Table 3. Normality test
Frequency distribution for uhat5, obs 1-11
number of bins = 5, mean = -2.2348, sd = 78.7685
Interval Midpt Frequency Rel. Cum.
< -49.012 -73.331 4 36.36% 36.36% *************
49.012 - -0.37523 -24.694 2 18.18% 54.55% ******
-0.37523 - 48.262 23.943 2 18.18% 72.73% ******
48.262 - 96.899 72.580 2 18.18% 90.91% ******
>= 96.899 121.22 1 9.09% 100.00% ***
Test for null hypothesis of normal distribution:
Chi-square(2) = 1.980 with p-value 0.37164
According to Graph Pad (2014) and iSixSigma (2014) a set of data passes the normality test if the p-value is
greater than 0.05; thus from the above test, the data are not inconsistent with a normal distribution.
Table 4. Heteroskedasticity test
White's test for heteroskedasticity OLS, using observations 2002-2012 (T = 11)
Dependent variable: uhat^2
Coefficient Std. error t-ratio p-value
const -2.66192e+06 1.88195e+06 -1.414 0.3918
IncofCon -20.4286 4.95962 -4.119 0.1516
unemploySA 294189 168528 1.746 0.3312
ViolenceinSA 3.20506e+06 1.30804e+06 2.450 0.2467
sq_IncofCon_ 5.34531e-05 1.66174e-05 3.217 0.1919
X2_X3 0.553879 0.193475 2.863 0.2139
X2_X4 1.06489 2.90598 0.3664 0.7764
sq_unemploySA -7233.80 3760.22 -1.924 0.3052
X3_X4 -141820 61187.6 -2.318 0.2593
sq_Violencein -460336 265172 -1.736 0.3327
Table 5. Heteroskedasticity corrected
Coefficient Std. error t-ratio p-value
const -3211.28 785.786 -4.0867 0.00465***
IncofCon_ 0.0156944 0.00279375 5.6177 0.00080***
unemploySA 93.6076 35.6912 2.6227 0.03427**
ViolenceinSA 214.3 485.187 0.4417 0.67204
Statistics based on the weighted data:
Sum squared resid 16.72647 S.E. of regression 1.545799
R-squared 0.922193 Adjusted R-squared 0.888847
F(3, 7) 27.65541 P-value (F) 0.000296
Log-likelihood -17.91336 Akaike criterion 43.82672
Schwarz criterion 45.41830 Hannan-Quinn 42.82345
rho 0.419178 Durbin-Watson 1.104525
Statistics based on the original data:
Mean dependent var 160.0909 S.D. dependent var. 223.5605
Sum squared resid 43486.25 S.E. of regression 78.81828
Based on the above correction of heteroskedasticity the regression model is thus revised as follows:
Revised model:
^R_PouchinSA = -3.21e+03 + 0.0157*IncofCon_ + 93.6*unemploySA + 214*ViolenceinSA.
Tested at 0.05% significant level; thus at a probabil- is consistent with the literature assertions that rise in
ity of less than 0.01%, the above multiple regression the economy and/or income of wildlife consumer
statistics result indicates a positive significance rela- Asian countries may lead to a greater demand for,
tionship between income of rhino purchasing coun- and hence, more poaching, see for example Chal-
tries and rhino poaching in South Africa. This result lender and Macmillan (2014). A tentative suggestion
48Environmental Economics, Volume 5, Issue 3, 2014
thus may be that the rising income in the five Asian of 0.03% (less than 0.05%), the statistical result also
rhino horn consumer countries – Vietnam, China, shows a significant positive relationship between
Hong Kong, Thailand and Malaysia, contributes to unemployment in South Africa and rhino poaching,
the increasing cases of rhino poaching in South Afri- and this is also consistent with literature assertion that
ca. This finding thus adds to existing literature sug- unemployment may contribute to poaching of wild-
gesting that regulation alone may not yield the de- life (Kühl et al., 2009). This again, suggests the need
sired result for rhino conservation. Since rising in- for policy measures – beyond regulation, to stem the
come incites rhino horn consumers to demand more tide of unemployment and assist with rhino conserva-
rhino horns (Challender and Macmillan, 2014), the tion. Rhino farming can be encouraged with financial
government of South Africa may have to look and logistical support to communities and individuals
beyond regulation and seek for a joint effort with in the rhino habitat. If rhino horn farmers are capaci-
Asian countries to lunch a moral persuasion cam- tated and given a competitive financial reward that
paign in an effort to reduce the demand for rhino horn may equate or near the gains of poaching, there is
in the Asian consumer countries. Furthermore, al- the likelihood that the impetus to poaching may
though lesser in value in this analysis; at a probability plummet.
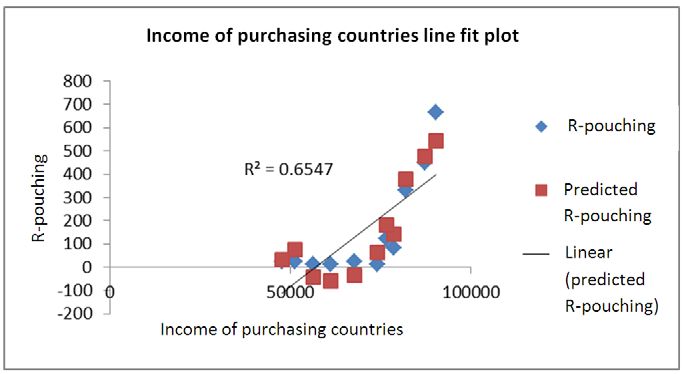
Fig. 3. Line fit plots between income of rhino horn consumer countries and rhino poaching in South Africa
Apart from the above test of significance between the correlation between the income of rhino purchasing
income of rhino product purchasing countries and countries and rhino poaching in South Africa. A line
rhino poaching in South Africa, which shows a signi- graph is also presented below (Figures 4 and 5) to
ficance positive relationship to the value of less than depict the rising rhino poaching in South Africa and
0.01; the above line fit plot also indicates a positive the rising income in Asian consumer countries.
Source: Authors’ graph with data from: Stop Rhino Poaching (2014) the many faces of rhino poaching: rhinos poached in South Africa.
http://www.timbavati.co.za/timbavati-foundation/newsletters/doc_download/95-the-many-faces-of-rhino-poachingsrpfebruary-2014.
Fig. 4. Line graph of rhino poaching in South Africa
49Environmental Economics, Volume 5, Issue 3, 2014
Source: Authors’ graph with data from: World Bank (2014a) GNI per capita, PPP (current international $),
http://data.worldbank.org/indicator/NY.GNP.PCAP.PP.CD (Vietnam, China, Hong Kong, Thailand & Malaysia).
Fig. 5. Line graph of rising income of asian rhino horn purchasing countries
The preceding findings suggest that, aside from statistics. Findings from the multiple regression analy-
other factors, the rise in income of Asian rhino horn sis suggests that the rise in consumer income of rhino
consumer countries may somewhat be linked to in- horn consuming countries (Vietnam, China, Hong
creasing rhino poaching in South Africa. An impor- Kong, Thailand and Malaysia) has a positive signifi-
tant conservation policy implication is the need to cant relationship with the rise in rhino poaching in
create a locally tailored incentive that may decrease South Africa. The findings thus are important for im-
the appetite to poach and illicitly export rhino parts proving rhino conservation policy management and
from South Africa. The paper suggests the need for research; in addition to local law enforcement, a more
the government of South Africa to initiate a process joint international rhino trading pact is desirable be-
of incentivising communities around the rhino habitat tween South Africa and the rhino consuming Asian
to engage in rhino farming with enabling logistical countries; a stronger agreement for border rhino trade
and financial support from the government. Apart monitoring, national stringent rhino trading regulations
from rhino farming, Harihar et al. (2014) and Chal- and enforcements should be sought by South Africa in
lender and Macmillan (2014) suggest that other forms the Asian consuming countries to abate rhino trading
of incentive may include payment to local communi- in these countries and to reduce rhino poaching in
ties that engage in conservation of rhinos, and pay- South Africa. A more effective immigration policy is
ment may be based on species population count dur- also apposite regarding visitors from the consuming
ing the periods of incentive payments. countries. Additionally, given that rising income in
Asia tends to spur the demand for rhino horn – luxury
Conclusion
goods in Asia, a moral persuasion strategy on the
This article has made an attempt to adopt a slightly Asian consumers is urgently needed as regulation and
different view of an economic dimension of rhino enforcement does not seem to yield the desired goal.
demand and poaching and examined the likely rela- On the other hand, given also the relationship found
tionship between the income of rhino horn consuming between poverty and rhino poaching in this analysis,
countries in Asia and the rise in rhino poaching in the paper recommends that government needs to con-
South Africa. The review of related literature indicates sider the creation of a better opportunity cost of poach-
two important information factors about demand and ing by initiating competitive income earning opportun-
poaching of rhino, namely that the purchase of rhino ities around the rhino habitat communities. One of
horn in Asia is a luxury and hence a status symbol, and such opportunity is to encourage rhino farming by
that the rise in income may lead to an increase in the giving strategic, logistical and financial support to
consumption of luxury goods of which rhino horn is rhino farmers and to purchase rhinos from the farmers
one. Furthermore, the paper combines the review ap- at an ‘arm’s length price’; this may make rhino farm-
proach with data analysis using the multiple regression ing to be lucrative and reduce the urge for poaching.
References
1. African Wildlife Foundation (2014). South Africa, available at: http://www.awf.org/country/south-africa [accessed
May 3, 2014].
2. Algotsson, E. (2006). Wildlife conservation through people-centred approaches to natural resource management
programs and the control of wildlife exploitation, Local Environment, 11 (1), pp. 79-93.
50Environmental Economics, Volume 5, Issue 3, 2014
3. Alves, R.R.N., W.M.S. Souto and R.R.D. Barboza (2010). Primates in traditional folk medicine: a world overview,
Mammal Review, 40, pp. 155-180.
4. Biggs, D., Courchamp, F., Martin, R. & Possingham, H.P. (2013). Legal trade of Africa’s rhino horns, Science, 33
(6123), pp. 1038-1039.
5. Challender, D.W.S. & MacMillan, D.C. (2014). Poaching is more than an enforcement problem, Conservation
Letters.
6. Conrad, K. (2012). Trade bans: a perfect storm for poaching? Tropical Conservation Science, 5 (3), pp. 245-254.
7. Clayton, S.D. (2012). The Oxford Handbook of Environmental and Conservation Psychology, Oxford University
Press: Oxford.
8. Clayton, S., Litchfield, C. & Geller, E.S. (2013). Psychological science, conservation, and environmental sustaina-
bility, Frontiers in Ecology and the Environment, 11 (7), pp. 377-382.
9. Collins, A., Fraser, G. & Snowball, J. (2013). Rhino poaching: supply and demand uncertain, Science, 340 (6137),
p. 1167.
10. Department of Environmental Affairs South Africa (2014). Update on Rhino poaching statistics, available at:
https://www.environment.gov.za/mediarelease/rhinopoaching_statistics_17jan2014 [Accessed May 8, 2014].
11. Douglas, L.R. & Alie, K. (2014). High-value natural resources: Linking wildlife conservation to international
conflict, insecurity and development concerns, Biological Conservation, 171, pp. 270-277.
12. Dubois, B. & Duquesne, P. (1993). The market for luxury goods: income versus culture, European Journal of
Marketing, 27 (1), pp. 35-44.
13. Dudley, J.P., Ginsberg, J.R., Plumptree, A.J., Hart, J.A. & Campos, L.C. (2002). Effects of war and civil strife on
wildlife and wildlife habitats, Conservation Biology, 16 (2), pp. 319-329.
14. Fight for Rhinos (2014). Dare to hope, available at: http://fightforrhinos.com/2014/03/18/dare-to-hope/ [Accessed
June 6, 2014].
15. Gibson, C.C. (1999). Politicians and poachers: The political economy of wildlife policy in Africa, Cambridge
University Press.
16. Global Issues, (2014). Nature and animal conservation, available at: http://www.globalissues.org/article/177/
nature-and-animal-conservation [Accessed June 6, 2014].
17. Graph Pad (2014). Interpreting results – normality test, available at: http://www.graphpad.com/guides/
prism/6/statistics/index.htm?stat_interpreting_results_normality.htm [Accessed July 19 2014].
18. Harding, L.E. (2013). Wildlife poaching increasing, TAPROBANICA: The Journal of Asian Biodiversity, 5 (1), pp. 1-5.
19. Hamilton, K. (2014). Wildlife conservation and environmental economics, Environment and Development Eco-
nomics, 19 (3), pp. 299-302.
20. Harihar, A., Ghosh-Harihar, M. & MacMillan, D.C. (2014) Human resettlement and tiger conservation – socio-
economic assessment of pastoralists reveals a rare conservation opportunity in a human-dominated landscape, Bi-
ologial Conservation, 169, pp. 167-175.
21. IUCN (2009). Status, conservation and trade in African and Asian Rhinocerous, available at: http://cmsdata.iucn.org/
downloads/status__conservation_and_trade_in_african_and_asian_rhinoceroses.pdf [Accessed June 6, 2014].
22. iSixSIgma (2014). Anderson-Darling Normality Test http://www.isixsigma.com/dictionary/anderson-darling-
normality-test/ [Accessed July 19 2014].
23. Kühl, A., Balinova, N., Bykova, E., Arylov, Y.N., Esipov, A., Lushchekina, A.A. & Milner-Gulland, E.J. (2009).
The role of saiga poaching in rural communities: Linkages between attitudes, socioeconomic circumstances and
behavior, Biological Conservation, 142(7), pp. 1442-1449.
24. Lopes, A.A. (2014). Civil unrest and the poaching of rhinos in the Kaziranga National Park, India. Ecological
Economics, 103, pp. 20-28.
25. Machin, S. & Meghir, C. (2004). Crime and economic incentives, Journal of Human Resources, 39 (4), pp. 958-979.
26. Mancini, A., Senko, J., Borquez-Reyes, R., Guzman Poo, J., Seminoff, J. and Koch, V. (2011). ‘To Poach or Not
to Poach an Endangered Species: Elucidating the Economic and Social Drivers Behind Illegal Sea Turtle Hunting
in Baja California Sur, Mexico’, Journal of Human Ecology, 39, pp. 743-756.
27. MacMillan, D.C., & Nguyen, Q.A. (2014). Factors influencing the illegal harvest of wildlife by trapping and snar-
ing among the Katu ethnic group in Vietnam. Oryx, 48 (02), pp. 304-312.
28. Manel, S., Berthier, P. & Luikart, G. (2002). Detecting wildlife poaching: identifying the origin of individuals with
Bayesian assignment tests and multilocus genotypes, Conservation Biology, 16 (3), pp. 650-659.
29. Mackenzie, C.A. & Hartter, J. (2013). Demand and proximity: drivers of illegal forest resource extraction, Oryx,
47 (02), pp. 288-297.
30. Milner-Gulland, E.J. & Leader-Williams, N. (1992). A model of incentives for the illegal exploitation of black
rhinos and elephants: poaching pays in Luangwa Valley, Zambia, Journal of Applied Ecology, pp. 388-401.
31. Milliken, T. and Shaw, J. (2012). The South Africa – Vietnam Rhino horn Trade Nexus. TRAFFIC – the wildlife
trade monitoring network, available at: http://www.traffic.org/species-reports/traffic_species_mammals66.pdf
[Accessed June 6, 2014].
32. Moro, M., Fischer, A., Czajkowski, M., Brennan, D., Lowassa, A., Naiman, L.C. & Hanley, N. (2013). An investi-
gation using the choice experiment method into options for reducing illegal bushmeat hunting in western Serenge-
ti, Conservation Letters, 6 (1), pp. 37-45.
51Environmental Economics, Volume 5, Issue 3, 2014
33. National Geographic (2012). Blood Ivory, National Geographic, October 2012, available at: http://ngm.
nationalgeographic.com/2012/10/editors-note [Accessed June 6, 2014].
34. O’cass, A. & Frost, H. (2002). Status brands: examining the effects of non-product-related brand associations on
status and conspicuous consumption, Journal of Product & Brand Management, 11 (2), pp. 67-88.
35. Raichev, E. and Georgiev, D. (2012). ‘Hunters’ Attitudes to Some Protected Mammals and Birds in Bulgaria’,
Trakia Journal of Sciences, 10, pp. 48-51.
36. Stop Rhino Poaching (2014). The many faces of Rhino poaching: Rhinos poached in South Africa, available at:
http://www.timbavati.co.za/timbavati-foundation/newsletters/doc_download/95-the-many-faces-of-rhino-poachingsrp
february-2014 [Accessed April 2, 2014].
37. Smith, R.J. & Walpole, M.J. (2005). Should conservationists pay more attention to corruption? Oryx, 39 (03),
pp. 251-256.
38. TRAFFIC (2012). Loose horns, surging demand and easy money create “perfect storm” for rhino poaching, avail-
able at: http://www.traffic.org/home/2012/8/21/loose-horns-surging-demand-and-easy-money-create-perfect-sto.html
Accessed June 6, 2014].
39. Underwood, F.M., Burn, R.W. & Milliken, T. (2013). Dissecting the illegal ivory trade: an analysis of ivory sei-
zures data, PloS one, 8 (10), e76539.
40. von Essen, E., Hansen, H.P., Källström, H.N., Peterson, M.N. & Peterson, T.R. (2014). Deconstructing the Poach-
ing Phenomenon: A Review of Typologies for Understanding Illegal Hunting, British Journal of Criminology, 54
(4), pp. 632-651.
41. Warchol, G.L., Zupan, L.L. & Clack, W. (2003). Transnational criminality: An analysis of the illegal wildlife
market in Southern Africa, International Criminal Justice Review, 13 (1), pp. 1-27.
42. Wittemyer, G., Daballen, D. & Douglas-Hamilton, I. (2011). Poaching policy: rising ivory prices threaten ele-
phants, Nature, 476 (7360), pp. 282-283.
43. Wright, R.G. (1992). Wildlife research and management in the national parks, University of Illinois Press.
44. World Bank (2014a). World Bank Development Indicators (China, HongKong, Thailand, Vietnam, Malaysia),
http://data.worldbank.org/indicator/NY.GNP.PCAP.PP.CD [Accessed June 6, 2014].
45. World Bank (2014b). South Africa: unemployment, total (% of total labor force) (modelled ILO estimate),
http://data.worldbank.org/indicator/SL.UEM.TOTL.ZS?page=2 [Accessed April 2, 2014].
46. World Bank (2013). Worldwide governance indicators, (Political Stability and Absence of Violence: South Afri-
ca). Available at: http://info.worldbank.org/governance/wgi/index.aspx#reports [Accessed April 2, 2014].
47. World Bank (2014c). GDP per capita (current US$). http://data.worldbank.org/indicator/NY.GDP.PCAP.CD/
countries?page=1&display=default.
48. World Bank (2014d). GNI per capita, PPP (current international $) http://data.worldbank.org/indicator/
NY.GNP.PCAP.PP.CD?page=2.
52You can also read