THE PLACE OF KIWISAVER IN NEW ZEALAND'S RETIREMENT INCOME FRAMEWORK - Máire Dwyer March 2013
←
→
Page content transcription
If your browser does not render page correctly, please read the page content below
THE PLACE OF KIWISAVER IN NEW ZEALAND’S
    RETIREMENT INCOME FRAMEWORK

             Máire Dwyer

              March 2013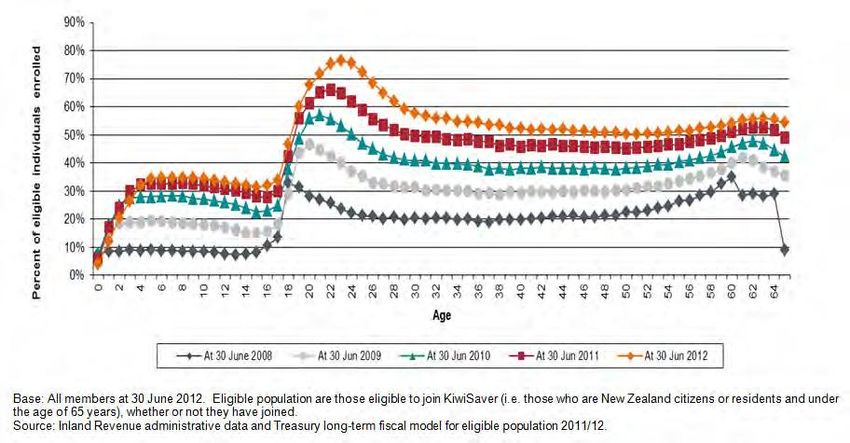
Contents
SUMMARY OF KEY POINTS.................................................................................................. 4
   Purpose of the Report..................................................................................................... 4
   Overview of KiwiSaver .................................................................................................... 4
   Membership, contributions and withdrawals ................................................................ 5
   The funding of employer contributions .......................................................................... 5
   Investments in KiwiSaver schemes ................................................................................. 6
   The place of KiwiSaver in the Retirement Income Framework ...................................... 7
SECTION ONE: INTRODUCTION ........................................................................................... 8
   Background ..................................................................................................................... 8
   Approach ......................................................................................................................... 8
   Structure of this report ................................................................................................... 8
SECTION TWO: KIWISAVER STRUCTURE ............................................................................. 9
   History and purpose........................................................................................................ 9
   KiwiSaver features .......................................................................................................... 9
SECTION THREE: TRENDS IN MEMBERSHIP, CONTRIBUTIONS AND WITHDRAWALS ...... 13
   Membership .................................................................................................................. 13
   Member characteristics ................................................................................................ 13
   Socio-economic status of members.............................................................................. 14
   Population who opt out of KiwiSaver ........................................................................... 15
   Income sources of KiwiSaver members ........................................................................ 15
   Non-contributing KiwiSaver members.......................................................................... 15
   Contribution levels ........................................................................................................ 16
   Overall contributions by government, employers and members to KiwiSaver ........... 17
   Fiscal costs .................................................................................................................... 18
   Users of the first home option ...................................................................................... 18
   Patterns of withdrawals from KiwiSaver by members eligible to do so ....................... 19
SECTION FOUR: THE FUNDING OF EMPLOYER CONTRIBUTIONS TO KIWISAVER............. 20
   To what extent are total remuneration approaches taken to KiwiSaver? ................... 20
   Total remuneration cannot lower wages below the minimum wage .......................... 21
   Implications of the increase of minimum employer and employee contributions to 3%
   ....................................................................................................................................... 21
   Equity implications ........................................................................................................ 21

                                                                                                                                           2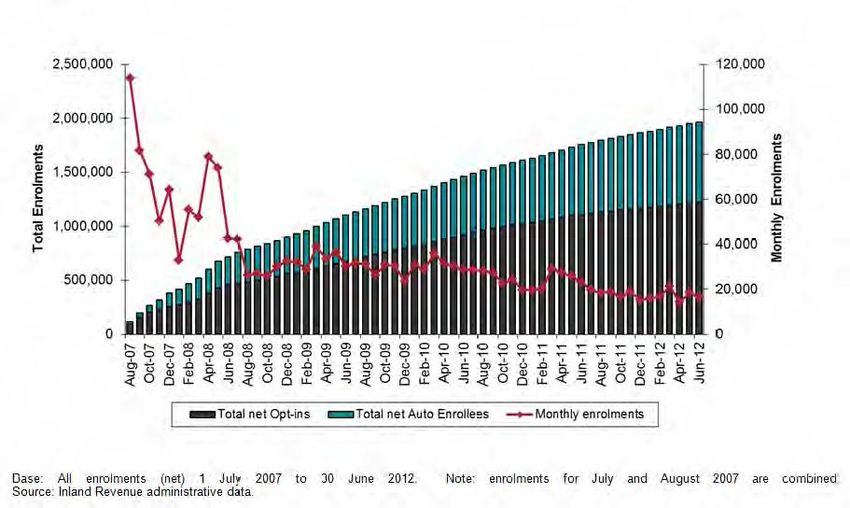
SECTION FIVE: INVESTMENTS IN KIWISAVER SCHEMES ................................................... 24
   The relative significance of KiwiSaver in the managed funds sector ........................... 24
   To what extent has KiwiSaver led to more personal savings and asset accumulation?
   ....................................................................................................................................... 25
   Balances in KiwiSaver funds .......................................................................................... 25
   The earnings of KiwiSaver schemes .............................................................................. 25
   Regulation and oversight of KiwiSaver schemes .......................................................... 26
       FMA role.................................................................................................................... 26
       KiwiSaver Periodic Reporting Regulations ................................................................ 26
   Default providers and the rules governing default funds ............................................ 27
       Default fund members .............................................................................................. 27
       Default provisions after 2014 ................................................................................... 27
   Annuities ....................................................................................................................... 28
SECTION SIX: THE PLACE OF KIWISAVER IN THE RETIREMENT INCOME FRAMEWORK ... 29
   Dissagregated data on savings and earnings ................................................................ 30
   KiwiSaver, wages and remuneration ............................................................................ 30
   Data on KiwiSaver ......................................................................................................... 30
BIBLIOGRAPHY .................................................................................................................. 32

                                                                                                                                           3
THE PLACE OF KIWISAVER IN NEW ZEALAND’S RETIREMENT INCOME FRAMEWORK
SUMMARY OF KEY POINTS
Purpose of the Report
This report provides background for the 2013 Review of Retirement Income policy by
the Commission for Financial Literacy and Retirement Income (CFLRI) on the role of
private savings for retirement, with particular reference to trends in KiwiSaver, and the
role of the financial services sector in helping to ensure the adequacy of retirement
income for New Zealanders. The report will contribute to the overall review as it
considers the ideal future balance between pay as you go (PAYGO) (i.e. tax-based) and
save as you go (SAYGO) funding in New Zealand’s retirement income framework.
Increases in the cost of NZS arising from demographic change, along with increased
expectations of standards of living in retirement, point to likelihood of a greater role for
private savings.
Overview of KiwiSaver
KiwiSaver was set up to encourage a long-term savings habit with a view to
supporting a similar standard of living post-retirement as in pre-retirement.
It locks in savings until age 65 via a voluntary approach to retirement savings with
incentives for everyone, and automatic enrolment (with opt-out provisions) for new
employees, as well as compulsory employer contributions.
Employees elect to contribute from their after-tax pay at the rate of 2% (the
minimum), 4% or 8% of their gross salary.
Employees who do not select a scheme are randomly allocated to a default scheme.
Employers must contribute an amount equal to 2% of gross salary to their
employees’ KiwiSaver schemes.
The minimum rates of employer and employee contributions to KiwiSaver will
increase to 3% of gross pay in April 2013.
Employer’s superannuation contribution tax (ESCT), which is typically the same as
the employee’s marginal tax rate, is deducted from employer contributions before
they are paid to KiwiSaver accounts.
Employers with their own qualifying work-based savings schemes can offset
contributions to these schemes against KiwiSaver obligations, but typically only for
employees who joined before 1 April 2008.
Employers send both employer and employee contributions to Inland Revenue with
PAYE payments.
Government provides a one-off, $1000 kick-start contribution to a new KiwiSaver
account, and a Member Tax Credit (MTC) contribution of 50c for each dollar a
member contributes (up to a maximum MTC of $521 per year, which equals $10 per
week). Complying superannuation funds also access the MTC where member
contributions are paid on a KiwiSaver equivalent ‘locked in’ basis.
4 After three years in KiwiSaver, individuals and couples can withdraw their own, and
their employers’, contributions to buy a first (and in limited circumstances a
subsequent) home and receive a first home purchase subsidy of $1,000 per year of
KiwiSaver contributions (up to $5,000 each and $10,000 for a couple).
From July 2013 (and initially as at 30 June 2013) fund managers must begin reporting
their performance and returns, fees and costs, assets and portfolio holdings,
liquidity and liabilities, and key personnel, along with any conflicts of interest, in a
standardised format.
Membership, contributions and withdrawals
KiwiSaver is now part of the retirement income framework for half of eligible New
Zealanders. Membership has hit 2 million and continues to rise.
Around 38% of KiwiSaver members were automatically enrolled and fewer people
now opt out. KiwiSavers have slightly higher incomes than non-members.
Non-members who are self-employed, casual employees, or not in work, are not
subject to any “soft compulsion” triggers.
Almost as many KiwiSaver members have opted in directly with providers as have
either opted in via their employer or been automatically enrolled by their employer.
In the year to June 2012, around 75% of members who are eligible for the member
tax credit made some contributions to their account.
The proportion of wage and salary earners who contribute at the lowest level of 2%
has grown from 41% in 2010 to 59% in 2012.
In 2010/2011, the median annual contribution by wage and salary earners (excluding
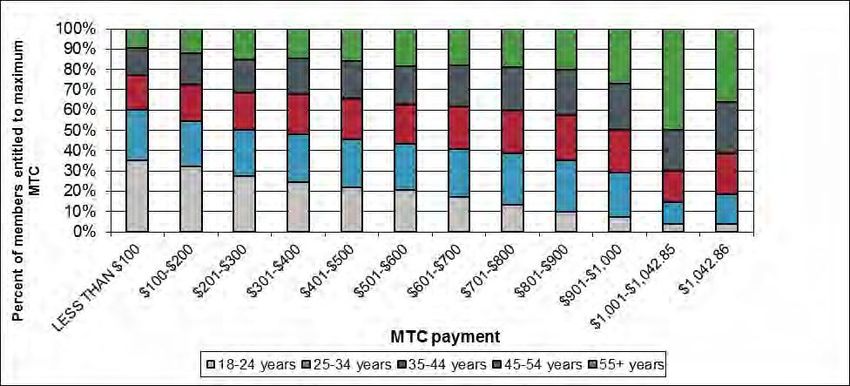
the employer contribution) was $829. Members over 18 years who earned only non-
salary or wage income mostly contributed either $1,043 or $1,200 per annum to
their KiwiSaver – that is at a level to maximize their MTC.
The Crown contributed 32% of all contributions to KiwiSaver between in 2011/12,
down from 55% in 2007/08.
IRD reports that at 31 December 2012, 15,575 KiwiSaver members, or a third
(32.5%) of the estimated members who were eligible to withdraw savings because
they had reached the age of 65 and had been members for at least five years, had
closed their KiwiSaver accounts. Further analysis on withdrawals is forthcoming.
The funding of employer contributions
Most employer contributions are in addition to an employee’s gross salary or wages
but some employers have negotiated a total remuneration package – that is an
employee receives a fixed amount of remuneration and, if that employee is a
member of KiwiSaver, the cost of the employer contribution comes out of the
employee’s pay.
The Employment Court has ruled that, under a total remuneration approach, gross
wages cannot fall below the minimum wage of $13.50 an hour.
5 Pressures on remuneration budgets across the public and private sectors may lead
to more employers using a total remuneration approach if they can reduce current
and future costs this way.
Since July 2012, state sector agencies have had to fund KiwiSaver contributions from
their own budgets – previously a central fund of around $181 million reimbursed
them for employer contributions to KiwiSaver and other retirement schemes.
KiwiSaver members and employers generally benefit from KiwiSaver contributions
being an additional payment. Where employers have a strong position in
negotiations, taking a total remuneration approach with new employees can reduce
their future liabilities. A total remuneration approach is also likely to reduce the
costs to employers from future increases to the level of their compulsory
contributions.
A total remuneration approach makes pay systems transparent and would benefit
non-KiwiSaver members. However, total remuneration also reduces the
attractiveness of KiwiSaver to all members.
Investments in KiwiSaver schemes
$14,096 million of the $35,163 million assets under fund management held in
superannuation schemes are KiwiSaver funds. This is 18% of the $78,692 million
total funds under management (September 2012).
Based on self-reporting in a 2010 survey, approximately 36% of individual
contributions to KiwiSaver represented additional saving
At 31 March 2012, the average balance across all KiwiSaver accounts was $6,668 and
the average balance in a default fund was marginally lower at $6,530.
An analysis of three KiwiSaver providers found higher balances by age. Adult male
balances were higher than female balances, and the gap widens between age 20-50.
Morningstar finds average returns to KiwiSaver were low in the initial years
particularly for more growth oriented funds; the most recent annual data shows
growth oriented funds lead default and conservative funds.
KiwiSaver is based on a competitive market for providers, including default
providers, as well as the option to switch providers at any time. There is no
government guarantee that KiwiSaver accounts will retain their value, let alone
grow.
Discipline on KiwiSaver providers comes from: the Financial Markets Authority
(FMA) which is responsible for the administration, compliance monitoring and
enforcement of the KiwiSaver Act; self-management and disclosure by KiwiSaver
providers, and market pressure from KiwiSaver clients. The Reserve Bank’s capital
market regulations also have an impact.
From July 2013 (and as at 30 June 2013), the KiwiSaver Periodic Reporting
Regulations will require fund managers to report their performance and returns,
fees and costs, assets and portfolio holdings, liquidity and liabilities, and key
personnel, along with any conflicts of interest, in a standardised format on their
websites.
6 At 31 March 2012 24% of KiwiSaver members were in a default fund. Most (93%)
members in an employer-chosen scheme are in the default option of that scheme.
A discussion document on default provider arrangements was released in late 2012.
There is no date set for decisions on a post-2014 regime.
The absence of annuities that convert lump sums into regular payments until death
will matter more as KiwiSaver balances grow and more members are eligible to
withdraw. Without any compulsion to purchase annuities, there is little prospect for
using KiwiSaver savings to offset New Zealand Superannuation or other health and
welfare expenditures that benefit the retired population.
The place of KiwiSaver in the Retirement Income Framework
KiwiSaver has grown quickly to become a large programme with over 2 million
members with funds that hold $14 billion in assets.
Policy is underdeveloped in relation to: the broader market of work-based
superannuation schemes that comply with or complement KiwiSaver; KiwiSaver’s fit
in the Retirement Income Framework, and its relationship with other programmes.
Other issues needing more attention include: the impacts of KiwiSaver on: wages
and remuneration patterns; growth and productivity; fairness, and fiscal implications
over the longer term.
Currently, there is no direct relationship between KiwiSaver and other retirement
income policies.
Clarity about how KiwiSaver fits alongside other retirement polices, and how this
may change in the future, is essential if stakeholders are to work together to support
KiwiSaver going forward, and for any trade-offs to be identified and planned for.
Gaps in information and data are difficult to prioritise without clear policy.
It would be valuable to track the value of individual accounts by gender, age and
other factors, such as employment status. This type of data could be obtained
through sampling the tax records of individuals as all KiwiSaver schemes must file a
return for individual members. However, IRD have noted that access to this data is
governed by the Tax Administration Act.
Tracking the extent to which employment agreements (both collective and
individual) in both the private and the public sector involve total remuneration
approaches, and who is impacted and how, is suggested.
There is considerable reliance on KiwiSaver providers supplying their own
information about their schemes. Transparency would be better supported by an
independent and timely distillation of the disclosed information by the FMA,
including the analysis of membership data within schemes.
7SECTION ONE: INTRODUCTION
Background
KiwiSaver, a voluntary, subsidised, private retirement savings regime, has been in place
less than six years and has over 2 million members. The Terms of Reference for the 2013
Review of Retirement Income policy by the Commission for Financial Literacy and
Retirement Income (CFLRI) include a requirement to assess the role of private savings
for retirement, including:
trends in KiwiSaver, particularly withdrawal patterns of those retiring and the issues
that these may raise; and
the role of the financial services sector in helping to ensure the adequacy of
retirement income for New Zealanders.
The 2013 Review will address the ideal future balance between pay as you go (PAYGO)
(i.e. tax-based) and save as you go (SAYGO) funding in New Zealand’s retirement income
framework as increases in the cost of NZS arising from demographic change, along with
increased expectations of standards of living in retirement, point to a greater role for
private savings.
Approach
The paper has largely been developed through analysis based on secondary sources
(literature and data) along with an analysis of KiwiSaver in Collective Employment
Agreements (CEAs) undertaken by the Industrial Relations Centre, Victoria University.
This paper has also been informed by discussions with Malcolm Menzies, CFLRI;
Michelle Lloyd and Barb Lash, Statistics New Zealand; Teneti Ririnui, Meade Perrin, and
Donna Finlayson, Inland Revenue Department (IRD); Adam Hunt, Financial Markets
Authority (FMA); Cath Jackson, State Services Commission and Glenn Barclay, Public
Service Association.
Structure of this report
Section Two provides an overview of KiwiSaver design and rules
Section Three looks at trends in membership, contributions and withdrawals
Section Four discusses employers’ approaches to funding compulsory
contributions to KiwiSaver
Section Five considers investments in KiwiSaver schemes
Section Six comments on key policy issues and data gaps
8SECTION TWO: KIWISAVER STRUCTURE
History and purpose
The KiwiSaver scheme was announced in Budget 2005, enacted by the KiwiSaver Act
2006 (the Act) and commenced on 1 July 2007.
The stated purpose of the Act is to: “encourage a long-term savings habit and asset
accumulation by individuals who are not in a position to enjoy standards of living in
retirement similar to those in pre-retirement. The Act aims to increase individuals’ well-
being and financial independence, particularly in retirement, and to provide retirement
benefits. To that end, this Act enables the establishment of schemes (KiwiSaver schemes)
to facilitate individuals’ savings, principally through the workplace (Section 3)”. The
objectives of KiwiSaver, as set out in its legislation, make no reference to national
saving, productivity growth or debt reduction goals (Hurnard, 2011) although these
could be regarded as implicit objectives.
KiwiSaver features
KiwiSaver is designed to lock in savings until age 65 via a voluntary approach to
retirement savings with incentives for everyone and automatic enrolment (with opt-out
provisions) for new employees, as well as compulsory employer contributions. Box One
below sets out the main features in relation to overall scheme design, coverage and
obligations of employees, obligations of employers, tax and subsidies, housing and
forthcoming changes. KiwiSaver is most prescriptive for employees and their employers,
and offers others the opportunity to save as much and as often as they choose within
the KiwiSaver scheme. See also www.KiwiSaver.govt.nz and www.ird.govt.nz
Box One: KiwiSaver features
Scheme design
KiwiSaver is open to all New Zealand citizens, and people living in, and entitled to
live in New Zealand, permanently, who are under the age of 65.
Saving occurs via individual accounts in a scheme provided by a registered KiwiSaver
provider that provides a scheme to the public or a section of the public.
Individuals can choose their KiwiSaver scheme and switch schemes at any time.
Savings are locked in until the age of 65, and at least 5 years’ membership (or
death).
Significant financial hardship or serious illness are grounds for early withdrawal.
Individuals who leave New Zealand permanently can close their KiwiSaver account
on signing a Statutory Declaration one year after departure (but must return their
member tax credit amount to Inland Revenue) – from 1 July 2013 this will no longer
be permitted following emigration to Australia, but transfers to Australian complying
superannuation schemes (including member tax credits) will be permitted.
9 After at least three years of membership and savings, first home buyers may access
their savings (excluding the Government contributions amount) and apply them
towards the purchase of a house in which they will live (see below).
Individuals who are not employees (e.g. who work on contract and pay their own
tax) enrol with a KiwiSaver scheme and choose how much and how often they
contribute.
Savers can remain KiwiSaver members after age 65 (or after completing 5 years’
membership, if later) but will no longer attract any government contribution for new
savings.
Employees
Employees who meet residence/citizenship, age (18-64), and employment (not own
account, casual or temporary) criteria are automatically enrolled in KiwiSaver when
they start a new job (unless their employer has an approved alternative work-based
saving scheme) and have an eight week period to opt out.
Employees under 18 can join KiwiSaver but only by choosing and contracting direct
with a KiwiSaver provider.
Temporary employees employed for up to 28 continuous days are not enrolled
automatically, but can opt in to KiwiSaver.
Casual employees engaged on an irregular and intermittent basis and who receive
holiday pay with their wages are not subject to automatic enrolment. Employees
who are visiting New Zealand and live elsewhere or hold temporary, visitor or
student work permits, cannot join KiwiSaver.
Employees elect to contribute at 2% (the minimum, rising to 3% on 1 April 2013), 4%
or 8% of their gross salary.
Auto-enrolled employees who do not select a scheme, and those who ‘opt in’ to
KiwiSaver without choosing a scheme, are randomly allocated to a default scheme
provided by AMP, ASB, Mercer, OnePath or Tower (or, if their employer has chosen
a scheme for KiwiSaver auto-enrolment purposes, their employer’s chosen KiwiSaver
scheme).
After 12 months’ membership, employees can take a contributions holiday for up to
five years and can take as many contribution holidays as they like.
Employers
Employers must automatically enrol all new employees in KiwiSaver and provide
them with KiwiSaver information.
Some employers with their own work-based saving scheme are exempt from
automatically enrolling new employees in KiwiSaver, due to having a scheme that
was approved by the FMA (before November 2009) as meeting criteria including
being open to all new permanent employees and requiring a minimum overall
contribution rate of 4%.
10 Employers with their own qualifying work-based savings schemes can offset
contributions to these schemes against KiwiSaver obligations, but typically only for
employees who joined before 1 April 2008.
Employers must contribute a minimum of 2% of gross salary to their employees’
KiwiSaver schemes, rising to 3% on April 1 2013. Employers generally pay KiwiSaver
contributions in addition to salary, but a total remuneration approach is possible.
Employers send both employer and employee contributions to Inland Revenue with
PAYE payments. IRD then passes contributions on to the relevant scheme providers.
Employers are obliged to make contributions only when an employee’s account is
active, but can also voluntarily do so during contribution holidays.
Employers do not have to contribute to KiwiSaver schemes for employees under 18.
Tax and subsidies
Government provides a one-off, $1,000 kick-start contribution to a new saver’s
KiwiSaver account. This $1,000 contribution cannot be withdrawn under the
hardship provisions, nor when purchasing a first home, but is part of withdrawals
when closing a KiwiSaver account on leaving New Zealand permanently.
At KiwiSaver’s inception on 1 July 2007, Government paid an annual Member Tax
Credit (MTC) of up to $1,043 per year (which equalled $20 per week) by matching
individual contributions dollar for dollar for members aged over 18. Since July 2011,
this has been reduced to a 50c contribution for every dollar contributed by a
member, up to a maximum Government contribution of $521 per year (which equals
$10 per week). This subsidy is returned to government in cases where individuals
leave New Zealand permanently and close their accounts (from 1 July 2013, it can be
transferred to an Australian complying superannuation scheme following permanent
emigration to Australia).
Government’s payment of an annual KiwiSaver account fee subsidy of $40 has been
rescinded.
Since April 2012, employer’s superannuation contribution tax (ESCT), which is
typically the same as the employee’s marginal tax rate, has been deducted from all
employer contributions; this reduces the net amount paid into an employee’s
KiwiSaver.
The investment income earned within KiwiSaver schemes is subject to relatively
favourable tax treatment as a Portfolio Investment Entity.
Existing superannuation schemes that become KiwiSaver-compliant can access (in
relation to member contributions made on a KiwiSaver-consistent ‘locked in’ basis)
the annual member contribution subsidy but not the kick-start payment.
Lump sum payments on retirement, or earlier withdrawals, are not taxable in the
hands of recipients.
11Housing
After three years’ membership of KiwiSaver, individuals and couples who are buying
a first home (in which they will live) can withdraw their own, and their employer’s,
contributions (including any returns earned) to apply towards buying that home.
First home buyers can also receive a first home purchase subsidy of $1,000 per year
of KiwiSaver contributions (up to $5,000 each and $10,000 for a couple).
Home purchase withdrawals and the home purchase subsidy are also available to
KiwiSaver members who establish that their financial position is the same as would
be expected of a first home buyer (and who meet certain other qualifying criteria,
including income and purchase price caps, in case of the home purchase subsidy).
Forthcoming changes
The minimum rates of employer and employee contributions to KiwiSaver will
increase to 3% of gross pay in April 2013.
A planned, one-off, automatic enrolment of all qualifying employees has been
deferred without an implementation date.
The KiwiSaver Periodic Reporting Regulations, which come into force on 1 April 2013
and will first require a quarterly disclosure statement (prepared as at 30 June 2013)
in July 2013, will require fund managers to report their performance and returns,
fees and costs, assets and portfolio holdings, liquidity and liabilities, and key
personnel, along with any conflicts of interest, in a standardised format on their
websites. The aim is to enable KiwiSaver members to make direct comparisons
across funds.
12SECTION THREE: TRENDS IN MEMBERSHIP, CONTRIBUTIONS AND WITHDRAWALS
Membership
Over two million people are now members of KiwiSaver (2,048,656 at December 2012
www.KiwiSaver.govt.nz). Membership growth has started to slow and total membership
growth will slow even more as the older cohort of members withdraw from the scheme
(Graph One).
An estimated 38% of current KiwiSaver members were automatically enrolled as new
employees. The proportion of people who opt out after being auto-enrolled has
declined from 35% in 2009 to 6.2% in 2012 (IRD, 2012a; MBIE, 2012). This suggests that
should the extension of automatic enrolment to all employees, on a one off basis, go
ahead, this is likely to significantly increase KiwiSaver membership.
Graph One: Total and monthly KiwiSaver enrolments (IRD, 2012b: Figure 1)
Member characteristics
Around half of the eligible population has now joined KiwiSaver (Graph Two). The
KiwiSaver Annual evaluation report (IRD, 2012) attributes the highest membership rates
amongst 18-24 year olds as likely to be due to automatic enrolment on starting
employment. There are slightly more women (1,051.416) than men (987, 432) who are
KiwiSaver members (December 2012 www.KiwiSaver.govt.nz).
13Graph Two: Proportion of KiwiSaver members by age group over time IRD, 2012b: Figure 4)
Socio-economic status of members
There are disproportionately fewer KiwiSavers at lower income levels (below $20,000
pa), but disproportionately more KiwiSavers at incomes between $20,000 and $50,000
(Graph Three). An early survey in 2007-2008 found KiwiSaver members at that time
were less likely to be Māori or Pacific people, but more likely to hold a degree or higher
qualification (Gibson et al, 2009). A survey in 2009 found demographic profiles of
members and non-members to be similar (Colmar Brunton, 2010a). Definitive data on
the characteristics of KiwiSavers compared with the rest of the population (such as
ethnicity), as well as the factors that influenced those decisions, will come from
forthcoming analysis of data from the Survey of Family Income and Expenditure (SoFIE).
Graph Three: Income distribution of KiwiSaver members (IRD 2012b Figure 5)
Base: All members at 30 June 2012 with income for the 2011 tax year. Eligible population are those eligible to join KiwiSaver (i.e.
those who are New Zealand citizens or residents and under the age of 65 years), whether or not they have joined, with income for
the 2011 tax year. Income relates to the 2011 tax year and includes income from salary and wages (including benefit payments) and
IR3 returns (including income from self-employment, overseas income, rental income, estate, partnership or trust income and
14royalties and other income without PAYE deducted). Those members with no income for 2011 are excluded. Source: Inland Revenue
administrative data.
Gibson et al (2009) point to significant differences in the characteristics of direct
enrolees (people who are not earning wages and salaries including children and people
who opt in via their employers) and people who are automatically enrolled, and note
the importance of exploring issues for different sub-groups of the KiwiSaver population.
Population who opt out of KiwiSaver
Non-members who start employment or change jobs are automatically enrolled in
KiwiSaver and must then actively choose to opt out within eight weeks. Each year, fewer
people opt out of KiwiSaver. The IRD evaluation suggests the drop in the proportion of
auto-enrolled members who opt out indicates a broadening acceptance of KiwiSaver.
Compared with the distribution of the population enrolled automatically on taking a
new job, a slightly higher percentage of 25-44 years olds opted out. Of those who have
opted-out of KiwiSaver, around 32% have since joined KiwiSaver (IRD, 2012b). Non-
members who are self-employed, casual employees, or not in work, are not subject to
any “soft compulsion” triggers to join KiwiSaver.
Income sources of KiwiSaver members
Almost as many KiwiSaver members have opted in directly with providers (1,014,104) as
have either opted in via their employer (249,954) or been automatically enrolled by
their employer (784,598) (December 2012 data, www.KiwiSaver.govt.nz). Table One
below shows that 73% of KiwiSavers are earning some salary or wages, but some of
these may be part of the group of employees where employer contributions are not
mandatory (refer Table One). St John et al (2011) calculate that of the 3.7 million New
Zealand residents under the age of 65, about 1.7 million (46%), which is 74% of the total
labour force of 2.29 million, are potentially entitled to the employer contributions. Thus,
employees are better represented than the rest of the population.
Table One: KiwiSaver members by income source (IRD, 2012b from administrative data)
Income source Members Percentage
Salary and/or wage income only 1,080,977 55%
Salary and/or wage plus other income 353,940 18%
Other income only 83,893 4%
No income source 447,634 23%
Total 1,966,444 100%
Non-contributing KiwiSaver members
In the year to June 2012, around 75% of members who are eligible for the member tax
credit made some contributions to their account (MBIE, 2012). The 414,000 non-
contributing members are mostly those with no income and around 83,000 are on an
active contributions holiday (that is they are members via employment). The proportion
of members who had not contributed to their KiwiSaver account in the previous two
months is increasing; 23% in 2009, 40% in 2010 and 45% in 2011 (FMA, 2012). However,
15it appears most of these non-contributing members are not eligible for the member tax
credit (e.g. aged under 18) or contribute at some point during the financial year.
An IRD analysis found that there has been an increase in the number of contributions
holidays taken since the scheme began (note only employees who qualify for employer
contributions have to formally take a break in contributions – other KiwiSavers can
contribute as little or as often as they like). Most members on a contributions holiday
make some contribution to their account during this period (IRD, 2012a).
Contribution levels
The KiwiSaver evaluation provides some information on annual contributions to
KiwiSaver, which includes data for members who belonged for only part of the year.
The proportion of wage and salary earners who contribute at 2% (the lowest possible
level for employees since the minimum employee contribution rate was reduced from
4% to 2% from 1 April 2009) has grown from 41% in 2010 to 59% in 2012 (Table Two).
Table Two: Current member contribution rates – wage and salary earners (IRD, 2012b)
Contribution rate Proportion of Proportion of Proportion of members
members 2010 members 2011 2012
2% 41% 53% 59%
4% 55% 43% 36%
8% 4% 4% 4%
Other %Graph Four: Amount of MTC received by age for the year to June 2011 (IRD, 2012b: Figure10)
Base: All members at 30 June 2011 who have submitted a MTC claim and are eligible for the maximum
MTC. The maximum annual MTC members were entitled to during that year was $1,042.86 per annum up
to and including 30 June 2011.
Source: Inland Revenue administrative data.
Overall contributions by government, employers and members to KiwiSaver
Graph Five shows the different levels of annual contributions to KiwiSaver and Graph Six
shows the proportional share of contributions. The Crown’s share of contributions has
reduced from 55% in 2007/08 to 32% in 2011/2012.
Graph Five: Annual contributions to KiwiSaver $ million
3,500
3,000
2,500
voluntary
2,000 employee
employer
1,500 Crown
total
1,000
500
0
2007/08 2008/09 2009/10 2010/11 2011/12
Source: IRD annual KiwiSaver Reports
17Graph Six: Share of KiwiSaver contributions
100%
80%
60% Crown
employer
employee
40% voluntary
20%
0%
2007/08 2008/09 2009/10 2010/11 2011/12
Source: IRD annual KiwiSaver reports
Fiscal costs
In the year to 30 June 2012, the Crown contributed $1,045 million in contribution
payments to members of KiwiSaver schemes and complying funds (kick-starts to new
KiwiSaver members and member tax credits to KiwiSaver and complying funds). The
annual direct costs to the Crown are about 12% of the current costs of New Zealand
Superannuation (around $9 billion pa).
Table Three: Crown costs (years ended 30 June) ($m)
Cost 2008 2009 2010 2011 2012 Total
Payments to 572 842 970 998 1,045 4,427
members
Employer 38 206 n/a n/a n/a 244
tax credit
Total 610 1,048 970 998 1,045 4,671
Source: IRD, 2012b
Users of the first home option
Between July 2010 and September 2012 there were 9,321 first home buyers
withdrawals from KiwiSaver (IRD, 2012b). In the year to June 2012, just over $57 million
was withdrawn from KiwiSaver funds for first home purchases (FMA, 2012: Appendix
One).
18Infometrics calculated that the likely total capital value of properties purchased through
leveraging KiwiSaver was some $3 billion and notes that, given tight lending conditions,
at least some of these new home purchases would have been facilitated by the
KiwiSaver first home policies (Infometrics, 2012).
Patterns of withdrawals from KiwiSaver by members eligible to do so
Since 1 July 2012, KiwiSaver members who are 65 and who have been a scheme
member for at least five years have been able to withdraw their KiwiSaver balances.
There is no data on the value of the balances but from contributions data, IRD estimated
that over three quarters of the accounts that could be withdrawn in July and August
2012 had received between $5,000 and $20,000 in contributions with half of those
having between $10,000 to $15,000. It is also estimated that there is a small proportion
of members who have only ever had the kick start of around $1,000 and a few have
received over $35,000 in contributions (IRD, 2012b).
IRD reports that at 31 December 2012, 15,575 KiwiSaver members or a third (32.5%) of
the estimated members who are eligible to withdraw savings for retirement, had fully
withdrawn their savings and closed their KiwiSaver accounts. These figures do not
include members who have withdrawn some of the account balance and whose
KiwiSaver account remains open. Further analysis on withdrawals is forthcoming. IRD is
about to begin a survey of 1,000 KiwiSaver members who are eligible to withdraw their
funds to understand their intentions, and what underpins these. Findings are likely to be
available by May 2013. Concurrently, IRD will undertake a survey of providers to
understand more about their communication and engagement with KiwiSaver members
who are eligible to withdraw their funds.
19SECTION FOUR: THE FUNDING OF EMPLOYER CONTRIBUTIONS TO KIWISAVER
“Your employer compulsory contributions must be on top of your employee’s regular
pay. This means that if you have agreed to a total remuneration package with your
employee, the compulsory employer contributions must be paid on top of that package.
Your employee’s take-home pay should not be reduced because you are making a
compulsory contribution.
Through good faith bargaining, a salary package under an employment agreement can
be negotiated whereby compulsory employer contributions can be offset against the
employee’s gross pay.”
http://www.ird.govt.nz/KiwiSaver/employers/administering/employer-contributions
The standard approach taken by employers has been to pay employer contributions in
addition to an employee’s gross salary or wages. As is made clear in the quote above
from the IRD website, an employment agreement can be negotiated whereby a total
remuneration or “salary sacrifice” approach is taken, that is an employee receives a
fixed amount of remuneration and, if that employee is a member of KiwiSaver, the cost
of the employer contribution comes out of the employee’s pay.
To what extent are total remuneration approaches taken to KiwiSaver?
There is no standard information collected on the extent to which a total remuneration
approach is being taken to KiwiSaver. No data is collected on the use of total
remuneration approaches to superannuation within either the public service or the
wider public sector.
A survey of employers in Small and Medium Enterprises (SMEs) in 2009 found that, from
a small sample of 170 SMEs, 18 employers (11%) took a total remuneration approach to
KiwiSaver. Most employers had not changed their approach to remuneration, nor did
they intend to, as a consequence of KiwiSaver. The report notes that use of a total
remuneration approach is associated with a lower take up of KiwiSaver and the report
suggests the use of ‘salary sacrifice’ negatively impacts on the uptake of KiwiSaver
(Colmar Brunton, 2010b).
In a survey of collective employment agreements (CEAs) representing just under 20% of
all wage and salary earners, 2/3 of whom were in the public sector, 60% of workers
covered by CEAs had a provision dealing with superannuation. Only 1 in 5 CEAs included
detailed superannuation and/or KiwiSaver provision. Eighteen agreements, or only 1
percent of all the agreements surveyed, specified a total remuneration or salary
sacrifice approach. Of the 18 agreements that were specific about a total remuneration
approach, half were in the private sector and 7 in the local government sector. A much
higher proportion of this group of agreements (32%) than for the whole sample (8%)
had no wage/salary rates included in the agreement. Of those that did include wage
rates, seven out of the eighteen agreements (39%) included a minimum printed rate of
20pay below $600 per week, a lower proportion than that for the whole sample (50%) In
other words, the workers covered by these agreements were less likely to be on a gross
rate of pay under $600 per week (Industrial Relations Centre, 2013).
Total remuneration cannot lower wages below the minimum wage
In a recent employment court case, Faitala and Goff vs Terranova Homes and Care Ltd,
the plaintiffs, Faitala and Goff, were paid the statutory minimum wage of $13.50 per
hour and worked under an individual employment agreement which specified a total
remuneration approach to KiwiSaver. The gross hourly pay of both plaintiffs was
reduced to $13.24 an hour, as a consequence of their KiwiSaver membership, which the
plaintiffs considered was a breach of the Minimum Wage Act. The judgment deemed
the payment of a wage below the minimum as unlawful. It drew on the purpose of the
minimum wage being to protect vulnerable workers and enable people to meet the basic
necessities of day-to-day living (Employment Court of Wellington, 2012). The judgment also
drew attention to the confusion within the KiwiSaver legislation which talks about employer
contributions being “on top of” wages when in fact this is clearly not the case under total
remuneration.
Implications of the increase of minimum employer and employee contributions to 3%
In April 2013, the rates of compulsory employee and employer contributions to
KiwiSaver will increase from 2% to 3% of gross wages. In cases where 2% is being paid
now, an employee under a total remuneration agreement will have the additional 2%
contribution deducted from their gross pay. Where an employer pays the KiwiSaver
contribution on top of gross salary or wages, the employer will pay an extra 1% and the
employee, the other 1%.
Equity implications
Whilst the proportion of the workforce on total remuneration arrangements appears to
be low at present, there are pressures on remuneration budgets across the public and
private sectors that may lead to employers wanting to use a total remuneration
approach more often in future if they expect employer contributions to rise in the
future, and if doing so enables them to keep costs down. Both public and private sector
businesses need to find the resources to increase KiwiSaver contributions by 50% in
April 2013.
Given that most of the New Zealand workforce are on individual employment
agreements, Faitala and Goff vs Terranova Homes and Care points to the need for a
reality check around the extent to which employers may shift employees on individual
employment agreements into total remuneration arrangements where those employees
have little say over their conditions of contract.
Until recently, most agencies in the state sector received central funding to reimburse
them for the cost of employer contributions to KiwiSaver, the State Sector Retirement
Savings Scheme and the Teachers Retirement Savings Scheme. The cost of this funding
21was estimated in a report to Cabinet to be $181 million for 2010/11 with increases
expected beyond this date (Treasury and SSC, 2011). Government removed this central
funding from mid-2012 and public sector employers are now responsible for paying the
employer contributions for KiwiSaver and other superannuation funds. Whilst
associated cost pressures within the public sector were acknowledged, particularly in
health and education, these were expected to be managed on a case by case basis (CAB
Min (11) 15/16). The employment court case also raises questions for the 2013 Review
of Retirement Income Policy. In particular, it begs the question of whether budgets
within the wider public sector are sufficient to cover the employer costs of KiwiSaver for
the many low paid workers, employed by not-for-profits and private firms in the health
and education sectors, which are dependent on government-funded contracts.
KiwiSaver aimed to create a fair and attractive voluntary savings scheme for low earners
by ensuring workers are entitled to join whether they work full or part-time, that
employee contributions are set at an affordable level, that employer contributions are
compulsory and vest immediately, that the scheme is portable, and that employees are
incentivized through the opt out arrangement and tax concessions that reach their
maximum at a relatively low contribution level. The most regressive element of the
scheme, the waiving of ESCT, has been rescinded.
Tax concessions for voluntary retirement savings schemes tend to be regressive because
those who join are disproportionately higher earners and higher earners also access a
more valuable tax concession than do lower earners. Though the MTC is capped at a
relatively low level, many employees (on lower wages) do not achieve the maximum
MTC. Even without tax concessions, older style employer sponsored superannuation
schemes, such as the Government Superannuation Fund, favoured long-term career
employees via long vesting periods and a lack of portability (Dwyer, 2012).
When set up, KiwiSaver envisaged that employer contributions would be additional to
gross wages. In 2008, parliament removed prohibitions on total remuneration
arrangements negotiated in good faith after 13 December 2007. KiwiSaver members
benefit more from employers’ KiwiSaver contributions being an additional payment. For
employers, making KiwiSaver contributions “additional” can be cheaper as they only
have to provide payments to KiwiSaver members. Where employers have a strong
position in negotiations, however, taking a total remuneration approach with new
employees can reduce their future liabilities. A total remuneration approach across the
board is also likely to reduce the costs to employers from any further increases to the
level of their compulsory contributions.
However, total remuneration approaches are transparent and have been regarded as an
important tool to achieve fair remuneration. Under a voluntary retirement saving
scheme, total remuneration approaches are likely to be fairer, particularly since the
members of KiwiSaver are on slightly higher incomes on average than non-members
(Graph Three) and employer contributions to KiwiSaver are not mandatory for some of
22the lowest paid employees (e.g. workers under 18 and some casual workers). A simple
increase in minimum employer contributions to KiwiSaver members from 2% to 3% of
gross pay will widen the remuneration gap between KiwiSaver members and non-
members.
The current KiwiSaver design, where it is both voluntary to join (but where there are
specific employer contributions) and where there is the option for those contributions
to be part of total remuneration, appears to be an unsatisfactory hybrid that is at best
opaque, and at worst potentially more inequitable than a total remuneration approach.
A total remuneration approach, however, is likely to reduce the attractiveness of
KiwiSaver to all members due to the direct trade-off between wages and the employer
contribution. It is also likely to increase the attractiveness of contribution holidays.
Making KiwiSaver compulsory would effectively mean a total remuneration approach
across the board.
23SECTION FIVE: INVESTMENTS IN KIWISAVER SCHEMES
The relative significance of KiwiSaver in the managed funds sector
In September 2012, KiwiSaver made up $14,096 million of the $35,163 million assets
under fund management held in superannuation schemes and 18% of the $78,692
million total funds under management (Reserve Bank, 2013).
Graph Seven provides an overview of trends of the value of funds under management
based on data for the March and September quarters between 2004 and 2012. Whilst
funds under management declined in value between 2007 and 2009, presumably as a
consequence of the economic slowdown, they have subsequently recovered and
increased in value. Life insurance continues to decline in value. Other managed funds
(including unit trusts and group investment funds) fell in value between 2007-2009 and
have held, rather than increased value since that time. KiwiSaver funds have steadily
increased in value since its introduction in 2007 which is consistent with the growth in
members. The value of other superannuation funds has begun to grow, following a
downward trend in 2007-2009. This uplift is only slight and may be largely investment
returns-driven but might also reflect a slight increase in the attractiveness of non-
KiwiSaver work-based schemes (which offer the benefits of earlier access to funds) as a
complement to KiwiSaver, given the reduced KiwiSaver savings incentives.
Graph Seven: changes in funds under management by category RBNZ
90,000
80,000
70,000
60,000 Total assets (1+2+3)
50,000 1 Life insurance
$million
2 Superannuation
40,000
2.1 KiwiSaver
30,000
2.2 Other superannuation
20,000 3 All other managed funds
10,000
0
Source: RBNZ, 2013
24To what extent has KiwiSaver led to more personal savings and asset accumulation?
The purpose of KiwiSaver is “to encourage a long-term savings habit and asset
accumulation by individuals who are not in a position to enjoy standards of living in
retirement similar to those in pre-retirement” An initial exploration of the impact of
KiwiSaver on retirement saving, based on a nationally representative survey in early
2010 (Colmar Brunton, 2010a), found KiwiSaver members reported that, on average,
they would have saved 64% of the money they were contributing to KiwiSaver. It also
found that KiwiSaver had reached about a third of its target population and that 80% of
KiwiSaver members did not expect to have an income shortfall in retirement. The report
noted that these findings were after only three years of KiwiSaver. Further analysis of
the effects of KiwiSaver on wealth accumulation, the composition of assets and
liabilities, wealth in retirement, retirement income adequacy and target effectiveness
will be a focus of the SoFIE analysis in the KiwiSaver evaluation (Law et al, 2011).
Balances in KiwiSaver funds
At 31 March 2012, the average balance across all KiwiSaver accounts was $6,668.00 and
the average balance in a default fund was marginally lower at $6,530 (derived from FMA
data). No data source shows the distribution of balances across members by age, gender
and other factors (e.g. whether contributing or not, whether accessing employer
contributions or not). An analysis of data from three KiwiSaver providers (which is not
necessarily representative of the overall picture) shows a pattern of higher balances by
age, and higher male than female balances for those over 19 with the gap between
males and females widening with age between age 20-50 (Infometrics, 2012).
The earnings of KiwiSaver schemes
Table Four replicates Morningstar’s (an international investment data company)
summary of annual average returns to different types of KiwiSaver investment funds,
over one year to 31 March 2012, and over the previous three and five years, which
reflect the impact of the economic slowdown. A few schemes do not provide data to
Morningstar. The averages disguise variation in returns across schemes.
Table Four: KiwiSaver Peer Group Averages: Total returns % per annum Years to 31 March
2012
Fund type Assets $M 1 year 3 years 5 years
Default options 4,211.6 7.5% 5.7% 4.9%
Conservative 4,975.9 7.8% 5.8% 5.0%
Moderate 1,830.0 9.6% 6.7% 4.4%
Balanced 2,223.8 11.6% 6.2% 2.6%
Growth 2,028.5 13.1% 6.4% 1.2%
Aggressive 851.9 12.6% 4.7% 0.0%
Source: Morningstar, 2012
For individuals, net earnings will be affected not just by the fund selected but by
contribution levels, breaks in contributions, fees and access to employer contributions
25and the MTC. As is the case with balances, there is no information currently about the
distribution of earnings for individual groups of KiwiSaver members.
There may be elements of the current KiwiSaver design and management that are
barriers to the best returns to KiwiSaver accounts. Issues include the Reserve Bank’s
different treatment of cash in bank accounts and KiwiSaver accounts, and whether there
is too much flexibility for members to move from scheme to scheme.
Regulation and oversight of KiwiSaver schemes
The New Zealand KiwiSaver scheme is based on a competitive market of KiwiSaver
providers, including default providers for those who are automatically enrolled and have
not actively selected a provider, as well as the option to switch providers at any time.
There is no government guarantee that KiwiSaver accounts will retain their value, let
alone grow. The discipline on KiwiSaver providers comes from: the government’s
Financial Markets Authority (FMA) which is responsible for the administration,
compliance monitoring and enforcement of the KiwiSaver Act; self-management and
disclosure by KiwiSaver providers, and market pressure from KiwiSaver clients. The
Reserve Bank’s capital market regulations also impact.
FMA role
Via the Financial Markets Authority Act 2011, the FMA has a broader mandate to
promote and facilitate the development of fair, efficient, and transparent financial
markets, strengthen the public’s confidence in New Zealand financial markets, promote
innovation and grow New Zealand’s capital base. The FMA requires annual statistical
information from all KiwiSaver schemes. It engages with individual KiwiSaver scheme
managers and advisers around trust deed issues. This includes, for example, ensuring
that schemes comply with obligations such as fees to be “not unreasonable” through
providing guidance notes and requiring schemes to advise FMA of increases in fees. The
FMA determines which employers have exempt status, and determines the funds that
have Complying Superannuation Fund status. The FMA manages the Default Monitoring
Panel, which supervises the six default KiwiSaver schemes which have a specified fee
regime and investment strategy.
KiwiSaver Periodic Reporting Regulations
The KiwiSaver Periodic Reporting Regulations, which are due to come into force on 1
April 2013 and will first apply with respect to the 12 months ended 30 June 2013, will
require fund managers to report their performance and returns, fees and costs, assets
and portfolio holdings, liquidity and liabilities, and key personnel, along with any
conflicts of interest, in a standardised format on their websites. The aim is to enable
KiwiSaver members to make direct comparisons across funds. Currently, the main
provider of regular statistics on most KiwiSaver providers – including the value of their
funds under management, returns for each of their schemes, expense ratio, fees and
market share is Morningstar. CFLRI has data on fees within one of its calculators on the
Sorted website https://www.sorted.org.nz/calculators/KiwiSaver-fees
26Default providers and the rules governing default funds
Default fund members
At 31 March 2012 there were 1.9 million KiwiSaver members of whom 447,274
members (24%) were in one of the default funds. In addition, 93% of the 178,000
members in their employer-chosen scheme are in the default option of that scheme.
Excluding those aged 17 and under, 42% of default members are non-contributing
compared with 31% of active-choice members (MBIE, 2012). The default options are
more conservative than other KiwiSaver conservative portfolios and hold around 80% of
their assets in fixed interest or cash. Assets of the default funds were worth 23% of the
value of all KiwiSaver assets under management at 31 March 2012 (FMA, 2012:
Appendix one) thus are, on average, of a similar value to other KiwiSaver funds. As
shown in Graph Eight, 18-35 year olds are more likely to be in the default funds than
other age groups.
Graph Eight: distribution of default fund members by age (MBIE, 2012 from FMA, 2012)
Default provisions after 2014
The default provider arrangements for KiwiSaver are under review. Key issues under
consideration are the objectives of the default schemes and whether these should
change, the best design to achieve the desired objectives and the most appropriate
institutional arrangements and transition.
New Zealand is not alone in considering what might be the most appropriate default
fund arrangements for automatic enrolment or compulsory savings schemes. In
particular, several countries have in place, or are considering, default arrangements that
mandate a life-cycle or “age appropriate” investment for the savings of default fund
members with a view to gaining better investment returns for individuals and to better
27You can also read