Estimates of multidimensional poverty for India using NSSO-71 and -75 - WIDER Working Paper 2021/1 - UNU-WIDER
←
→
Page content transcription
If your browser does not render page correctly, please read the page content below
WIDER Working Paper 2021/1

Estimates of multidimensional poverty for India
using NSSO-71 and -75

Venugopal Mothkoor* and Nina Badgaiyan*

January 2021

Abstract: We measure multidimensional poverty in India using National Sample Survey
Organization data from 2014–15 to 2017–18. We use income, health, education, and standard of
living to measure the MPI. The MPI headcount declined from 26.9 to 13.75 per cent over
the study period. The all-India estimates indicate that 144 million people were lifted from
poverty during this period. We include different health dimensions, factoring in insurance,
institutional coverage, antenatal care, and chronic conditions. Income is the dominant
instrument with the highest contribution to the MPI, followed by insurance. Cooking,
sanitation, and education also have significant weights. The decline in deprivation is steeper in
rural areas than urban areas. Our state-level estimates reveal that 20 states report less than 10 per
cent headcount poverty, up from six states. COVID-19 may lead to reversals of these gains,
with poverty rising to pre-2014–15 levels, rising more steeply in rural areas.
Key words: MPI, income, poverty, India, deprivation, rural, urban, COVID-19
JEL classification: I14, I30, I32, I38
Disclaimer: The views expressed in this paper are those of the authors, and do not necessarily
reflect the views of Niti Aayog.

* Niti Aayog, New Delhi, India; corresponding author: venu.mothkoor@govcontractor.in
This study has been prepared within the UNU-WIDER project Addressing group-based inequalities.
Copyright © UNU-WIDER 2021
UNU-WIDER employs a fair use policy for reasonable reproduction of UNU-WIDER copyrighted content—such as the
reproduction of a table or a figure, and/or text not exceeding 400 words—with due acknowledgement of the original source,
without requiring explicit permission from the copyright holder.
Information and requests: publications@wider.unu.edu
ISSN 1798-7237 ISBN 978-92-9256-935-8
https://doi.org/10.35188/UNU-WIDER/2021/935-8
Typescript prepared by Gary Smith.
United Nations University World Institute for Development Economics Research provides economic analysis and policy advice
with the aim of promoting sustainable and equitable development. The Institute began operations in 1985 in Helsinki, Finland, as
the first research and training centre of the United Nations University. Today it is a unique blend of think tank, research institute,
and UN agency—providing a range of services from policy advice to governments as well as freely available original research.
The Institute is funded through income from an endowment fund with additional contributions to its work programme from
Finland, Sweden, and the United Kingdom as well as earmarked contributions for specific projects from a variety of donors.
Katajanokanlaituri 6 B, 00160 Helsinki, Finland
The views expressed in this paper are those of the author(s), and do not necessarily reflect the views of the Institute or the United
Nations University, nor the programme/project donors.
1      Introduction

Poverty manifests itself in multiple ways and hence needs to be measured by a composite index that
looks at multiple dimensions. The root cause of these multiple deprivations could be shortfalls in in-
come, but sometimes income may not be translated into meeting basic needs (Sen 1980). Poverty is
associated with deprivation in other areas, such as health, education, and other social characteristics.
Therefore, a multidimensional approach is more practical and insightful for measuring poverty. The
multidimensional poverty index (MPI) goes beyond the traditional focus on measuring poverty using in-
come by capturing multiple deprivations experienced by poor people. Its power lies in the unique ability
to show not only who is poor, but also how they are poor, in terms of living standards, education, and
health. As a result, it takes care of the shortcomings of measuring poverty using income. The MPI is an
indicator of acute multidimensional poverty that is measured by two indices: the percentage of people
who are poor, or the incidence of poverty (H), and the average share of deprivations (or percentage of
possible deprivations) that poor people experience, which is the intensity of poverty (A). The product of
those two indices—incidence and intensity—is the MPI.

Researchers and economists have started emphasizing the multidimensional aspects of poverty, and
this approach has gained prominence within the United Nations Development Programme (UNDP) and
Oxford Poverty & Human Development Initiative (OPHI), which have released a global ranking of MPI
for 100+ countries (Bourguignon and Chakravarty 2003; Tsui 2002). The MPI also has advantages over
the Human Development Index (HDI) in terms of capturing many more indicators. The HDI is a macro
approach, measuring well-being at the country level, whereas the MPI uses household-level data that
is then aggregated at the country level. This leads to efficient utilization of available information and
minimization of information loss. The UN Sustainable Development Goals (SDGs) aim for elimination
of poverty, which can only be possible if we identify who are poor and, crucially, how these people can
exit poverty. The MPI provides information on both who are poor and what can be done to reduce their
poverty (Lemanski 2016).

The MPI allows countries to identify gaps for relevant policy interventions. The MPI can show how
the composition of multidimensional poverty changes for different regions, rural/urban areas, by caste
and ethnic group, and so on, with useful implications for policy-making. Our framework builds on the
existing literature that has highlighted multidimensional aspects rather than one-dimensional poverty
line measures.

Alkire et al.’s (2018) study captures changes in the MPI from 2005–06 to 2015–16 using NFHS-3 and
NFHS-4 (National Family Health Surveys) and finds that India reduced multidimensional poverty from
54.7 per cent in 2005–06 to 27.5 per cent in 2015–16. Over the years, the central government has
launched a series of social sector schemes such as Swachh Bharat Mission (SBM), Pradhan Mantri Awas
Yojana (PMAY), Rashtriya Swasth Bima Yojana (RSBY), Sarva Shiksha Abhiyan (SSA), the Public
Distribution System (PDS), and the Mahatma Gandhi National Rural Employment Guarantee Scheme
(MGNREGS). Particularly, over the last 6–7 years, the expenditure on these social sector schemes as a
proportion of gross domestic product (GDP) has increased from 6.2 per cent to 7.7 per cent (Department
of Economic Affairs 2020). These schemes aim to address poverty in its multiple dimensions. Their
impacts cannot be captured by changes in levels of poverty defined in expenditure terms alone. The
MPI is likely to more successfully capture the impact of such policies. However, there is no research
study that captures the change in MPI over the last few years. It is hoped that this study will provide
insights to policy-makers through the changes in various components of the MPI on what more needs to
be done to address the problem of poverty. The study investigates changes in multidimensional poverty
in India from 2014–15 to 2017–18, using data from the National Sample Survey Office (NSSO) 71st
and 75th round surveys on health, education, and consumption expenditure. The four major categories
of indicators used in the study to measure MPI are standard of living, education, health, and income.

                                                   1
This study differs from the traditional approach to computing MPI, which used NFHS data, due to the
unavailability of the latest round of this source. We calculate the MPI for rural and urban areas separately
to provide further insights on policy gaps that need to be filled in these areas.
The study proceeds as follows: Section 2 reviews the literature on the MPI. Section 3 presents our
approach and methodology. Section 4 presents the data and Section 5 presents the results on changes
in multidimensional poverty over time and across rural/urban areas. In Section 5 we also discuss the
changes in the MPI due to change in the indicators included in its construction. Section 5 also measures
changes in poverty due to income shocks induced by COVID-19. Section 6 concludes the paper.
2 Literature review
Many frameworks have been in vogue for measuring the MPI, including human rights, livelihoods, so-
cial inclusion, basic needs, social protection, and capabilities (Alkire et al. 2014). Today, many countries
measure multidimensional poverty alongside monetary poverty. The MPI emerged as a powerful tool
and is used by more than 18 countries to monitor poverty reduction (UNDP and OPHI 2019). While
the focus of monetary poverty continues to be understanding the changes in income/consumption, MPI
estimates supplement this by measuring changes along other dimensions such as food insecurity, illiter-
acy, unemployment, housing, and health. Though there exist several arguments to include dimensions
such as human rights, livelihoods, violence, and social inclusion in MPI estimation, often there is neither
consensus on nor availability of such data. However, there exists strong international consensus on the
ten indicators across the three dimensions of health, education, and income used in current MPI estima-
tion. Data are usually available for most countries at reasonable time intervals for these ten indicators.
This also makes cross-country comparison feasible. These ten indicators across three dimensions also
mirror the HDI (Santos and Alkire 2011). Today, the measurement of multidimensional poverty using
a comprehensive list of ten indicators is a significant improvement over the first estimates developed by
Townsend (1979) and Foster et al. (1984). The strength of the index lies in its ability to disaggregate the
MPI across several groups and ensure that no region is left behind. It is also an instrument for monitoring
a country’s progress in terms of achieving the SDGs (UNDP and OPHI 2019).
The inherent flexibility in MPI design in terms of dimensions, weights, and indicators makes it a useful
and powerful tool for customizing to the individual national context (UNDP and OPHI 2019). the
UNDP and OPHI used NFHS data to measure the MPI for India. Because the latest NFHS-5 data are
not available, these MPI calculations are out of date (Gold et al. 2019). There exist several studies
that used NSSO data for MPI measurement. Our study also uses NSSO data, which is available for
as recently as 2017–18. Our study will augment similar research that uses NSSO data to measure MPI
(Chaudhuri et al. 2017; Dehury and Mohanty 2015; Kumar et al. 2015; Sarkar 2012; Tripathi and Yenneti
2019). This study estimates the MPI using four dimensions—health, education, income, and standard
of living—for each household in both rural and urban areas using NSSO data from the NSSO 71st
(2014–15) and 75th rounds (2017–18). The lack of data on assets, electricity, and housing is adjusted
by inclusion of an income dimension (using monthly per-capita consumption expenditure (MPCE) as a
proxy) in the analysis.
In using consumption expenditure data as the proxy indicator for income, this study allows the poverty
measure to be more sensitive to economic fluctuations than the current version of the international MPI,
which uses asset ownership as a proxy for deprivation in living standards. This not only addresses one
of the criticisms of the MPI (Ravallion 2010), but also makes the MPI more relevant to India, where
poverty is understood as a consumption shortfall in essential goods and services. This is similar to the
approach used by Tripathi and Yenneti (2019). Many iterations were carried out, considering various
2indicators of health to be included in the index. The variables included in the index are also guided by
the methodology followed for the MPI across different countries (UNDP and OPHI 2019).
This study also measures changes to the MPI due to income shocks, in order to account for the effects
of the COVID-19 pandemic. This study’s approach to measuring changes in MPI by inducing income
shocks is based on a similar study done with reference to the Indian context (Saini 2020).
We adopt Santos and Alkire’s (2011) methodology for measuring the MPI. Under this methodology,
first, household deprivation is estimated based on comparison to benchmark standards. Second, the
deprivations are added based on the assigned weights to calculate the cumulative score. Last, this cu-
mulative score is compared with the agreed poverty cutoff level to determine whether the household is
multidimensionally poor or not.
3 Approach and methodology
3.1 Estimation of MPI
As stated in the previous section, the MPI is designed to track ten deprivations across the three di-
mensions of health, education, and standard of living. This study uses Santos and Alkire’s (2011)
methodology to calculate MPI using health schedules from the (NSSO 71st and 75th rounds. The recent
study by Tripathi and Yenneti (2019) also uses the NSSO-61 and -68 schedules to measure changes
in MPI in India using nine indicators across the three dimensions of standard of living, education, and
income. Before discussing the indicators used in this study, here we detail the methodology used in MPI
computation.
First, the computation of the index requires identification of various indicators used in its construction.
Second, indicator value X for each household i is compared against the deprivation cutoff level for that
indicator Zd. If Xi is less than Zd, then the household is considered to be deprived in indicator X.
Deprivation cutoffs are based on international agreed standards:
di =1 if Xi ≤ Zd , where household i is considered to be deprived in indicator X when the indicator value
is below the threshold value of indicator d.
di =0 if Xi > Zd , where household i is considered to be not deprived in indicator X when the indicator
value exceeds the threshold value of the indicator.
Third, weights Wi are assigned to the indicators used in the index. Fourth, a weighted deprivation score
of each individual i is calculated as the weighted sum of deprivations across n indicators:
i=n
Ci = ∑ (Wi ∗ di )
i=1
i=n
∑ Wi=1 =1
The weights across n indicators add up to 1. Ci indicates a cumulative deprivation score for individual i
across n indicators.
Fifth, Santos and Alkire’s (2011) methodology calls for comparing the cumulative score against the
second cutoff to determine whether individual i is multidimensionally poor or not. For Ci > k, individual
i is considered to be multidimensionally poor. Internationally, a second deprivation cutoff is set for
the value of 13 , which essentially translates to a deprivation score of more than one-third meaning the
3household is considered to be multidimensionally poor:
1
ci (k) = 1 if Ci > or else ci (k) = 0
3
Sixth, calculation of the MPI requires two critical pieces of information: (1) the proportion of people
who are experiencing multiple deprivations (i.e. ci (k) = 1); and (2) the intensity of deprivation experi-
enced by the people. The first piece of information, also known as headcount poverty, is determined by
total number of individuals across the population who are multidimensionally poor:
j=p
Headcount = ( ∑ (m)
j=1
where p is the number of households among the total households where ci (k) = 1, and m is the household
size in each multidimensionally poor household j.
The headcount poverty ratio is calculated as the ratio of the number of members from the households
who are multidimensionally poor to the total population under consideration. The intensity of poverty is
the ratio of the weighted sum of the multidimensionally poor population to the total population who are
classified as multidimensionally poor:
hc
H=
t
where hc is the total headcount of the multidimensionally poor population and t is the total popula-
tion.
The intensity of poverty A is
k=p
∑ Ci ∗ m
A = k=1
hc
where the numerator indicates the cumulative poverty score of all the multidimensionally poor house-
holds, m is the household size, and hc is the number of people in the multidimensionally poor house-
holds.
Last, the MPI is calculated as the product of the proportion of people who experience deprivation to the
intensity of deprivation:
MPI = H ∗ A
To conclude, the deprivation score created for each individual shows the indicators one is deprived of.
For example, in the standard MPI definition, if a household has no member who has completed six years
of schooling or a child not attending school up to the age at which one would complete class eight, then
the household is considered to be deprived in education indicators. Similar such conclusions are drawn
for standard of living and health dimensions. The household deprivation score is then calculated as the
weighted sum of the deprivation score across three dimensions. If a person scores more than one-third or
more in the weighted score, they are considered to be multidimensionally poor. Finally, the information
is aggregated into the MPI, which is the product of the poverty rate and intensity of poverty.
3.2 Decomposition of MPI
The percentage contribution of each indicator to overall MPI has been computed to analyse the impact
on overall deprivation. The formula used is:
∑ Wi ∗CHi
Contribution of indicator i to MPI = × 100
MPI
where CHi is the censored headcount ratio which is calculated as the ratio of the number of multidimen-
sionally poor deprived in indicator i to the total number of households surveyed, and Wi is the weight
given to indicator i.
44 Data
This study uses two rounds of the NSSO health schedule data for the years 2014–15 (NSSO-71) and
2017–18 (NSSO-75) to compute the MPI. NSSO-75 covers 113,822 households while NSSO-71 sched-
ule covers 65,932 households. Both surveys adopt a multi-stage stratified design with census villages in
rural areas and blocks in urban areas as the first-stage unit (FSU) for sampling. The ultimate-stage units
(USUs) in both surveys were households. The summary of households surveyed across both rural and
urban regions is summarized in Table 1.
Table 1: Sample size
Year No. rural HHs No. urban HHs Total HHs
2014–15 (NSSO-71) 36,480 29,452 65,932
2017–18 (NSSO-75) 64,552 49,270 113,822
Note: HH, household.
Source: authors’ compilation based on data from NSSO-71 and -75.
Based on the data available in NSSO-71 and -75 health survey schedules, indicators are selected across
four dimensions: standard of living, income, health, and education. In line with Tripathi and Yenneti’s
(2019) study, income is included as a separate dimension instead of grouping it with the other indicators
under the standard of living dimension. The MPCE captured in the NSSO surveys proxies for income.
Meyer and Sullivan’s (2003) study also advocates for use of consumption instead of income when mea-
suring poverty. In line with such arguments, this study uses MPCE as a proxy measure for income. The
cutoffs for indicators are based on the literature (Alkire and Foster 2011; Tripathi and Yenneti 2019).
The cutoff for whether an individual is income-deprived or not is based on the Tendulkar Committee
report, where state-wise poverty estimates for 2004–05 are adjusted for inflation to determine the cutoff
for 2014–15 and 2017–18. If household MPCE is less than the state poverty cutoff, then the household is
considered to be income-deprived. The cutoff and indicators used in MPI construction are summarized
in Table 2.
The study also computes the MPI by changing the individual indicators included under the four dimen-
sions included. Throughout the four models used in this study, there is no change in the indicators under
standard of living and MPCE dimensions. Models 1, 3, and 4 retain the same dimensions in education
dimension, which is years of schooling and attendance rate, while Model 2 replaces these two variables
with a single variable: highest education in the household. Model 3 retains the same variables as Model 1
in all three dimensions of standard of living, education, and income, while the health dimension includes
three new indicators: antenatal care, institutional delivery, and insurance. Lastly, Model 4 replaces the
health dimension variables with insurance and chronic conditions, compared to Model 1 variables of
child mortality and under-nutrition.
5Table 2: List of indicators used in construction of MPI
Dimension Indicator Cutoff description Model 1 Model 2 Model 3 Model 4
Sanitation Deprived if there is no latrine facility in the household Ø Ø Ø Ø
Standard of living Cooking Deprived if cooking fuel is other than LPG, other natural gas, and electricity Ø Ø Ø Ø
Drinking water Deprived if drinking water is from an unprotected source Ø Ø Ø Ø
Years of schooling Deprived if there is not at least one member in the household with six years of schooling Ø × Ø Ø
Education Attendance Deprived if school-going children (aged under 15) are not completing age-appropriate grades Ø × Ø Ø
Highest education in the household Deprived if at least one member in the household has not completed primary and above education × Ø × ×
Child mortality Any child death in the last year within the household Ø Ø × ×
Health
Under-nutrition Self-reported nutritional status of household in NSSO survey Ø Ø × ×
Antenatal care Deprived if pregnant women members within the household did not receive any antenatal support × × Ø ×
Institutional delivery Deprived if place of delivery is outside the institutional system × × Ø ×
Insurance Deprived if no one in the family has access to either public or private insurance × × Ø Ø
Chronic condition Deprived if any member in the family suffers from a chronic condition × × × Ø
Income MPCE Deprived if MPCE is below the Tendulkar Committee poverty cutoff computed for the state Ø Ø Ø Ø
Source: authors’ compilation.
6The data on electricity, housing, and assets are not available in NSSO-71 and -75 health schedules and
therefore not included in the construction of the MPI. Due to the differences in the ways the indicator
information is recorded in the NSSO surveys, the results are an underestimate of the reality. The various
differences include: (1) NSSO-71 does not capture whether sanitation facilities are exclusive or shared.
As a result, we use only the type of sanitation facility to maintain consistency in results across both
survey periods. Though the NFHS used by the UNDP and OPHI uses access information as well, due
to lack of such data, we restrict the deprivation measurement to only availability of sanitation facili-
ties; (2) the UNDP and OPHI measure drinking water deprivation in terms of access to drinking water
within a distance of a 30-minute walk (round trip). However, neither NSSO survey round measures
distance to a drinking water source. NSSO-75 captures whether a source is unprotected and NSSO-71
captures whether a source is a river or other non-clean water sources; (3) the UNDP and OPHI measure
child mortality by taking into account child deaths in the last five years in the household. However,
NSSO-71 and -75 record death of only the last year; (4) the UNDP and OPHI measure under-nutrition
based on body mass index (BMI), while due to lack of such data in the NSSO rounds, this study uses
self-reported diagnosis of under-nutrition collected from both in-patient and out-patient data among the
households.
Due to the issues discussed above, we also consider different variables suggested in the literature, such
as insurance, institutional delivery, antenatal care, and chronic conditions under the health umbrella
(UNDP and OPHI 2019). This study therefore constructs four models to estimate MPI. Table 2 also
summarizes the models and corresponding variables used to calculate the MPI.
The study assigns equal weights to all four dimensions (i.e. one-quarter). Further, each indicator under
the dimension is also given equal weight. As income has no sub-indicators, one-quarter weight is given
to income. With the inclusion of two indicators in health and education under Models 1 and 4, the
weighted score of each indicator under these dimensions is 14 × 12 = 18 . With inclusion of three indicators
in standard of living, the weighted score of each indicator under this dimension is 14 × 13 = 12
1
. In Model
2, since a single variable is used to proxy education, the weight assigned is one-quarter. Also, in Model
3, each health indicator is assigned a weight of 14 × 13 = 12
1
. The weights for Models 3 and 4 are provided
in Appendix Tables A1 and A2, respectively.
5 Results
5.1 Standard national level MPI estimates
The deprivation distribution across individual indicators is summarized in Table 3. At 82 per cent, the
deprivation in access to insurance is very high in 2014–15 and 2017–18. This is despite the launch
of RSBY in 2008 to provide insurance cover to the BPL (below poverty line) population, construction
workers, railway porters, street vendors, and domestic workers. The enrolment under the scheme was
only about half of its target of 70 million households. The Ayushman Bharat Scheme—to address the
high deprivation gap in access to insurance—took off effectively in 2018. It aims to provide INR0.5
million annual insurance coverage to 107.4 million of the population in 2018–19 (Kalbag 2018). The
impact of this scheme on MPI is not covered here since it was launched after the end of the period under
study.
Almost 65.59 per cent of households were deprived of access to safe cooking in 2014–15. Pradhan
Mantri Ujjwala Yojana (PMUY), launched in 2016, aimed to provide free LPG gas connections to 80
million poor households by March 2020, and achieved its target in September 2019 (Press Trust of India
2019). This notable achievement is reflected in a decline in deprivation due to having cooking gas from
65.59 per cent (2014–15) to 44.34 per cent (2017–18).
7A total of 42.39 per cent of households lacked access to sanitation in 2014–15. The government’s flag-
ship scheme, Swachh Bharat, announced in 2014, led to massive improvements in access to sanitation,
with over 102 million toilets constructed between October 2014 and July 2020. Also, since 2019–20,
there has been near-universal access to sanitation facilities across the country. This noticeable achieve-
ment is partly reflected in the improvement in sanitation over 2014–15 to 2017–18, where deprivation
almost halved from 42.39 per cent to 23.61 per cent.
Until the late 2000s, the standard poverty estimates in India were calculated based on the Tendulkar
Committee cutoffs. Since then, the focus has gradually shifted towards socioeconomic determinants of
poverty. The Government of India launched several schemes in the last decade to address these deter-
minants and alleviate poverty. It was found that 30 per cent of households lived in poverty in 2014–15
when following Tendulkar Committee estimates. Deendayal Antyodaya Yojana–National Rural Liveli-
hoods Mission (DAY-NRLM), launched in 2011, aims at promoting multiple livelihoods for rural poor
household by organizing them into self-help groups,building their capacities, and facilitating livelihood
plans. As of March 2017, 386 million households from 29 states and 5 union territories have been mo-
bilized into 3.25 million self-help groups (SHGs). The Institute of Rural Management Anand’s (2017)
study found that household incomes in areas where DAY-NRLM was implemented was 22 per cent
higher than those in control areas. Similar such missions were also launched in urban areas. Deendayal
Antyodaya Yojana–National Urban Livelihoods Mission (DAY-NULM) aims at universal coverage of
the urban poor for skill development and credit facilities. As a result of the DAY-NULM mission, 1.42
million livelihood options, 1.06 million candidates, and 0.45 million SHGs have been formed (NULM
2020). The Jan Dhan, Mobile, and Aadhaar (JAM) trinity helped the government reduce leakages in
public delivery systems and provided more fiscal space for need-based interventions. The cumulative
savings due to the JAM trinity is estimated to be in the range of 1.25 lakh crore as of 2018–19 (IBEF
2018). Under MGNREGS, the number of days of guaranteed employment increased from 100 to 150
days. Pradhan Mantri Krishi Sinchayee Yojana (PMKSY; Per Drop More Crop), Pradhan Mantri Fasal
Bima Yojana (PMFBY), and Soil Health Card and e-National Agricultural Market (e-NAM) are a few
schemes launched by the government in the last few years to increase farmers’ incomes (Department of
Economic Affairs 2020). As a result of several such interventions, income deprivation fell from 30.02
per cent to 19.1 per cent in 2017–18.
Sarva Shiksha Abhiyan (SSA), the National Programme of Mid Day Meals (MDM), and Rashtriya Mad-
hyamik Shiksha Abhiyan (RMSA) are some of the flagship schemes implemented by the government to
improve years of schooling and attendance rates. SSA, with the legal backing of the Right to Education
(RTE) Act, aims to universalize elementary education, while MDM incentivizes the same age group
covered by SSA to promote enrolment, retention, and attendance rates. RMSA, on the other hand, aims
to achieve universal access to secondary education. The result of such interventions was average years
of formal schooling for those 15 years and older reaching 9.7 years in 2017–18 and an attendance rate
of nearly 94 per cent for the 6–14 age group. The result of such interventions can also be seen in the
decline of deprivation on account of years of schooling from 11.1 per cent (2014–15) to 7.93 per cent
(2017–18) and attendance rate from 7.28 per cent (2014–15) to 5.47 per cent (2017–18).
There is near-universal access to drinking water across both time periods, hence there is no deprivation
observed in drinking water access. NSSO-71 does not capture information on whether drinking water
access is within 30 minutes’ walking distance of the household. As a result, the estimates in this study
from NSSO-71 and -75 may be underestimates. The evidence from secondary literature indicates that
only 19 per cent of households in the country have access to less than 40 litres per day, while 4 per cent
have water quality issues. Realizing such a gap, the government launched the Jal Jeevan Mission in 2019
to provide individual tap connections to every household (PRS 2020a).
The National Rural Health Mission (NRHM) launched in 2005 has a commitment to reduce infant and
maternal mortality rates (IMR and MMR respectively) and improve the health status of rural populations.
8On the urban side, the National Urban Health Mission (NUHM) launched in 2013 has the objective of
improving the health status of urban populations, especially the urban poor. The two programmes were
subsumed into the National Health Mission (NHM) in 2013. Over 10.33 lakh accredited social health
activists (ASHAs) are deployed across the country, who serve as the first port of call for community
health services. There are 82,512 auxiliary nurse midwives (ANMs) and 54,414 staff nurses (SNs),
who act as skilled attendants for supporting institutional delivery. Incentive mechanisms such as Janani
Suraksha Yojana (JSY) and Janani Shishu Suraksha Karyakram (JSSK) have been instrumental in in-
creasing institutional delivery, increasing antenatal care visits, and decreasing the under-five mortality
rate (Ministry of Health and Family Welfare 2019). The deprivation observed on these three dimensions
is below 2 per cent, reflecting an impressive performance. Under-nutrition as measured in the NSSO
surveys is self-reported rather than based on standard benchmarks. Therefore, this may not reflect the
true nutritional status of households. The study instead models another variable, the presence of chronic
conditions within households. The number of people suffering from chronic conditions declined from
17.68 per cent (2014–15) to 12.85 per cent (2017–18). This can be notably attributed to several interven-
tions under NHM and comprehensive primary healthcare under the Ayushman Bharat Scheme launched
by the government.
Table 3: Number of households deprived in various dimensions (%)
Indicator NSSO-71 (2014–15) NSSO-75 (2017–18)
Income 30.02 19.1
Sanitation 42.39 23.61
Cooking 65.59 44.34
Drinking water 1.22 1.61
Child mortality 0.2 0.06
Under-nutrition 0.06 0.05
Years of schooling 11.10 7.93
Attendance rate 7.28 5.47
Insurance coverage 82.67 82.7
Antenatal care 1.39 0.79
Institutional delivery 2 0.78
Chronic ratio 17.68 12.85
Source: authors’ compilation based on data from NSSO-71 and -75.
The MPI index constructed using the four models described in Table 2 are summarized in Appendix
Table A4. Models 2 and 3 described in Table 2 are not part of the discussion in the study due to their
insignificance. The results of Models 1 and 3 along with NFHS-4 estimates are captured in Table 4. The
results of Model 1 reveals that over 26.9 per cent of the Indian population was multidimensionally poor
in 2014–15 and this fell by almost half to 13.75 per cent in 2017–18. The results for 2014–15 using
NFHS-4 estimates puts the multidimensionally poor at 27.5 per cent, which is close to the 26.9 per cent
estimated using NSSO data, indicating the robustness of the estimates. In terms of the absolute number,
the number of multidimensionally poor fell from 301 million in 2014–15 to ~157 million in 2017–18 as
per Model 1. The intensity of poverty did not, however, see such a steep decline, with a marginal fall
from 42.8 per cent in 2014–15 to 40.9 per cent in 2017–18. As a result, the MPI fell from 11.5 per cent
in 2014–15 to 5.6 per cent in 2017–18.
Table 4: MPI results (%)
Indicator NFHS-4 Model 1 Model 4
NSSO-71 NSSO-75 NSSO-71 NSSO-75
Headcount poverty (H) 27.5 26.9 13.75 41.62 26.4
Intensity of poverty (A) 43.9 42.8 40.91 49.11 45.4
MPI = H * A 12.1 11.5 5.6 20.44 11.97
Source: authors’ compilation based on data from NSSO-71 and 75, and NFHS-4.
9The study re-estimated the MPI using two different health variables, insurance coverage and chronic
conditions, described as Model 4. A household is considered to be deprived if there is one member in
the household with a chronic condition. Indicators and weights are summarized in Appendix Table A2.
Model 4 reveals that headcount poverty fell from 42.6 per cent in 2014–15 to 27.11 per cent in 2017–18.
In absolute numbers, 165 million people are pushed out of poverty using Model 4 compared to 144
million in Model 1. Using different measurements, the number of people who are pushed out of poverty
is in the range 144–165 million. On average, the poor continue to suffer in almost half of the weighted
indicators. The MPI fell from 21 per cent in 2014–15 to 12 per cent in 2017–18.
The results of MPI estimates across rural/urban areas are summarized in Figure 1. Using Model 1,
headcount poverty fell in urban areas by more than three-quarters compared to rural areas, where poverty
fell by a little less than half. Headcount poverty in rural areas declined from 32.4 per cent (2014–15) to
18.13 per cent (2017–18) while it declined more rapidly in urban areas from 13.75 per cent (2014–15)
to 3.2 per cent (2017–18). Intensity of deprivation largely remains at 40 per cent across rural and urban
areas. The MPI fell by almost half from 14.1 per cent (2014–15) to 7.4 per cent (2017–18) in rural
areas, while it fell from 5 per cent (2014–15) to 1.3 per cent (2017–18) in urban areas. In contrast, using
Model 4, headcount poverty in rural areas fell by almost one-third from 47.9 per cent (2014–15) to 32.1
per cent (2017–18), while it fell by more than half in urban areas, from 26.9 per cent(2014–15) to 12.7
per cent (2017–18). Decline in intensity of poverty is only marginal in both rural and urban areas. As a
result, MPI fell by almost two-fifths in rural areas and around half in urban areas. The results of Models
1 and 4 show that poverty is more concentrated in rural areas than urban areas.
Figure 1: MPI rural/urban estimates
Source: authors’ compilation based on data from NSSO-71 and -75.
The results in Table 5 present the contribution of each indicator to MPI. Income continues to be a dom-
inant indicator of MPI across the two models, followed by insurance and cooking. The contribution
of the sanitation indicator ranges from 8 to 13 per cent in different models, while education indicators
contribute 10–11 per cent. Child mortality and under-nutrition did not show any significant contribu-
tion. This could also be due to measurement differences of these indicators in NSSO surveys or low
deprivation. One-quarter of the MPI is determined by insurance, while 5 per cent is by chronic condi-
tions. Looking at the results from Models 1 and 4, policy efforts should predominantly focus on income
generation, health insurance, and access to safe cooking—more so in rural areas. These three indicators
contribute to almost three-quarters of the MPI. The Government of India’s Ayushman Bharat Scheme,
launched in 2017 to address insurance deficiency, and Ujwala Scheme, to provide cooking gas to BPL
families, are steps in the right direction. The subsequent rounds of NSSO surveys are likely to show
positive performance in bringing down the MPI further.
10Table 5: Contribution of indicators to the MPI (%)
Indicator Model 1 Model 4
NSSO-71 NSSO-75 NSSO-71 NSSO-75
Income 56.3 58.34 35.76 36.5
Sanitation 13.53 11.39 10.17 7.95
Cooking 18.58 17.52 14.74 13.28
Drinking water 0.37 0.69 0.31 0.6
Years of education 6.2 6.76 6.13 6.6
Attendance rate 4.86 5.22 4.12 4.6
Child mortality 0.12 0.03 X X
Under-nutrition 0.04 0.02 X X
Insurance X X 22.76 25.2
Antenatal care X X X X
Institutional coverage X X X X
Chronic disease X X 5.99 5.24
Source: authors’ compilation based on data from the NSSO-71 and -75.
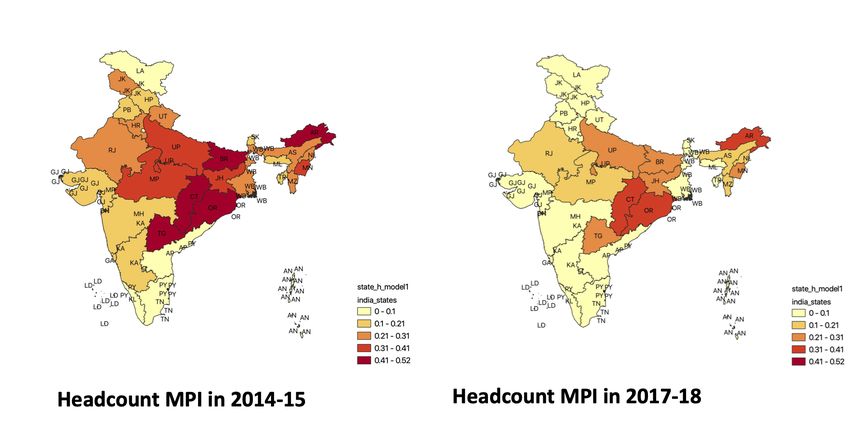
The study also computes the MPI for states in India, the results of which are summarized in Appendix
Table A6. The results reveal that headcount poverty has decreased in all states over 2014–15 to 2017–
18, while intensity of poverty largely remains the same. Telangana and Bihar, which reported headcount
poverty over 40 per cent in 2014–15 could be reduced by half, while Chhatisgarh, Arunachal Pradesh,
and Orissa could move from 40–50 per cent to 30–40 per cent (Figure 2). The number of states that
reported less than 10 per cent headcount poverty increased from 6 to 20. Both models reveal that there
needs to be a greater focus on a few north-eastern states (Arunachal Pradesh and Manipur), central
states (Chhatisgarh and Madhya Pradesh), eastern states (Bihar, Jharkand, and Orissa), and a western
state (Rajasthan), northern state (Uttar Pradesh), and southern state (Telangana).
Figure 2: MPI rural/urban estimates
Source: authors’ compilation based on data from NSSO-71 and -75.
Extensively in the literature, health shocks have shown to be an important determinant of poverty. The
COVID-19 pandemic affected both rich and poor in terms of health and income. This study predicts the
changes in MPI due to COVID-19 by modelling the impact through change in income. An income shock
of 20–30 per cent is applied in Models 1 and 4 along with differential shocks to the lowest quintile. The
results of the income shock are summarized in Table 6.
11Table 6: Results of the income shock (%)
NSSO-75:
NSSO-75: NSSO-75: NSSO-75:
Indicator 40% income shock in bottom
no income shock 20% income shock 30% income shock
quintile and 20% shock for rest
Headcount poverty 13.75 24.01 30.7 25.78
Intensity of poverty 40.91 40.23 40.08 40.25
MPI 5.6 9.7 12.3 10.3
Source: authors’ compilation based on data from NSSO-71 and -75.
The results reveal that COVID-19 will lead to reversal of poverty reduction gains, with headcount
poverty rising from 13.75 per cent (without income shock) to almost 30 per cent (with 30 per cent
income shock). The importance of income can be explained by the fact that it contributes 35–50 per
cent weight to the MPI among the given indicators. The results are summarized in Appendix Table A3,
showing that poverty rises more steeply in rural areas compared to urban areas.
6 Conclusion
This study supplements the existing country-level studies measuring multidimensional poverty (Chaud-
huri et al. 2017; Tripathi and Yenneti 2019; UNDP and OPHI 2019). Using two waves of NSSO data,
the study finds that at least 144 million people were pushed out of poverty between 2014–15 and 2017–
18. Using different methodologies, the number of people pushed out of poverty varies between 144 and
165 million. The results of the study also indicate that income continues to be a dominant instrument
driving the MPI. Government efforts therefore should be focused on creation of more high-paying jobs
that leave more income in the hands of individuals. The evidence from DAY-NRLM and DAY-NULM
seems to indicate that they are able to increase the income of the rural and urban poor by promoting
multiple livelihoods. The recent amendment to the Essential Commodities Act 1955 including two new
central laws on inter-state trading and contract farming, which will facilitate a rise in farmers’ incomes
by ensuring the right market price for farm produce. The severe impact of COVID-19, especially in
rural areas, mean that the Rural Livelihood Mission and Rural Employment Guarantee Act should be
implemented with great vigour to ensure that gains in poverty reduction are not reversed. Further, digi-
talization of agriculture will push Indian agriculture to be globally competitive and viable, also boosting
individual farmer incomes.
Two key indicators of the MPI (i.e. insurance and chronic conditions), contribute almost one-third to the
index. The NHM and Ayushman Bharat Scheme, with more than 50 per cent of the allocated budget,
show a strong commitment of the government towards health. Ayushman Bharat Pradhan Mantri Jan
Arogya Yojana (PM-JAY), with one crore treatments as of May 2020, has already positively impacted
many lives, making healthcare affordable and accessible. The IMR, MMR, and total fertility rate have
improved over the last decade through sustained efforts of NHM (PRS 2020b). The strengthened human
resource capacity in the health sector in the form of ASHAs, ANMs, and SNs has helped to achieve
near-universal coverage in terms of institutional coverage and antenatal care.
Ujjwala Yojana achieved its target nine months early, leading to greater access to safe cooking fuel.
However, concerns exist on sustained use of LPG as a cooking fuel. The recent Comptroller and Auditor
General report points out that 19.3 million consumers used only 3.66 refills each on average per year.
Further, more than a dozen states report annual refill figures below the national average of 6.25 cylinders
(14.2 kg). The government should take proactive measures to ensure that safer cooking fuels such as
electricity and LPG end up as the default option for all the households in the country.
12Education contributes one-tenth to the MPI. Realizing that school education needs to be treated holis-
tically, the government has conceptualized the Samagra Shiksha scheme, which subsumes three other
schemes (SSA, RMSA, and Teacher Education). The integrated scheme aims to shift the focus from
evaluating inputs to schooling outcomes, such as years of schooling, grades, and attendance rate (Min-
istry of Human Resource Development 2018). The NSSO-75 education schedule reveals that 13.6 per
cent of individuals aged 15 years and above are never enrolled in any education due to lack of interest and
financial constraints. The scheme’s attention in addressing such gaps will go a long way in improving
this situation.
The study also finds that the decline in poverty has been steeper in urban areas compared to rural areas,
highlighting the need to focus on rural areas. The study also finds that focused efforts should be made
in ten states—Arunachal Pradesh, Manipur, Chhatisgarh, Jharkhand, Madhya Pradesh, Bihar, Orissa,
Rajasthan, Telangana, and Uttar Pradesh—to improve the MPI. The study models the impact of COVID-
19 by introducing income shocks and finds that gains in poverty reduction are reversed. The MPI rises
to almost 30 per cent, and the rise is steeper in rural areas compared to urban areas. This study not only
provides an appraisal of current government interventions in reducing multidimensional poverty, but
also helps Indian policy-makers to take targeted interventions to reduce the MPI and push the country
towards sustainable development.
References
Alkire, S., and J. Foster (2011). ‘Counting and Multidimensional Poverty Measurement’. Journal of Public Eco-
nomics, 95: 476–87. https://doi.org/10.1016/j.jpubeco.2010.11.006
Alkire, S., J.E. Foster, S. Seth, M.E. Santos, J.M. Roche, and P. Ballon (2014). ‘Multidimensional Poverty Mea-
surement and Analysis’. OPHI Working Paper 82. Oxford: Oxford Department of International Development.
Alkire, S., C. Oldiges, and U. Kanagaratnam (2018). ‘Multidimensional Poverty Reduction in India 2005/6–
2015/16: Still a Long Way to Go But the Poorest Are Catching Up’. OPHI Research in Progress 54a. Oxford:
Oxford Department of International Development.
Bourguignon, F., and S.R. Chakravarty (2003). ‘The Measurement of Multidimensional Poverty’. Journal of Eco-
nomic Inequality, 1(1): 25–49. https://doi.org/10.1023/A:1023913831342
Chaudhuri, B., N. Gulati, A. Banerjee, A. Roy, I. Halder, S. Karim, and P. Vertier (2017). ‘Multi-Dimensional
Poverty Index: A State Level Analysis of India’. Working Paper Brussels: European Commission.
Dehury, B., and S.K. Mohanty (2015). ‘Regional Estimates of Multidimensional Poverty in India’. Economics, 9:
1–35. https://doi.org/10.5018/economics-ejournal.ja.2015-36
Department of Economic Affairs (2020). ‘Economic Survey’. New Delhi: Department of Economic Affairs.
Foster, J., J. Greer, and E. Thorbecke (1984). ‘A Class of Decomposable Poverty Measures’. Econometrica, 52:
761–66. https://doi.org/10.2307/1913475
Gold, S., N.K. Maurya, Moradhvaj, and P. Bhandari (2019). ‘Regional Differentials in Multidimensional
Poverty in Nepal: Rethinking Dimensions and Method of Computation’. SAGE Open. https://doi.org/10.1177/
2158244019837458
IBEF (2018). ‘JAM Trinity’. Case Study. New Delhi: India Brand Equity Foundation.
Institute of Rural Management Anand (2017). Independent Assessment of Design, Strategies, and Impacts of DAY-
NRLM. New Delhi: Ministry of Rural Development, Government of India.
Kalbag, C. (2018). ‘Will Ayushman Bharat Do Better Than Its Predecessor Schemes?’. Economic Times, 9 August.
Kumar, V., S. Kumar, and S. Sonu (2015). ‘Multi-Dimensional Poverty Index (MPI): A State Wise Study of India
in SAARC Countries’. International Journal of Enhanced Research in Educational Development, 3(1): 14–21.
13Lemanski, C. (2016). ‘Poverty: Multiple Perspectives and Strategies’. Geography, 101(1): 4–10. https://doi.org/
10.1080/00167487.2016.12093977
Meyer, B.D., and J.X. Sullivan (2003). ‘Measuring the Well-Being of the Poor Using Income and Consumption’.
Journal of Human Resources, 38: 1180–220. https://doi.org/10.2307/3558985
Ministry of Health and Family Welfare (2019). Annual Report. New Delhi: Ministry of Health and Family Welfare,
Government of India.
Ministry of Human Resource Development (2018). ‘Integrated Scheme for School Education—Merging the Cen-
trally Sponsored Schemes of SSA, RMSA and TE’. Concept Paper. New Delhi: Ministry of Human Resource
Development.
NSSO (2015). ‘Unit Level Data: 71st Schedule’. New Delhi: Ministry of Statistics, Government of India.
NSSO (2018). ‘Unit Level Data: 75th Schedule’. New Delhi: Ministry of Statistics, Government of India.
NULM (2020). ’Fortnightly Newsletter’, Issue 3, 1–15 May. New Delhi: Ministry of Housing and Urban Affairs.
Press Trust of India (2019). ‘Ujjwala Scheme: Govt Achieves Target of 8 Cr Free Cooking Gas Connections to
Poor before Schedule’. Firstpost, 6 September.
PRS (2020a). ‘Demand for Grants 2020–21 Analysis: Jal Shakti’. New Delhi: PRS India.
PRS (2020b). ‘Demand for Grants 2020–21 Analysis: Health and Family Welfare’. New Delhi: PRS India.
Ravallion, M. (2010). ‘Poverty Lines Across the World’. Policy Research Working Paper 5284. Washington, DC:
World Bank. https://doi.org/10.1596/1813-9450-5284
Saini, S. (2020). ‘COVID-19 May Double Poverty in India’. Financial Express, 30 April.
Santos, M.E., and S. Alkire (2011). ‘Training Material for Producing National Human Development Reports’.
Research Paper. Oxford: Oxford Department of International Development .
Sarkar, S. (2012). ‘Multi-dimensional Poverty in India: Insights from NSSO Data’. OPHI Working Paper. Oxford:
Oxford Department of International Development.
Sen, A. (1980). ‘Equality of What?’ In S. McMurrin (ed.) The Tanner Lectures on Human Values. Salt Lake City,
UT: University of Utah Press.
Townsend, P. (1979). Poverty in the United Kingdom. London: Penguin Books.
Tripathi, S., and K. Yenneti (2019). ‘Measurement of Multi-dimensional Poverty in India: A State Level Analysis’.
MPRA Paper 96952. Munich: Munich Personal RePEc Archive.
Tsui, K. (2002). ‘Multidimensional Poverty Indices’. Social Choice and Welfare, 19(1): 69–93. https://doi.org/10.
1007/s355-002-8326-3
UNDP and OPHI (2019). ‘How to Build a National Multidimensional Poverty Index (MPI): Using the MPI to
Inform the SDGs’. Oxford: UNDP and Oxford Department of International Development.
14Appendix
Table A1: List of indicators used in the construction of the MPI: Model 3
MPI dimension Indicator Cutoff description Weight
Sanitation Deprived if there is no latrine facility in the household 1/12
Standard of
Cooking Deprived if cooking fuel is other than LPG, other natural gas, and electricity 1/12
living
Drinking water Deprived if drinking water is from an unprotected source 1/12
Years of schooling Deprived if there is not at least one member in the household with six years of schooling 1/8
Education
Attendance Deprived if school-going children (aged under 15 years) are not completing age-appropriate grade 1/8
Insurance Deprived if there is no health insurance 1/12
Health Antenatal care Deprived if the pregnant lady is not provided with iron folic acids and toxoid vaccine 1/12
Institutional delivery Deprived if the pregnancy is delivered at home instead of at care facility by trained practitioner 1/12
Income MPCE Deprived if MPCE is below the Tendulkar Committee poverty cutoff computed for the state 1/4
Source: authors’ compilation.
Table A2: List of indicators used in the construction of the MPI: Model 4
MPI dimension Indicator Cutoff description Weight
Sanitation Deprived if there is no latrine facility in the household 1/12
Standard of
Cooking Deprived if cooking fuel is other than LPG, other natural gas, and electricity 1/12
living
Drinking water Deprived if drinking water is from an unprotected source 1/12
Years of schooling Deprived if there is not at least one member in the household with six years of schooling 1/8
Education
Attendance Deprived if school-going children (aged under 15 years) are not completing age-appropriate grade 1/8
Insurance Deprived if there is no health insurance 1/8
Health
Chronic Deprived if any member of the household has a chronic condition 1/8
Income MPCE Deprived if MPCE is below the Tendulkar Committee poverty cutoff computed for the state 1/4
Source: authors’ compilation.
15Table A3: Income shock (%)
NSSO-75: 40% decline in bottom
Indicator NSSO-75: no shock NSSO-75: 20% income shock
quintile and 20% in the rest
Rural Urban Rural Urban Rural Urban
Headcount poverty 18.13 3.2 31.57 5.9 34.0 5.9
Intensity of poverty 41 39.64 40.32 39.19 40.32 39.19
MPI 7 1.3 12.7 2.3 13.7 2.3
Source: authors’ compilation based on data from the NSSO-71 and -75.
Table A4: MPI results (%)
Indicator NFHS-4 Model 1 Model 2 Model 3 Model 4
NSSO-71 NSSO-75 NSSO-71 NSSO-75 NSSO-71 NSSO-75 NSSO-71 NSSO-75
Headcount poverty (H) 27.5 26.9 13.75 31.34 16.91 34.86 20.8 41.62 26.4
Intensity of poverty (A) 43.9 42.8 40.91 42.8 41 46.99 43.8 49.11 45.4
MPI = H * A 12.1 11.5 5.6 13.4 6.9 16.38 9.1 20.44 11.97
Source: authors’ compilation based on data from the NSSO-71 and -75.
Table A5: MPI results (%)
Model 1 Model 4
NSSO-71 NSSO-71 NSSO-75 NSSO-75 NSSO-71 NSSO-71 NSSO-75 NSSO-75
Rural Urban Rural Urban Rural Urban Rural Urban
Headcount ratio (H) 32.49 13.75 18.13 3.2 47.94 26.85 32.13 12.7
Intensity of Poverty (A) 43.31 39.81 41 39.64 49.93 45.69 46 41.5
MPI = H * A 14.1 5.47 7.4 1.3 23.94 12.27 14.78 5.27
Source: authors’ compilation based on data from the NSSO-71 and -75.
16Table A6: Statewise MPI results (%)
State Model 1 Model 4
NSSO-71 NSSO-75 NSSO-71 NSSO-75
H A MPI H A MPI H A MPI H A MPI
A&N Islands 9.20 45.43 4.18 0.53 44.47 0.23 36.98 43.26 16 7.15 36.67 2.62
Andhra Pradesh 8.60 44.08 3.79 2.44 39.57 0.96 19.87 44.41 8.83 7.05 39.14 2.76
Arunachal Pradesh 45.19 37.71 17.04 31.46 36.62 11.52 60.05 46.88 28.15 44.97 44.59 20.05
Assam 27.60 35.95 9.92 16.75 36.71 6.15 39.56 44.91 17.76 27 44.26 11.95
Bihar 44.93 44.79 20.12 28.17 43.21 12.17 60.29 52.77 31.82 44.27 49.54 21.93
Chhattisgarh 42.65 42.05 17.93 35.82 36.52 13.08 49.99 47.82 23.90 39.35 40.32 15.87
Dadra & Nagar Haveli 15.88 43.75 6.95 0.93 41.67 0.39 34.88 47.17 16.45 5 41.44 2.07
Delhi 1.82 34.99 0.64 0.30 36.90 0.11 8.10 39.53 3.20 4.82 37.96 1.83
Goa 11.16 34.96 3.90 0.40 35.09 0.14 20.58 44.71 9.20 4.73 39.04 1.85
Gujarat 14.07 42.63 6 3.08 38.99 1.20 27.28 47.93 13.08 9.74 41.73 4.06
Haryana 20.87 39.81 8.31 4.91 35.36 1.74 33.40 47.41 15.83 10.60 41.46 4.39
Himachal Pradesh 19.85 37.38 7.42 5.39 34.26 1.85 28.34 46.17 13.09 16.88 39.11 6.60
Jammu & Kashmir 30.10 40.29 12.13 8.81 38.36 3.38 49.42 47.37 23.41 20.66 43.51 8.99
Jharkhand 40.63 44.36 18.02 28.95 43.36 12.55 55.31 52.80 29.20 47.82 49.03 23.45
Karnataka 12.89 40.90 5.27 2.90 38.75 1.12 28.51 46.68 13.31 12.24 40.85 5
Kerala 5.07 34.49 1.75 2.63 33.54 0.88 23.53 36.73 8.64 15.88 36.96 5.87
Madhya Pradesh 32.29 42.52 13.73 15.96 38.97 6.22 48.24 50.52 24.37 29.62 45.18 13.38
Maharashtra 17.49 41.14 7.19 8.28 38.70 3.21 30.79 47.73 14.70 20.16 43.90 8.85
Manipur 36.36 37.16 13.51 21.03 35.44 7.45 52.26 46.36 24.23 30.48 44.74 13.64
Meghalaya 20.50 37.95 7.78 4.13 34.63 1.43 28 43.97 12.31 8.01 39.08 3.13
Mizoram 24.58 40.49 9.95 11.32 37.53 4.25 26.55 42.63 11.32 12.42 40.15 4.99
Nagaland 26.53 33.51 8.89 19.13 34.66 6.63 32.80 43.48 14.26 24.91 44.21 11.01
Orissa 46.47 44.01 20.45 31.91 41.91 13.37 55.69 51.83 28.86 42.56 49.42 21.04
Puducherry 0.41 33.71 0.14 0.30 33.33 0.10 15.09 38.80 5.85 0.91 37.46 0.34
Punjab 14.45 40.72 5.88 1.72 35.70 0.61 32.44 45.36 14.71 11.39 37.70 4.29
Rajasthan 25.27 44.63 11.28 10.65 41.85 4.46 37.69 49.23 18.55 19.58 44.19 8.65
Sikkim 12.96 34.55 4.48 1.25 33.61 0.42 20.97 42.55 8.92 4.63 39.57 1.83
Tamil Nadu 7.79 41.05 3.20 2.25 40.10 0.90 21.29 45.07 9.59 8.91 41.32 3.68
Telangana 51.45 40.98 21.08 21.68 38.75 8.40 78.53 43.76 34.36 55.62 40.34 22.44
Tripura 13.33 35.31 4.71 6.18 38.70 2.39 21.17 40.82 8.64 12.72 41.63 5.29
Uttar Pradesh 37.16 44.65 16.59 22.01 42.77 9.41 53.30 52.16 27.80 37.71 48.76 18.39
Uttaranchal 28.78 37.58 10.82 5.48 35.38 1.94 36.42 48.36 17.61 11.86 42.15 5
West Bengal 26.27 40 10.51 7.67 37.86 2.90 45.49 46.48 21.14 28.15 39.93 11.24
Source: authors’ compilation based on data from the NSSO-71 and -75.
17You can also read