Coca-Cola Europacific Partners - 11 May 2021
←
→
Page content transcription
If your browser does not render page correctly, please read the page content below
Coca-Cola Europacific
Partners
11 May 2021

Forward looking statements
This document contains statements, estimates or projections that constitute “forward-looking statements” concerning the financial condition, performance, results, strategy and objectives of Coca-Cola Europacific Partners
plc and its subsidiaries, including Coca-Cola Amatil Limited and its subsidiaries (together "CCL", and CCL with Coca-Cola Europacific Partners plc and its subsidiaries together “CCEP” or the “Group”). Generally, the words
“believe,” “expect,” “intend,” “estimate,” “anticipate,” “project,” “plan,” “seek,” “may,” “could,” “would,” “should,” “might,” “will,” “forecast,” “outlook,” “guidance,” “possible,” “potential,” “predict,” “objective” and similar expressions
identify forward-looking statements, which generally are not historical in nature.

Forward-looking statements are subject to certain risks that could cause actual results to differ materially from CCEP’s historical experience and present expectations or projections, including with respect to the acquisition
of CCL (the “Acquisition”). As a result, undue reliance should not be placed on forward-looking statements, which speak only as of the date on which they are made. These risks include but are not limited to:

1. those set forth in the “Risk Factors” section of CCEP’s 2020 Annual Report on Form 20-F filed with the SEC on 12 March 2021, including the statements under the following headings: Business continuity and resilience (such
as the adverse impact that the COVID-19 pandemic and related government restrictions and social distancing measures implemented in many of our markets, and any associated economic downturn, may have on our
financial results, operations, workforce and demand for our products); Packaging (such as refillables and recycled plastics); Cyber and social engineering attacks and IT infrastructure; Economic and political conditions (such
as the UK’s exit from the EU, the EU-UK Trade and Cooperation Agreement, and uncertainty about the future relationship between the UK and EU); Market (such as disruption due to customer negotiations, customer
consolidation and route to market); Legal, regulatory and tax (such as the development of regulations regarding packaging, taxes and deposit return schemes); Climate change and water (such as net zero emission
legislation and regulation, and resource scarcity); Perceived health impact of our beverages and ingredients, and changing consumer buying trends (such as sugar alternatives and other ingredients); Competitiveness,
business transformation and integration; People and wellbeing; Relationship with TCCC and other franchisors; Product quality; and Other risks;

2. those set forth in the "Business and Sustainability Risks" section of CCL's 2020 Financial and Statutory Reports including the statements under the following headings: COVID-19 related risks; The Coca-Cola Company
(TCCC) and other brand partners relationship risk; Economic and political risks; Cyber risk; Foreign exchange risk; Key personnel risk; Beverage industry risk; Regulatory risk; Corporate social responsibility risk; Climate change
risk; Supply chain risk; Litigation and legal disputes risk; Malicious product tampering risk; Workplace Health & Safety (WHS) risk; Business interruption risk; Product quality risk; Fraud risk; and

3. risks and uncertainties relating to the Acquisition, including the risk that the businesses will not be integrated successfully or such integration may be more difficult, time consuming or costly than expected, which could
result in additional demands on CCEP’s resources, systems, procedures and controls, disruption of its ongoing business and diversion of management’s attention from other business concerns; the possibility that certain
assumptions with respect to CCL or the Acquisition could prove to be inaccurate; burdensome conditions imposed in connection with any regulatory approvals; ability to raise financing; the potential that the Acquisition may
involve unexpected liabilities for which there is no indemnity; the potential failure to retain key employees as a result of the Acquisition or during integration of the businesses and disruptions resulting from the Acquisition,
making it more difficult to maintain business relationships; the potential for (i) negative reaction from financial markets, customers, regulators, employees and other stakeholders, (ii) litigation related to the Acquisition.

The full extent to which the COVID-19 pandemic will negatively affect CCEP and the results of its operations, financial condition and cash flows will depend on future developments that are highly uncertain and cannot be
predicted, including the scope and duration of the pandemic and actions taken by governmental authorities and other third parties in response to the pandemic.

Due to these risks, CCEP’s actual future results, dividend payments, and capital and leverage ratios may differ materially from the plans, goals, expectations and guidance set out in forward-looking statements (including
those issued by CCL prior to the Acquisition). These risks may also adversely affect CCEP’s share price. Additional risks that may impact CCEP’s future financial condition and performance are identified in filings with the SEC
which are available on the SEC’s website at www.sec.gov. CCEP does not undertake any obligation to publicly update or revise any forward-looking statements, whether as a result of new information, future events, or
otherwise, except as required under applicable rules, laws and regulations. Furthermore, CCEP assumes no responsibility for the accuracy and completeness of any forward-looking statements. Any or all of the forward-
looking statements contained in this filing and in any other of CCEP’s or CCL’s public statements (whether prior or subsequent to the Acquisition) may prove to be incorrect.

Reconciliation & definition of alternative performance measures
The following presentation includes certain alternative performance measures, or non-GAAP performance measures. Refer to 2020 Integrated Report / Annual Report on Form 20-F, published on 12 March 2021, which details
our non-GAAP performance measures and reconciles, where applicable, our 2020 and 2019 results as reported under IFRS to the non-GAAP performance measures included in this presentation. This presentation also includes
certain forward looking non-GAAP financial information. We are not able to reconcile forward looking non-GAAP performance measures to reported GAAP measures without unreasonable efforts because it is not possible to
predict with a reasonable degree of certainty the actual impact or exact timing of items that may impact comparability. For further information, please refer to pages 54-61 of the 2020 Integrated Report / Annual Report on
Form 20-F.
Agenda
• Europe: Q1 highlights
• Coca-Cola Europacific Partners:
  Further together
• Q&A
• Close

                                    3
Europe: Q1 summary
Winning                                                                                    Gained value share                                                                     Total volumes4 –10.0%

#1 customer value creator                                                                  NARTD                                                                                  Home +4.0%
within NARTD +>]135m1                                                                      +120bps value share2                                                                   Away from home -34.5%
                                                                                           +260bps online value share3
Executed pricing strategy
across our markets

Resilient core                                                                               Strong performance                                                                   Continued progress
                          Coca-Cola Zero Sugar:                                                                                   Energy volume4                                  Germany to transition
                          +]60m retail value1                                                                                     +34% despite COVID-19                           to 70% rPET in FY21
                                                                                                                                  Now #1 energy portfolio                         Netherlands now a
                                                                                                                                  in 3 markets5                                   100% rPET market
                 Zero flavours & mixers:
                    +150bps value share2                                                                                          Monster multipacks
                                                                                                                                  volume4 +60%

 1.   Nielsen Strategic Planner YTD Data to w/e 28.03.2021.Countries included are ES, PT, DE, GB, FR, BE, NL, SE & NO                     4.   Comparable volumes. Refer to “Note Regarding the Presentation of Alternative Performance Measures” for further
 2.   Nielsen Global Track Data YTD to w/e IS 28.03.21, GB 03.04.21, ES PT DE NL FR BE SE & NO 04.04.21; flavours+B&M (light) category         details                                                                                                     4
 3.   YTD Online Data to w/e GB 03.04.21 (Retailer EPOS+Nielsen), ES FR & NL 04.04.21 (Nielsen)                                           5.   Nielsen Global Track Data YTD to w/e ES PT & NO 04.04.21
Europe: FY21

                   Apply learnings from 2020

                           Smart RGM (in-store & online)

                   Continued momentum of digital B2B, B2C & D2C
                                                                     Safeguarding
  Flexible deployment of front line to support reopenings         our people remains
                                                                   our top priority
        Continued focus on cash & efficiency

                                                                                       5
Europe: Excitement ahead

Ready                                                Great
for reopening                     ZERO SUGAR         activation
Supporting customers            New taste,
a priority                      new look &
                                new campaign
Field sales
& coolers

Brand innovations
What the Fanta?                 Continued roll-out
                                Express & Proud
New Monster
                                to Serve
variants
Topo Chico

                                                                  6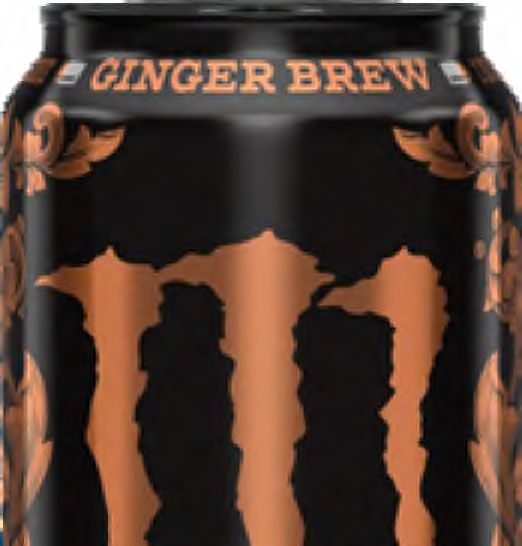
Coca-Cola
Europacific Partners:
Further together

                        7
Compelling transaction:                                                            Best
                                                                                  practice
A great move                                           Significant                sharing
                                                      performance
                                                      improvement
                           Structurally               opportunities
                           higher growth
                              platform
                                                                                                  Focused
                                                                      Dividend policy         on returning to
                       Value                Immediate                   maintained            target leverage
                      creating             EPS accretion                  on larger            within 3 years
                                                                       earnings base         driven by stronger
                                                                                              cash generation
                           Strengthens
                           relationship
                            with TCCC
                                                      Underpins
                                                     medium-term
                                                      objectives

                                                                                                              8
Key messages

1                                                            2                                                                  3                                                            4                                5
     We have a                                                  Our strategic                                                     Further together:                                               In Australia, Pacific &     Our business will
     significantly                                              relationship                                                                                                                      Indonesia (API1), we will   continue to be built
     bigger opportunity                                                                                                                                                                           accelerate momentum by      on great people, great
                                                                                                                                                                                                  applying Europe’s proven    service and great
                                                                                                                                                                                                  model                       beverages –

                                                                                                                                                                                                  In Europe, the deal
                                                                                                                                                                                                  makes us stronger

1.    Australia, Pacific & Indonesia (API) represents CCL including Corporate & Services; Pacific includes New Zealand and the Pacific Islands; Indonesia includes Indonesia & Papua New Guinea                                                   9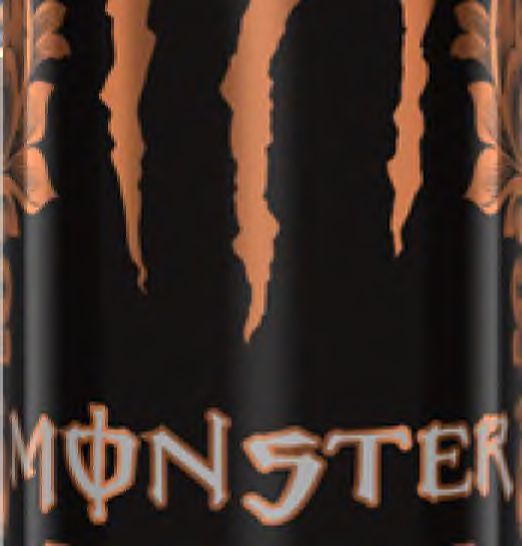
Key messages

1                    2               3                   4                            5
We have a            Our strategic   Further together:   In API, we will accelerate   Our business will
significantly        relationship                        momentum by applying         continue to be built
bigger opportunity                                       Europe’s proven model        on great people, great
                                                                                      service and great
                                                                                      beverages –

                                                         In Europe, the deal
                                                         makes us stronger

                                                                                                         10
Acquired business highlights
16 Well invested
markets ]2.9bn supply chain
revenue 32 plants +
41 warehouses
]0.5bn
EBITDA 500k
coolers
~620muc
NARTD, Alcohol
& Coffee
MSCI
ESG leader
11Solidifying our position
as the largest Coca-Cola Bottler by revenue
~3bn
NARTD, Alcohol &
Coffee
Volume (UC)
€13.5bn
29
markets
€10.6bn €7.5bn €6.9bn €6.5bn €6.1bn €2.9bn €1.9bn €1.8bn
Source: 2020 Annual Reports 12
All currencies converted into ] at average FX rates for the period 1 January 2020 to 31 December to 2020More diversified than before
Pro forma 2020 revenue1 2020 volume mix Diversification
8.0%
4%
4%
16%
Iberia ~3bn 8.0%
6.0%
6.0%
Geographic
Germany
combined
13% unit cases2
25.0%
Great Britain Hydration 25.0%
Culture
France RTD Teas/Coffee,
Juices & Other
17%
]13.5bn Northern Europe
Flavours, Mixers
17% & Energy
Australia 59.5% Customers
Coca-Cola®
59.5%
Classic 36.0%
Zero/Light 23.5%
New Zealand & Fiji
16% Alcohol &
hot coffee
13% Indonesia & PNG
1.5% Portfolio
1.5%
1. Represents mathematical summation of the equivalent FY20 metrics as included in the 2020 CCEP Integrated Report and 2020 CCL Annual Report Not prepared in accordance with US SEC Regulation
S-X Article 11. Applied average 2020 EUR/AUD FX rate of 1.656 13
2. Source: Internal reports. A unit case is equivalent to ~5.678 ready to drink litresMore focused portfolio, even more consumer led
Known & Different experiences
trusted brands Indulgence
COMBINED CONSUMER Variety of packs
for different
P O P U L AT I O N > 6 0 0 M 1 occasions
Broad needstates Zero sugar & Sustainability
Core sparkling low-calorie Carbon reduction,
Energy accelerating rPET,
removing
Premium hydration unnecessary
Coffee, RTD tea packaging
Alcohol
14
1. Source: EuromonitorAddressable market: ~]125bn
larger & higher growth Combined 2019
NARTD value1
2022-25 API markets
NARTD CAGR growing faster
~3%2 than Europe
~]75bn
Combined 2019
Hot Coffee
value3 2022-25
Hot Coffee
CAGR ~4%3
1. Global Data FY2019; rounded. Markets inc. BE, FR, DE, NL, NO, PT, SP, SE, UK, AUS, IND, NZ
2. CCEP internal estimates based on Global Data 2022-2025; rounded to nearest percent
3. Global Data, Euromonitor, European Vending and OCS Association & internal estimates; FY2019; rounded; Markets inc. BE, FR, DE, NL, NO, 15
PT, SP, SE, UK, AUS, IND, NZNARTD combined markets to grow ~3% p.a.
2025 2016-2019 2022-2025 2019 combined
]bn CAGR2 CAGR2 category share1
Carbonates 39 6 1 46 1.5% 1% - 2% ~60%
Hydration 24 9 9 42 2.5% 3% - 4% ~6%
Energy 9 2 3 14 7.0% 5% - 6% ~20%
RTD Tea 4 3 1 8 4.5% 4.5% - 5.5% ~10%
RTD Coffee 1 1 1 3 8.5% 6.5% - 7.5% ~3%
Juices & Other 20 5 25 -0.5% 0% - 1% ~7%
Europe 2019 API 2019
2019-2025 increase 2025
Total ]97bn ]26bn ]15bn ]138bn ~2% ~3% ~27%
Combined ]123bn
1. Value share, Global Data FY2019; rounded; Markets inc. BE, FR, DE, NL, NO, PT, SP, SE, UK, AUS, IND, NZ
2. CCEP internal estimates based on Global Data 2022-2025; rounded to the nearest precent
16NARTD remains diverse by channel
FY19
NARTD
revenue NARTD combined channel value mix2,3
mix1
Embracing
Hypers/Supers 34%
45% Discounters & e-commerce digitisation
HOME
54%
HOME to drive the home channel of NARTD
Discounters 11% Focused on
driving new
HoReCa 19%
+ ]15bn by 2025 occasions
Home delivery, food Continue to
AFH
Convenience/Traditional
retail 19%
55% aggregators & convenience
assess how
AFH markets
46%
fastest growing
QSR 5%
evolve post
Leisure 7%
sub-channels
Institutions 1%
Other 4%
pandemic
1. Pro forma combined revenue split for 2019. Excludes Alcohol & coffee revenues for API. Cash & Carry included in AFH channel (including Iberia)
2.
3.
Global Data FY2019. Markets inc. BE, FR, DE, NL, NO, PT, SP, SE, UK, AUS, IND, NZ
HoReCa is Hotel/Restaurant/Café; QSR is Quick Serve Restaurants; Convenience includes Convenience Stores and Food To Go; Other includes Vending, Home Delivery & Specialist Beverage Retailer. Global Data excludes Disco/Bar/Night Club and Travel/Transportation
17API: good resilience and momentum
Strong Q1 2021 recovery
2019 Revenue1 2020 Revenue1 Q1 2021 Revenue1
2 2 2
API Australia Pacific Indonesia API Australia Pacific Indonesia API Australia Pacific Indonesia
+11% +11%
+8%
+7% +6%
+5% +1%
+3%
-3% -3%
-6%
-17% Strong recovery
Australia in Australia & NZ
revenue growth COVID-19 impact partially offset by
for the 1st time less than Europe continued restrictions in
(-11%) Indonesia:
since 2012 taking learnings
to Europe
18 18
1. Trading revenue growth including alcohol & coffee vs prior year/quarter; FX-neutral; FX-neutral revenue is a non-GAAP performance measure - refer to the Reconciliation & definition of alternative performance measures at the beginning of this presentation for further details; rounded to nearest percent;
2. Australia includes container depositsKey messages
1 Solidifies position
as the largest Higher growth
We have a Coca-Cola bottler platform
significantly
bigger opportunity by revenue
API
More
good resilience
diversity
& momentum
19Key messages
1 2 3 4 5
We have a Our strategic Further together: In API, we will accelerate Our business will
significantly relationship momentum by applying continue to be built
bigger opportunity Europe’s proven model on great people, great
service and great
beverages –
In Europe, the deal
makes us stronger
20Strengthened & trusted TCCC relationship
STRONG
ALIGNMENT
Product Bottling Proven Track Record of System Value Creation Trademark Owners
Sales & Distribution Shared Vision to Drive Value Growth over Concentrate Supply
Volume, Gain Value Share & Leverage
Data Analytics & Insights
Customer Management Brand & Portfolio Development
Aligned Financial Plans & Incentives
In-outlet Execution & Local Marketing Consumer Marketing
Joint Bold Sustainability Commitments
CCEP Contributes ~1/3
TCCC’s Operating Income (Previously ~1/4)
TCCC Owns >19% of CCEP
21 21Key messages
Integration
1 2 3 4 5
People
We have a Our strategic Further together: In API, we will accelerate Our business will
significantly relationship momentum by applying continue to be built
bigger opportunity Digital Europe’s proven model on great people,
great service and
great beverages –
Ventures
In Europe, the deal
Efficiency makes us stronger
Sustainability
22Europe: proven track record in integration
1 2
Revenue Revenue Revenue per UC
from decline to growth 3.0%
2.5%
2.0%
3.0%
3.5%
2.0%
~70%
1.0%
Total Shareholder
0.5%
-0.5% -0.5%
-1.0% Return6
-1.5%
CCE
Merger 3
2014 2015 2016 2017 2018 3 2019
Customer value creator in FMCG since 2017
#1 (>]1.5bn4 over the last 4 years)
7
CAGR +10.5%
EPS5
Solid growth
2016 2017 2018 2019
1. Comparable & FX-neutral (non-GAAP measure) 4. Nielsen Strategic Planner Data 1 Jan 2017 to YE 27.12.20 6. As at 7 May 2021 since close on 30 May 2016
2. FX-neutral (non-GAAP measure) Countries inc. are ES, DE, GB, FR, BE, NL, SE & NO 7. Coca-Cola European Partners acquired Icelandic Bottler 23
3. 2018 & 2019 exclude incremental sugar & excise taxes 5. Diluted EPS is comparable (non-GAAP measure) Vifilfell in August 2016Further together: 33k great people enabled by purpose
driven culture & ways of working
Foster highly engaged, talented & skilled workforce
with even more opportunity to grow
Accelerate a strong inclusive & diverse environment
Accelerate digital
Offer a great workplace as an employer of choice workplace
Focus on sharing knowledge & talent
with experienced leadership
2424Multi-year digital
Further Leveraging
transformation: together our tool kit:
Key priority for Europe aspiring Great position to influence
since the merger to be the world’s most & drive the future
digitised bottler
Lead across multi- Empowering Deeper consumer Scaled automation: Global
channel e-platforms: front line through & customer analytics, business
B2B, B2C, D2C & food analytics & live data insights robotics & AI services
25
aggregatorsFurther together: great digital platform
Leveraging Europe’s multi-year digital investments
Revenue growth Customer service & supply chain
IBM WATSON DEMAND PRODUCTION CONTROL
SENSING PLANNING TOWER
Spend Analytics ANALYTICS
KAMA
Workplace
PRICE,
PROFIT
TRADE PROMO & CASH
OPTIMISATION
EUROPE > API 26
26Further together: complementary ventures platforms
Amatil X & CCEP Ventures launched Globalise access to innovation markets,
~2 years ago share learnings & scale faster
Route to market Sustainability Customer
27Further together: more efficient, leaner business
EUROPE proven track record in synergy delivery driven by consolidation, optimisation & leveraging best practice
PRE-ANNOUNCED PERMANENT
EUROPE API
FY20 SAVINGS & ONGOING
EFFICIENCY PROGRAMMES
Accelerate
Competitiveness
+ Fighting Fit
(AU)
Total
Next
3 years
~]350-395m
COMBINATION BENEFITS
Corporate
listing Procurement
Supply
chain
Group
functions
~]60-80m
structure
28Further together: building on a strong,
shared focus on sustainability
Europe
Aligned with the Coca-Cola Company’s Achieved 100%
renewable electricity (2018)
sustainability & World Without Waste Plan
API
Europe API Committed to 100%
renewable electricity
by 20301
Solid credentials Align commitments Valuable learnings
to build on together to go further together to share together Australia
World’s first
Europe & API Europe Coca-Cola Bottler
both classified as MSCI ESG leaders Net zero on entire value chain
by 2040 & LTIP based GHG reduction target to deliver
100% rPET bottles
API
Net zero on direct emissions by 2040 Europe
42 100% rPET
markets
1. By 2025 in Australia & New Zealand, by 2030 total API
2. Sweden & the Netherlands. Norway & Iceland to switch to full portfolio 100% rPET in 2021 29Key messages
Stronger 2 3 Proven Leveraging
relationship integration scale
with TCCC Our strategic Further together:
experience
relationship
Shared Strong
learnings shared focus
on sustainability
& people
30Key messages
API
1 2 3 4 5
Pacific
We have a Our strategic Further together: In API, we will accelerate Our business will
significantly relationship momentum by applying continue to be built
Australia
bigger opportunity Europe’s proven model on great people,
great service and
Indonesia great beverages –
In Europe, the deal
makes us stronger
31Higher growth platform Australia
New Zealand 2.3%
3.5%
0.7%
1.1%
supported by attractive Indonesia 5.5% 0.8%
long-term macros Europe
GDP 1
1.4% 0.2%
Population 2
Australia: Pacific: Indonesia:
Performance 62% ‘Top Bottler’ 18% Fantastic 20%
improvement Revenue; raising the bar Revenue; transformation Revenue;
potential from for Europe opportunity in
API’s biggest
65% EBIT 24% EBIT the world’s 4th
11% EBIT
profit pool most populous
country
Fiji
New Zealand
Indonesia
1. 2025 real GDP year-on-year % growth; source: IHS Markit
2.
3.
2030 annual population % growth; source: average of Euromonitor, Oxford Economics & EIU
Revenue & on-going EBIT % splits based on FY20 metrics as included in the 2020 CCL Annual Report
32Highly experienced
management team
Peter West
API & member of CCEP Executive Leadership Team1
Reporting to Damian Gammell, CEO
Leading Australia since 2018
Chris Litchfield 30+ years of FMCG experience Jorge Escudero
New Zealand & Pacific Islands Indonesia & Papua New Guinea
Leading since 2014 Joined in 2021 from Mexican Coca-Cola bottler
28+ years of experience with Amatil 20+ years of FMCG experience
Supported by experience from Europe’s senior management across Australia, New Zealand & Indonesia
& ~15 emerging markets across Africa, Asia, Eastern Europe & Russia
33API:
Further together
34Long history, new chapter
Strong internal positive reaction, new name well received
Lots of opportunity: leveraging learnings, sharing best practices,
wider career prospects
Further
Evolution from independent to interdependent ways of working
together
Right time: focus on the core, Australia
turnaround
3536Pacific:
Further together
36Pacific
Delivering sustained growth ahead of the market 2020 Volume mix 2020 Category position5
NEW ZEALAND
Consistent NARTD volume growth ~5%1 16.5%
Hydration Water #1
Sports #1
10.5%
RTD Teas/Coffee, RTD Tea #5
NARTD market to grow ~3.5-4% p.a.2 Juices & Other Juices #2
Flavoured Dairy #4
33.5% Flavours, Mixers Flavours #1
& Energy Energy #2
#1 beverage supplier (>45% share3)
Classic 21.0%
Zero/Light 14.0%
Best New Zealand employer for 35.0% Coca-Cola® Carbonates #1
5 consecutive years4
4.0% Alcohol & Hot Coffee Alcohol RTD #3
1. New Zealand reported NARTD volume CAGR growth 2015-2019
2. CCEP internal estimates based on Global Data 2022-2025; New Zealand only; rounded to nearest percent
3. Based on Global Data FY2019. Excludes Alcohol & Coffee Beverages
4. Aon Best New Zealand employer accreditation for 5 consecutive years from 2016-2020 37
5. New Zealand category position based on value; source: Nielsen 2020 MAT (Grocery & Petrol)Pacific - top bottler in TCCC system1
Highest margin in Coca-Cola Europacific Partners
~22%
2019 NARTD EBITDA
margin2 +330bps
Highest value share in Coca-Cola Europacific Partners
vs Europe
Raising the bar for Europe
Great
>45%5
11% retail value
Samoa
revenue4 share &
growth
Fiji
7% ]5.07 growing
New Zealand 5% 2019 NARTD rev/
1% unit case3
+6.5% vs Europe
2018 2019 2020 Q1 21
Double digit
Alcohol revenue
1.
2.
In 2018 & 2019 CCA New Zealand was awarded #1 bottler in the Asia Pacific region & became the only bottler to be a finalist
of The Candler Cup (global competition to find the very best Coca-Cola Company bottler) for two consecutive years
2019 NARTD EBITDA margin vs CCEP 2019 NARTD EBITDA margin
growth FY20
3. 2019 NARTD revenue per unit case converted into ] at average FX rates for the period 1 January 2019 to 31 December to 2019 vs CCEP 2019 revenue per unit case (excluding
incremental sugar & excise taxes)
4. Pacific trading revenue growth vs prior year; 2018-19 excludes alcohol & coffee; 2021 & Q1 21 includes alcohol & coffee; FX-neutral; FX-neutral revenue is a non-GAAP performance
measure - refer to the Reconciliation & definition of alternative performance measures at the beginning of this presentation for further details; rounded to nearest percent
39
5. Based on Global Data FY2019. Excludes Alcohol & Coffee BeveragesNew Zealand drivers of success
Focus on the core Strong belief
& small outlets in sparkling
Great execution
Fantastic people
& insights driven
39Australia:
Further together
40Australia
Strong position in a growing market 2020 Volume mix 2020 Category position4
AUSTRALIA
NARTD market to grow ~3% p.a.1 17.5%
Hydration Water #2
Sports #1
2.0%
RTD Teas/Coffee, RTD Tea #3
Juices & Other RTD Coffee #5
#1 beverage supplier (~40% share2) 22.5% Juices #7
Flavours, Mixers Flavours #2
& Energy Energy #3
~80% household penetration Classic 31.0%
Zero/Light 18.5%
49.5% Coca-Cola® Carbonates #1
Well invested supply chain
(13 production sites3)
Alcohol & Hot Coffee Alcohol RTD #2
8.5%
1. CCEP internal estimates based on Global Data 2022-2025; rounded to nearest percent
2. Based on Global Data FY2019. Excludes Alcohol & Coffee Beverages
3. Number of production facilities as at 31 December 2020 41
4. Value share category position. Source: IRI Combined Grocery and C&P, FY20Australia – clear opportunity
>15%
Improvement potential from API’s largest profit pool of AU NARTD volumes
from owned brands
Green shoots of growth after 6 years of decline vs none for Europe
Fighting fit programme
>100
brands across
First year alcohol & coffee
of revenue1 growth
since 2012
>170
brands in API vs
~80 in Europe
+5% -3% -5% -1% -5% -3% -1% +2%
In-house
brewing &
12 13 14 15 16 17 18 19 roasting
~95%
of 375ml can
volume sold on
promotion
42
1. Australia trading revenue growth vs prior year; rounded to the nearest percent; includes container deposits & excludes alcohol & coffeeFurther together: clear growth opportunities
Reorient the portfolio
Win with customers
Build on capabilities
43Reorient the portfolio – aligned with TCCC
High
Non-dairy Milk Kombucha
Simplify Spirits
Energy
economic model
Market attractiveness index
Beer/Cider Flavoured Milk Coca-Cola®
with TCCC focusing Juices
No Sugar
on category priorities
Alcohol RTDs
Focus Water Sports Coca-Cola®
Review on the core
Coffee Flavours
Regular
brands
with TCCC
Sharpen Low
Low CCEP Australia position index High
coffee, alcohol
& water
44Reorient the portfolio
Light colas Flavours Alcohol
Australia Australia Australia
Accelerate 37%1 of Coca-Cola® volumes Competing brands Proven success (revenue & profit
light colas (Fanta, Sprite & Kirks)
-800bps3 value share
growth) of Spirits/RTD with
Beam Suntory
Europe
41%1 of Coca-Cola® volumes Beer & Cider partnership with
Opportunity in no sugar
Unlock Coca-Cola Zero Sugar e.g. FantaWin with customers
Joint value creation Segmentation
Drive
long-term joint Europe Retail
API started – Europe 2 years more experience
#1 FMCG Advantage1; value2
value creation #1 FMCG value creator for +4.8% FROM Key Accounts TO
3 years to 20193
(pre-merger #8)
AWAY CUSTOMER
HOME FROM CLUSTERS
Capitalise Australia Home HOME
+4.3% channel4
on precision #5 FMCG revenue
Advantage1
execution via Hyper/Supermarket
data & insight HoReCa
E-commerce Nightlife (Disco/Night Club)
Discounter
Accelerate Australia QSR
12 Outlet Types
Leisure
E-commerce 11%5 of Home
Travel/Transportation
participation in (+120bps value share6)
Convenience Stores
e-commerce, Focused postcode At Work/Institutional
Europe
channel & customer execution by key E-commerce 16%5 of Home
Petrol
Food To Go
segmentation selling weeks (+140bps value share7)
Kiosks/Tobacco/Newsagents
3 Indirect
Channels
1. Advantage Insights Survey ‘20; #1 in 5 out of 7 markets 4. Excludes Euro Discounters
2. Nielsen Global Track Data for GB ES PT DE NL FR BE SE & NO 5. FY20
3. Nielsen Strategic Planner Data 1.1.17 to YE 31.12.19 Countries inc. are 6. FY20 vs 19 Online Wholesalers Cash & Carry 46 47
ES, DE, GB, FR, BE, NL, SE & NO 7. FY20 vs 17Build on capabilities
World Class Key Account Management Execution
1 2 Europe Australia
Compelling Channel strategy Up-weighted field sales investment
reason to with segmented from FY19; good AFH cooler
believe customers
Drive penetration with ~72% purity
World Class Europe
Key Account Category Vision
3 AFH cooler purity +700bps1 to ~81%
Management Multi-year
customer Field sales visits ~doubled2 to 14 per day
strategies
Rolling out next generation
sales force tools
Customer e.g. automated route planning
First
Improve
execution 5 4
Joint Customised
execution plan account plans
& scorecarding with a few, big
win-win initiatives
1. 2019 vs 17
Capability Collaboration Toolkit 47
2. 2019 vs 16Build on capabilities – drive smart RGM
Drive Europe Belux priority small packs +4ppts2 to 34%
~50% premiumisation
(e.g. slim cans, glass)
Germany specific 0.33L RGB SSD for Horeca
of AU Retail
Coca-Cola® volume Netherlands +10ppts3 small vs large packs
sold in 24x &
30x 375ml cans1 Diversify
for different occasions
~50% FY15 75% 65% FY20 FY15 25% 35% FY20
of Retail AU
sparkling from 375ml Differentiate
multipacks packs sold in Reca
& 600ml PET1 (e.g. smaller cans, increase glass)
GB Meal Deal
~75% Drive
GB movie
nights Asda
deal +300%
OTG AU sparkling from adjacencies
revenue uplift
600ml PET & fountain1
1.
2.
Volume mix. 2020
Volume mix. 2019 vs 15
48
3. Volume mix within Home. Small packs defined as PET & GlassFurther together: translating into a multi-year opportunity
WAVE 1: WAVE 2 & BEYOND:
Develop value creation plans aligned with TCCC Portfolio & RGM
Portfolio choice, focus & priorities World Class KAM
RGM Reduce volume sold on deep promotions
World Class KAM Improve execution
Digital (e-commerce & food aggregators) Digital integration - commercial, online etc
Continue ‘Fighting Fit’ programme Ventures
Supply chain benchmarking
Talent management & sharing
49Indonesia:
Further together
50Indonesia
Growth opportunity in attractive market 2020 Volume mix Market Value Category Mix4
INDONESIA
NARTD market to grow ~3.5-4% p.a.1 11.0%
Hydration
RTD Teas/Coffee, Hydration
#2 beverage supplier (~11% share2) 27.0% Juices & Other 47% #5
4th largest population in the world
RTD Teas/Coffee,
Juices & Other
Flavours, Mixers 20% #3
Young population & rapid urbanisation 49.0% & Energy
Flavours, Mixers &
Energy 12%
#1
Cola 2% #1
Growing, more affluent middle-class
Other3
Classic 13.0% 19%
Coca-Cola®
1. CCEP internal estimates based on Global Data 2022-2025; rounded to nearest percent
13.0%
2. Based on Global Data FY2019. Excludes Alcohol & Coffee Beverages
3. Other includes Fruit Powders, Juice, Nectars, Squash/Syrups & Still Drinks 51
4. FY2020, NielsenIndonesia – fantastic opportunity ~5%
Significant long-term growth potential 5-year GDP CAGR;
forecast to be the
Favourable demographics world’s 4th largest
economy by 2050
Attractive market characteristics
Good momentum Household
in revenue1 growth income distribution2
12% p.a. High
growth in middle Upper mid
Indonesia
class consumption
since 2005 Lower mid
Low
2015 2016 2017 2018 2019 2005 2018 2030
~500K
customers
served directly
1. Indonesia & Papua New Guinea trading revenue growth vs prior year; CAGR 2015-19; FX-neutral; FX-neutral revenue is a non-GAAP performance measure - refer to the
Reconciliation & definition of alternative performance measures at the beginning of this presentation for further details 52
2. Low income: $40k basis income per household in real termsClear long-term transformation opportunity
Supported by great experience of emerging markets
Long-term value creation plan with TCCC
Portfolio - build sparkling franchise
OBPCC - drive consumer relevance
Capabilities - RTM, efficiency & execution Indonesia
53Long-term value creation plan aligned with TCCC
High
Sparkling Bottled Original
Water Tea
Strong position in
under-developed category Flavoured
Market attractiveness index
Tea Sprite
Dairy Coca-Cola® Fanta
Focus on Coca-Cola®,
Fanta & Sprite
RTD Tea Juice
Established position Sports
Build share
Low
Review Low CCEP Indonesia position index High
dairy, water
& sports
54Portfolio – build sparkling franchise
Significant Invest Under investment in Sparkling3 Sparkling more expensive4
headroom for in sparkling
consumption growth to drive Sports Refilled Water
Jug
e.g. Cola & Flavours very low relevance, Sparkling
% of market compared affordability & Brewed Coffee
to Philippines
attractiveness Tea Brewed Tea
Cola1 of the category Juice
Packaged Water
Indonesia: 1% RTD Tea
Philippines: 29% Water Sparkling
Flavours1,2
Indonesia: 3% Proven Ramadan period:
Philippines: 23%
consumer Proven >30% of
sparkling volume Focus
consumer
demand for demand on Coca-Cola®,
sparkling 20195
Fanta & Sprite
20205
1. FY2019 volume share, Euromonitor 4. Price per litre (IDR K)
2. Includes Lemonade/Lime, Orange Carbonates & Other Non-Cola
Carbonates
5. Sparkling volume share as % of NARTD 55
3. FY2019 spend by category (IDR K)OBPPC – drive consumer relevance
Bottled SSD
Bottled NCB Define clear Reset
Low consumer relevance occasions by brand price pack
Non bottled architecture
e.g. Sprite refreshing/
thirst quenching & simplify
Sparkling has ~1001
low relevance
Indonesia at regular
drinking occasions
~201
Total SKUs SKUs driving 80% RSV
1. FY2019, Nielsen
56Capabilities
RTM, efficiency & execution
Higher
cost structure
vs peers
Fit for future
route-to-market CCEP Indonesia Peers
Drive
efficiencies &
improve
execution
57Digital Europe bringing RGM
multiple capabilities Strong returnable &
Platform for frontline,
direct & indirect to emerging markets small pack capability
Segmentation RTM
Analytics Direct, distributor &
wholesaler models
Portal to step change
customer experience
Strong
senior management
People development platform experience
Group functions
Driving efficiencies &
customer service
58Key messages
API Australia 4
attractive long-term clear improvement
macros, ahead opportunity In API, we will
of Europe aligned with TCCC accelerate momentum
by applying Europe’s
proven model
Pacific Indonesia
benchmark bottler transformational opportunity:
raising the bar #2 player in huge & attractive In Europe, the deal
makes us stronger
for Europe market with clear consumer
demand for sparkling
59Key messages
1 2 3 4 5
We have a Our strategic Further together: In API, we will accelerate Our business will
significantly relationship momentum by applying continue to be built
bigger opportunity Europe’s proven model on great people, great
service and great
beverages –
In Europe, the deal
makes us stronger
60Final transaction overview
Breakdown of A$12.53 effective purchase price per share3,4 Acquired from
The Coca-Cola Company
Acquired from
public shareholders Initial 10.8% stake
10.8%
A$13.50
A$9.57
5% discount to 15-day VWAP1
20.0%
Residual 20.0% stake
outstanding
69.2%
share capital A$10.75
Closing price before announcement2,4
1. Ending as at 21 October 2020
2. Price at close of market on 22 October 2020
3. Weighted average price per share based on CCEP’s offer to CCL public shareholders, A$9.57 for the initial 10.8% stake and closing price of A$10.75 for The Coca-Cola Company’s 20% residual stake
4. Less the A$0.18 per share dividend declared by CCL on 18 February 2021 which is to be paid on 30 April 2021
Note: % based on CCL’s number of ordinary shares outstanding as at 31 December 2020 61Value & EPS accretive
API
21% Iberia
ROIC1 expected to cover API to be organised as a
WACC2 in ~5 years new business unit & will be
16%
a reportable segment along
with Europe
Disclosure to be provided
as follows:
• Quarterly revenue Revenue3 by Germany
by geography 17%
• HY & FY earnings Northern geography
Europe
17%
Immediately EPS accretive FY20 & FY19 pro formas
provided in separate RNS
Great Britain
France 16%
13%
1. ROIC is a non-GAAP performance measure. Refer to the Reconciliation & definition of alternative performance measures at the beginning of this presentation for further details
2. WACC = Weighted average cost of capital
3. Represents mathematical summation of the equivalent FY20 metrics as included in the 2020 CCEP Integrated Report and 2020 CCL Annual Report. Not prepared in accordance with US SEC Regulation S-X 62
Article 11. Applied average 2020 EUR/AUD FX rate of 1.656Further together: more efficient, leaner business
EUROPE proven track record in synergy delivery driven by consolidation, optimisation & leveraging best practice
PRE-ANNOUNCED PERMANENT EUROPE API
FY20 SAVINGS & ONGOING
EFFICIENCY PROGRAMMES
Accelerate
Competitiveness
FY21 ~]150m vs. FY19
+ Fighting Fit (AU)
FY21 A$65m vs. FY19
FY21-22 A$80m
FY22-24 ]50-75m
Total
Next
3 years
~]350-395m
COMBINATION BENEFITS
~]60-80m
Corporate
Supply Group FY22+
listing Procurement
chain functions weighted
structure
63Transaction financing
100% funded by existing liquidity & incremental borrowing 5.1
Strong balance sheet Incremental borrowing of
FY20 leverage1 of 3.2 times
]5.7bn at effective average 3.2
interest cost of ~40bps2 2.8
Leverage1 at close of 5.0 times
2.0
Remain fully committed to Balanced mix of maturities
strong investment grade rating with no covenants on debt
Moody’s 3 Baa1; Fitch 3 BBB+ or facilities
Overall average maturity of
6.5 years at weighted average
interest cost of 1.3%
< 3 years 4-6 years 7-12 years 12+ years
Balanced mix of maturities €’bn
1. Net debt to adjusted EBITDA; Net debt to adjusted EBITDA is a non-GAAP performance measure. Refer to the Reconciliation & definition of alternative
2.
performance measures at the beginning of this presentation for further details
After the IRS and XCCY swaps
Europe legacy New bonds Nov 20 bond API legacy
3. Stable outlook 64Focused on returning to target leverage range within 3 years
Driven by stronger annual free cash flow generation
Europe: deleveraging profile1 supported by working capital improvements2
Rapid Europe deleveraging post merger
to within target range1 supported by:
3.5x
• aligned annual incentives 3.2x
2.8x 2.6x 2.7x
• strong working capital improvements
Transaction provides even greater Cumulative WC
incremental cash generation opportunities improvements
• scope to leverage Europe’s working capital
improvements in API Europe API
]1.35bn
]1.25bn
Committed to similar deleveraging profile ]0.25bn
]0.35bn
Pro forma FCF3
]1.10bn ]0.90bn
2019 2020
1. Target range 2.5-3.0x Net Debt/Adjusted EBITDA. Net Debt/Adjusted EBITDA is a non-GAAP performance measure; 2015 & 2016 are calculated assuming the merger occurred at the beginning of each year presented. 2015 refers to CCEP Overview investor presentation, 25 May 2016; rounded
2. CCEP internal cumulative working capital (WC) improvements
3. FCF is a non-GAAP performance measure. Measure has been computed using information included in 2020 CCEP Integrated Report and 2020 CCL Annual Report and based on the definition included in 2020 CCEP Integrated Report. Not prepared in accordance with US SEC regulation S-X Article 65
11; Average 2020 EUR/AUD FX rate of 1.656; rounded to nearest ]50mConsistent & disciplined capital allocation framework
Focus Maintain
on driving net strong & flexible
operating cash flow balance sheet
(investment grade rating)
]
Organic capital investment c.5%1,2 NSR
FCF of at least ]1.25bn3
Ordinary dividend payout ratio c.50%2
Excess cashflow
Value accretive M&A Return excess cash to shareholders
Maximising sustainable shareholder value & returns >]3.8bn4 cash returns to shareholders since merger
1. ~6% organic capital investment (capex) as a % of revenue, including payments of principal on lease obligations
2. Capex & dividend payout ratio are non-GAAP performance measures - refer to the Reconciliation & definition of alternative performance measures at the beginning of this presentation for further details 66
3. FCF (Free Cash Flow) of at least ]1.25bn after ~6% capex as a % of revenue, including payments of principal on lease obligations; FCF is a non-GAAP performance measure - refer to the Reconciliation & definition of alternative performance measures at the beginning of this presentation for further details
4. Includes dividends of ]2.2bn & share buybacks ]1.6bn since the merger on 26 May 2016 Experienced integration team
DAY 1:
Key talent in place
integration
ready, no risk Joint plans underway with TCCC
of distraction CCEP operating model in place
Great plans for the rest of FY21
69Transaction underpins medium-term objectives
Revenue growth Comparable operating Free Cash Flow Dividend
Low single-digit profit growth1 At least ]1.25bn p.a.1,2 ~50%1,3 payout ratio
Mid single-digit
Ratio maintained, on
Wider business longer-term update to be provided later this year larger earnings base
Dividend to be
announced at Q3 for the
full year to reflect the
earnings of the
enlarged business
1.
2.
Comparable operating profit, Free Cash Flow and Dividend payout ratio are non-GAAP performance measure - refer to the Reconciliation & definition of alternative performance measures at the beginning of this presentation for further details
Free Cash Flow of at least ]1.25 billion after c.5% capital expenditure as a % of revenue, excluding payments of principal on lease obligations; ~6% capex as a % of revenue, including payments of principal on lease obligations
68
3. Dividends subject to Board approvalKey messages
Focused 5
Value & EPS on returning to target
Our business will
accretive leverage range continue to be built
within 3 years on great people, great
service and great
beverages –
Transaction
Dividend policy
underpins
maintained on larger
medium-term
earnings base
objectives
69Remarks from our Chairman
Sol Daurella
Further together: exciting, right deal at the right time
Passion for inclusion & diversity
Value creating with sustainability at the core
Strengthens profile as attractive
total investment return opportunity
7072Thank You
Questions & Answers
712021 Focused actions
Integrate Grow
API the core
Drive
cash flow & Drive
operational smart RGM
efficiency
FURTHER
Progress
TOGETHER Create
sustainability value for
agenda customers
Invest Leverage
in people digital capabilities
74Compelling transaction: Best
practice
A great move Significant sharing
performance
improvement
Structurally opportunities
higher growth
platform
Focused
Dividend policy on returning to
Value Immediate maintained target leverage
creating EPS accretion on larger within 3 years
earnings base driven by stronger
cash generation
Strengthens
relationship
with TCCC
Underpins
medium-term
objectives
73Appendices
7476Glossary
Acronym Definition Acronym Definition
AFH Away From Home NCB Non-Carbonated Beverages
API Australia, Pacific & Indonesia NSR Net Sales Revenue
B2B Business-to-business OBPPC Occasion, Brand, Price, Pack & Channel
B2C Business-to-consumer PET Polyethylene terephthalate (plastic)
BU Business Unit ReCa Restaurants & Cafes
CDSP Customer Demand & Supply Planning Red Right Execution Daily (measure of execution)
D2C Direct-to-consumer RGM Revenue Growth Management
FCF Free Cash Flow ROIC Return on Invested Capital
FMCG Fast Moving Consumer Goods rPET Recycled PET
GHG Greenhouse Gas RSV Retail Sales Value
GM General Manager RTD Ready to Drink
HoReCa Hotels, Restaurants & Cafes RTM Route to Market
KAM Key Account Manager SSD Sparkling Soft Drinks
LTIP Long-term Incentive Plan SKU Stock-keeping Unit
MD Managing Director TCCC The Coca-Cola Company
MUC Unit Cases (in millions) UC Unit Case
NARTD Non-Alcoholic Ready to Drink WACC Weighted Average Cost of Capital
75Key metrics
Operational1 Europe API Financial1 Europe API
Markets2 13 16 29 Revenue €10.6bn €2.9bn €13.5bn
Volume
Consumers >300m >300m >600m 2,277 618 2,895
(muc)
NARTD, Alcohol NARTD, Alcohol Revenue
Portfolio Mainly NARTD €4.69 €4.04 €4.56
& Coffee & Coffee / Case4,6
Adjusted €1.8bn €0.5bn €2.3bn
Coolers3 >1m >0.5m ~1.5m EBITDA5,6
(% margin)
(16.9%) (18.9%) (17.3%)
Plants 48 32 80 CAPEX6,7 €475m €170m €645m
Employees 22k 11k 33k FCF6,7 €0.90bn €0.35bn €1.25bn
1. Data based on 2020 CCEP Integrated Report and 2020 CCL Annual Report, unless otherwise stated. Average 2020 EUR/AUD FX rate of 1.656 5. Not prepared in accordance with US SEC Regulation S-X Article 11. Represents mathematical summation of the equivalent 2020 metrics. For CCEP,
2. CCEP: Spain, Portugal, Great Britain, France, Germany, Iceland, Belgium, Netherlands, Norway, Sweden, Andorra, Luxembourg & Monaco; CCL: Adjusted EBITDA is calculated as earnings before interest, tax, depreciation & amortization., after adding back items impacting the comparability of
Australia, New Zealand, Indonesia, Papua New Guinea, Niue, Tuvalu, Nauru, Tonga, Kiribati, Vanuatu, Solomon Islands, Samoa, Fiji ,Wallis & Futuna, year over year financial performance, as included within 2020 CCEP Integrated Report. For CCL, Adjusted EBITDA refers to On-going EBITDA and is
Tokelau, Cooks Islands calculated as earnings before interest, tax, depreciation & amortization and excluded non-trading items as included within 2020 CCL Annual Report.
3. As at 31 December 2020 for CCEP & CCL Average 2020 EUR/AUD FX rate 1.656
4. Europe calculated as NARTD 2020 total FX-neutral revenue over total unit per case volume; API calculated as NARTD 2020 total FX-neutral revenue 6. FX-neutral revenue, EBITDA, FCF & capex are non-GAAP performance measures- refer to the Reconciliation & definition of alternative performance
over total unit per case volume; excludes revenue from Alcohol & Coffee & Corporate Services; FX-neutral revenue is a non-GAAP performance measures at the beginning of this presentation for further details
measure - refer to the Reconciliation & definition of alternative performance measures at the beginning of this presentation for further details 7. FCF and Capex measures have been computed using information included in 2020 CCEP Integrated Report and 2020 CCL Annual Report and based
on the measures as defined in the 2020 CCEP Integrated Report. Not prepared in accordance with US SEC regulation S-X Article 11; Average 2020
EUR/AUD FX rate of 1.656.; FCF rounded to nearest ]50m; Capex rounded to nearest ]5m
76API: Where we operate
102
production
lines
41
warehouses
32
production
facilities
77API management team biographies
Chris Litchfield Peter West Jorge Escudero
New Zealand & API & member of CCEP Indonesia &
Pacific Islands Executive Leadership Team Papua New Guinea
Over 28 years’ experience with Over 30 years’ FMCG experience, Over 20 years’ FMCG experience,
Coca-Cola Amatil, having joined the having joined Coca-Cola Amatil specialising in non-alcoholic drinks
business as a graduate in 1994 as MD for Australia in 2018 throughout Asia, America & Europe
Held various sales and commercial Previously MD of the Dairy & Drinks Previously CEO of Bepensa Bebidas
roles prior to becoming GM of Sales business at Lion Pty (Mexican Coca-Cola bottler)
& Marketing
Held senior roles at Mars MD of Europe and International
MD of New Zealand & the Pacific Confectionery & Arnott’s Biscuits Ltd Markets for Deoleo
Islands since 2014
Regional President for Continental CEO of Asia-Pacific for Aje Group
Recognised as one of the best Europe for Mars Chocolate in Soft Drinks
Coca-Cola bottlers globally
Deep understanding of Australian & MD of Acqua Minerale San Benedetto
Achieved AON Best New Zealand international FMCG for the Iberian Market
Employer for the 5th consecutive year
78Australia: Factsheet
Key facts Brands Volume mix1
3%
5%
TCCC: 75%
19%
325M Unit Cases ]1.9BN Revenue
2%
NARTD Coca-Cola
Flavours, Mixers & Energy
29 59 Coffee
NARTD Alcohol
RTD Coffee, Tea, Juices & Other 54%
Alcohol
Brands Brands Hydration
25%
92%
API: 17%
25M Population 100K Customers Pack mix1 Sustainability
7/10 50%
120K Coolers 3K Employees Plastic bottles rPET for
OTHER: 8%
made from 100% rPET Australian portfolio
41% 33% 2% 24%
PET Can Glass Other 11%
13 Production Sites 13 Warehouses Priority small packs: 23% Reduction2 achieved sugar grams per 100ml
1. 2020 volume and pack mix (unit cases); rounded to nearest percent
79
2. 2020 vs 2015 reduction in sugar grams per 100mlAustralia: NARTD category & channel mix
Market CCEP – Australia FY19 – NARTD Channel Mix
Category mix 2022-2025 CAGR2 2019 combined category share1 Channel mix Volumes Revenue
Cola 28% ~80%
Home
Hypers/Supers 40%
40%
Home Home
2% - 3%
54% 57%
Sparkling
flavours 18%
~35%
HoReCa 17%
Energy 11% 8% - 9% ~20%
Convenience/Traditional
Hydration 20% 6% - 7% ~30% retail 19% AfH
60% Away from Away from
RTD Coffee 6% 6% - 7% ~7% home home
QSR 11% 46%
RTD Tea 3% 14% - 15% ~5% 43%
Other 15% 0% - 1% ~4% Leisure 8%
Institutions 2%
Other 3%
NARTD ]9bn 2.5% - 3.5% ~40%
1. Global Data FY2019. Market = AUS
80
2. HoReCa is Hotel/Restaurant/Café; QSR is Quick Serve Restaurants; Convenience includes Convenience Stores and Food To Go; Other includes Vending, Home Delivery & Specialist Beverage Retailer. [Global Data excludes Disco/Bar/Night Club and Travel/Transportation]Pacific: Factsheet
Key facts Brands Volume mix1
1%
7%
TCCC: 79%
16%
83M Unit Cases ]513M Revenue
NARTD Coca-Cola 37%
11% Flavours, Mixers & Energy
36 4 Coffee
RTD Coffee, Tea, Juices & Other
NARTD Alcohol Alcohol
Brands Brands Hydration
92% 36%
API: 15%
5M Population 22K Customers Pack mix1 Sustainability
100% 100%
rPET for all single Electricity from
45K Coolers 2K Employees serve plastic bottles renewable sources3
OTHER: 6%
62% 18% 7% 13%
PET Can Glass Other 9%
9 Production Sites 9 Warehouses Priority small packs: 24% Reduction2 achieved sugar grams per 100ml
All figures include New Zealand & the Pacific Islands unless stated otherwise
1. 2020 volume and pack mix (unit cases); rounded to nearest percent 81
2. 2020 vs 2015 reduction in sugar grams per 100ml
3. New Zealand onlyNZ: NARTD category & channel mix
Market CCEP – New Zealand FY19 – NARTD channel mix
Category mix 2022-2025 CAGR2 2019 combined category share1 Channel mix Volumes Revenue
Cola 22% ~80%
3% - 4% Home
Hypers/Supers 52% Home Home
Sparkling 52% 54% 52%
flavours 21% ~60%
Energy 22% 3% - 4% ~20%
HoReCa 20%
Hydration 12% 5% - 6% ~35% Away from Away from
AfH
RTD Coffee 1% 6% - 7% ~10%
Convenience/Traditional home home
48%
RTD Tea 1% 12% - 13% ~10% retail 16% 46% 48%
Other 21% 1% - 2% ~25% QSR 3%
Leisure 6%
Institutions
Other 2% 1%
NARTD ]1.5bn 3.5% - 4% ~45%
1. Global Data FY2019. Market = NZ 82
2. HoReCa is Hotel/Restaurant/Café; QSR is Quick Serve Restaurants; Convenience includes Convenience Stores and Food To Go; Other includes Vending, Home Delivery & Specialist Beverage Retailer. [Global Data excludes Disco/Bar/Night Club and Travel/Transportation]Indonesia: Factsheet
Key facts Brands Volume mix1
10%
21%
210M Unit Cases ]577M Revenue
Coca-Cola
23% Flavours, Mixers & Energy
0 NARTD
TCCC: 99%
13 NARTD Alcohol
RTD Coffee, Tea, Juices & Other
Brands Hydration
Brands
46%
100%
274M Population 473K Customers Pack mix1 Sustainability
17.2% 35%
Reduction2 achieved in Reduction2 targeted
337K Coolers 6K Employees
OTHER: 1%
sugar grams per 100ml in sugar grams per
100ml by 2025
73% 16% 1% 10%
PET Can Glass Other 1,600
10 Production Sites 19 Warehouses Priority small packs: 66% Megalitres of water replenished annually
All figures include Indonesia & Papua New Guinea
1. 2020 volume and pack mix (unit cases); rounded to nearest percent 83
2. Since 2015Indonesia: NARTD Category & channel mix
Market CCEP – Indonesia FY19 – NARTD channel mix
Category mix 2022-2025 CAGR2 2019 combined category share1 Channel mix Volumes Revenue
Cola 2% 1% - 2% ~90% Home
Hypers/Supers 6%
Sparkling flavours 6% 6%
Energy 6% 3% - 4%You can also read