Purple Investor Presentation - Global Partner Acquisition Corp

Page created by Jimmy Gutierrez
 
CONTINUE READING
Purple Investor Presentation - Global Partner Acquisition Corp
Purple Investor Presentation
December 2017
Purple Investor Presentation - Global Partner Acquisition Corp
Company overview

Company overview                                                                 Net revenue ($m) and growth (%)

   Who: Purple is a leading comfort technology company that                                   $190.1
    leverages its operational and innovation expertise to design and
    sell a portfolio of patented comfort products backed by a unique
    brand                                                                               190%                                      $133.8

   What: Purple designs, manufactures and sells a range of comfort                                                        227%
    technology offerings, including mattresses, a pillow, cushions,
                                                                                     $65.5
    sheets, bed platforms and other products
                                                                                                                    $40.9

                                                                                     2016      2017E               9M 2016        9M 2017
   Why: Purple exists to help people feel better. The Company’s
    goal is to bring comfort to lives around the world, whether they             Adjusted EBITDA ($m) and margin (%)(1)
    are sitting, sleeping or standing(1)

   How: Purple operates with a strategy of profitable growth through                $2.6
    direct-to-consumer channels. Purple has bootstrapped its efforts,                                               $2.1
    investing everything back into product innovation, production and
    marketing

   When: Purple officially launched on January 22, 2016 with the
    “Goldilocks” commercial after a successfully funded Kickstarter                            ($0.5)
    campaign in September 2015
                                                                                                                                   ($2.1)
   Where: Headquarters sit at the base of the Wasatch Mountains in
    Alpine, Utah. Most manufacturing, assembly and shipping is done                  2016      2017E               9M 2016        9M 2017
    out of Grantsville, Utah. The Company is proud to bring
    manufacturing and jobs to the U.S.                                               3.9%      (0.3%)               5.2%           (1.6%)

                          Note: Refer to pages 37-39 for GAAP reconciliation
                          (1) Purple has not yet entered into the stand market                                                              1
Purple Investor Presentation - Global Partner Acquisition Corp
GPAC investment thesis

     Attractive financial profile characterized by a rare combination of hyper-growth and scale. The Company achieved net revenue of $133.8m in the
 1
     first 9 months of 2017, reflecting 227% year-over-year growth. GPAC believes that Purple is well positioned to continue its dynamic growth trajectory

     Large and growing bedding industry. The over $22.4bn U.S. bedding industry is large and growing and is being revolutionized by direct-to-consumer
 2   distribution models. Purple is a leader in the direct-to-consumer segment and aims to further drive industry change across the sit, sleep and stand
     categories(1)(2)

     History of innovation. The Company’s founding team has a strong track record of innovation over the past 20+ years and GPAC believes that Purple’s
 3
     design, development and manufacturing expertise position it to continue to release innovative new technologies, products and manufacturing machines

     Proprietary and patent protected technology. Purple has differentiated, proprietary and patent protected comfort-related technologies, machines,
 4   packaging and products(3). Moreover, the Company and its owners have over 20 years of experience protecting IP and licenses. GPAC believes that the
     Company’s intellectual property and expertise provide strong and sustainable competitive advantages

     Proprietary and patent protected manufacturing processes. Proprietary manufacturing processes, equipment and know-how allow Purple to efficiently
 5
     produce its differentiated, high-performing products

     Vertically integrated. Vertical integration enables the Company to rapidly test, learn and scale, thereby improving design and development capabilities as
 6
     well as increasing operational efficiency

     Innovative and effective social marketing capabilities. Effective digital and social marketing has created viral brand awareness that has driven
 7
     consumer demand

     Multiple avenues for future growth. Purple has many opportunities to continue to drive growth including further direct-to-consumer penetration, product
 8
     innovations and category extensions, selling through "brick-and-mortar" retailers and expanding sales beyond the U.S.

 9   Experienced leadership team with a proven track record. Purple is led by a seasoned team of industry experts that have helped to create and define
     the category and are highly qualified to execute the Company's strategic vision

                      (1)   Purple has not yet entered into the stand market
                      (2)   Market size estimate based on data from ISPA, Wall Street research and Furniture Today                                                2
                      (3)   Purple owns or has exclusive rights to use 78 issued or pending patents
Purple Investor Presentation - Global Partner Acquisition Corp
Company overview
Purple Investor Presentation - Global Partner Acquisition Corp
Investment highlights

            Purple is recognized as a leading comfort technology brand
that designs and manufactures products to improve how people sleep, sit & stand(1)
1                                           2                                               3                                  4
      Market opportunity                              Unique technology                         Innovative product portfolio            Vertical integration

                                                                                            Success across multiple product
Large and growing market, with a            Backed by proprietary comfort and                                                      Purple’s integrated innovation,
                                                                                               categories leveraging the
  DTC segment that more than                  manufacturing technologies,                                                           manufacturing and marketing
                                                                                             Company’s proprietary Hyper-
doubled its market share between               know-how and design and                                                             capabilities provide competitive
                                                                                            Elastic Polymer® technology and
        2015 and 2016(2)                         development expertise                                                                        advantages
                                                                                                    innovative design

5                                           6                                               7                                  8
    Go-to-market strategy                           Growth opportunities                               Proven team                            Financial

Innovative marketing capabilities                                                           Experienced team of innovation,
  with multi-channel distribution               Open runway for growth and                    technology, manufacturing,           Attractive intersection of hyper-
   strategy drive strong brand                   expansion opportunities                    marketing, data management and                 growth and scale
     awareness and adoption                                                                           retail experts

                         (1)   Purple has not yet entered into the stand market
                         (2)   Based on ISPA estimates and published Wall Street research                                                                              4
Purple Investor Presentation - Global Partner Acquisition Corp
Purple changes lives

“I am disabled and suffer from Spastic Cerebral Palsy.                                             “My husband and I love our purple mattress. We both
My disability causes me to suffer with constant back                                               use to wake up feeling crippled but now the aches and
and leg pain. After the first night of sleeping on our                                             pains are gone. The Purple material is totally unique
Purple, I had no pain at all, and have had no pain since.                                          and superior to any other bed out there.”
This product has saved my life.”

                                                                           − Vinny                                                                  − Kim G.

“Serious, go get one, finance one, buy one if you can                                              “In the past I've always struggled with lower back pain.
afford it. Do it now! My back is incredible and thanks                                             Since I've slept on the Purple mattress, my lower
me every day.”                                                                                     back pain has disappeared.”

                                                                         − Ilan A.                                                                 − Mike W.

“We LOVE our Purple mattress. I originally purchased                                               “For the first time in about 20 years I have not awoken
this because my husband often woke up with a sore                                                  during the night due to hip pain. From the first night till
back, sore knees, and numbness. Not anymore!”                                                      now, the Purple mattress has been a God send.”

                                                                − Michelle B.                                                                    − Susan S.

                                                        See www.purple.com/reviews

                    Note: Purple does not guarantee the same or similar results for any consumer
                                                                                                                                                                 5
Purple Investor Presentation - Global Partner Acquisition Corp
1 Purple has a large and growing market opportunity

Purple addresses a large sleep market with sit and stand providing additional upside(1)

                                                                                                           Consistently growing market disrupted by direct-
  Segmentation of U.S. bedding industry (2016) ($bn)                                                       to-consumer entrants(3)

                                                                                                               Since 1984, the U.S. mattress industry has
                 (2)
   Mattresses                                                      17.5                                         exhibited stable, long-term growth with a 5%
                                                                                                                CAGR
    Sheets &                                                                                                      ―   Since 1984, the mattress market has seen
     mattress                                                                3.2
    protectors
                                                                                                                      growth in all but two years despite 3
                       Complementary products                                                                         recessionary periods
                         such as pillows and
       Pillows         cushions further expand                                   1.3
                            opportunities
                                                                                                               Steady increase in average selling prices

     Mattress
                                                                                   0.4                         Contracting replacement cycles driven by
      pads
                                                                                                                increasing focus on sleep & health

 Total bedding
                                                                                    22.4                       Direct-to-consumer sellers are taking share from
   industry
                                                                                                                traditional incumbents

                         (1) Purple has not yet entered into the stand market
                         (2) “Mattresses” includes sales of mattresses and foundations by traditional manufacturers and total revenues of DTC mattress players     6
                         (3) Commentary based on ISPA report
                         Source: ISPA, Wall Street research, Furniture Today, Better Sleep Council
Purple Investor Presentation - Global Partner Acquisition Corp
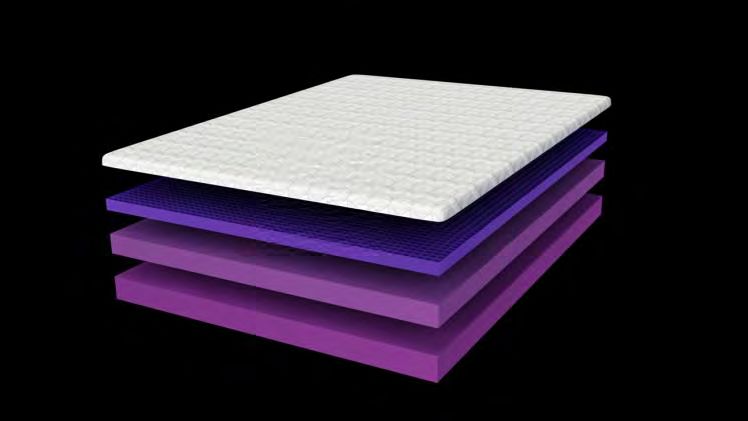
1 Purple is poised for greater DTC market penetration and disruption

                                                                                                           The industry is still in relatively early stages in terms of
U.S. mattress industry is large, stable and                    growing(1)(2) ($bn)                         online penetration

                                                        ’16 – ‘17E CAGR
                                                                                                                 Market share of top 500 e-Commerce retailers by category - 2016(3)
                                                     18.1          4%
                                      17.5
                                                      1.2         60%                                                    Books, Music, & Video
                         16.5          0.8
                                0.3 16.7             16.9          1%                                                               Office Supplies
            15.1         16.2
                   0.1                                                                                                Computers & Electronics
   14.0                                                            DTC revenues are
            15.0                                                      expected to                                                  Flowers & Gifts
                                                                  quadruple between
                                                                    2015 and 2017(2)                                           Toys and Hobbies
                                                                                                                         Apparel & Accessories
                                                                  Purple has room for                                              Mass Merchant
                                                                  further DTC market
                                                                                                          Housewares & Home Furnishings                                 Mattresses still exhibit a
                                                                      penetration
                                                                                                                                                                           low level of online
                                                                                                                                   Sporting Goods                        penetration, with ample
                                                                 Targeted markets are                                                                                  room to grow market share
                                                                   DTC, traditional                                                           Jewelry
                                                                  mattress retail and                                                       Specialty
                                                                  mass retail. Purple
                                                                    has active B2B                                                       Mattresses              ~5%
                                                                 programs in each of                       Hardware & Home Improvement
                                                                    these markets
                                                                                                                                 Automotive Parts
                                                                                                                                  Health & Beauty
                                                                                                                                       Food & Drug
   2013    2014          2015         2016          2017E                                                                                                0%        20%        40%        60%        80%         100%
          Traditional    Direct-to-consumer

                           (1) “U.S. mattress industry” includes sales of mattresses and foundations by traditional manufacturers and total revenues of DTC mattress players
                           (2) “Traditional” per ISPA, multiplied by a 2.0x retail markup; “Direct-to-consumer” per published Wall Street research, representing total revenues of e-Commerce mattress brands          7
                           (3) Internet Retailer 2016 Top 500 guide
                           Source: ISPA, Wall Street research, Furniture Today, Better Sleep Council
Purple Investor Presentation - Global Partner Acquisition Corp
1 Purple’s massive market share gains

                                                                               Purple’s brand recognition is growing at a rapid clip…(1)

                            100
Google interest over time

                             80

                             60

                             40

                             20

                              0
                              T+0                                       T + 13                                            T + 26                                            T + 39                                            T + 52
                                                                                                              Months after launch (T)

                                                                        Purple was officially launched one year after Helix, two years after Leesa and
                                                                               Casper, four years after Tuft & Needle and 6 years after Saatva

                                                                          …translating into rapid market share gains vs. competitors(2)
                                                 U.S. mattress market                                                                                                U.S. direct-to-consumer channel
                                  2017E market share                         ’15 – ‘17E market share                                                      2017E market share                           ’15 – ‘17E market share
                                                                                   change (bps)                                                                                                              change (bps)
                                    DTC
                                    6.9%
                                                                                                                                                       Other
                                                                                                                                                          12.4%                15.3%
                                                                                                                                                                                                                                 1,329
                                                                                                          507 DTC                                  6.0%
                                                                                                                                                                                                                       265

                                                                                                                                                                                                                       191
                                                                                                                                              12.0%
                                                                                                                                                                                         24.1%              (147)
                                                               Traditional
                                                                            (507)                                                                                                                   (760)
                                                              manufacturers
     Traditional                                                                                                                                  12.0%
                                                                                                                                                                                                  (969)
    manufacturers
       93.1%                                                                                                                                                           18.1%

                                                       (1)  Google Trends, U.S.A. as of November 2017. Benchmarked out of 100
                                                       (2)  “U.S. mattress market” includes sales of mattresses and foundations by traditional manufacturers and total revenues of DTC mattress players. Purple market share shown based on   8
                                                            total net revenue
                                                       Source: ISPA, Wall Street research, Google, Furniture Today, Better Sleep Council
Purple Investor Presentation - Global Partner Acquisition Corp
2 One of a kind solution

Other products in market                                     Purple’s game-changing comfort technology mattress

                                                                           Purple’s comfort technology,
                                                                           performance and unique feel
                                                                            differentiates the mattress

      Proprietary Tempur             Memory foam,
        material (foam)            polyurethane foam

                              Steel coils, memory foam and
   Memory foam, coil hybrid
                                    polyurethane foam

                                                                   A superior product at a competitive price that
                                                                   is functionally different and visually unique

                                                                      Hyper-Elastic Polymer® Smart-Comfort
                                   Polyurethane foam                    Grid and quality cushioning base
      Memory foam, coil

      Competing offerings are either soft OR firm                          Purple is both soft AND firm

                                                                                                                    9
2 Purple’s innovative proprietary and patented technologies

History of innovation led to the rise of comfort technologies across sleep, sit and stand(1)

                                                                                Free Air Flow
                                                         Purple’s column design allows air to flow freely,
                                                     thereby preventing moisture trapping, extending the life
                                                       of the mattress and seat cushions while providing a
                                                              cleaner, more comfortable experience
   Hyper-Elastic Polymer®                                                                                            Temperature Neutral

    Purple’s proprietary and
    patented Hyper-Elastic
 Polymer®, one of a portfolio of                                                                                Purple doesn’t sleep or sit hot or
advanced comfort technologies;                                                                                   cool; instead, customers say
   a blend of chemistry and                                                                                               “it’s perfect”
geometry originally designed to
  combat compression sores

                                                                Pressure-Releasing Comfort & Support

                                                       Purple’s proprietary and patented pressure-releasing
                                                       technology provides excellent support for your spine
                                                       and back with noticeably lower pressure on hips and
                                                                             shoulders

                                                                                                                             
               Food-grade                                                        Non-toxic                            Hypoallergenic
                       (1)   Purple has not yet entered into the stand market
                                                                                                                                                     10
2 Competitive moat with multiple barriers to entry

      Proprietary & patent                                                                        Process knowledge and
                                                    Proprietary processes
      protected technology                                                                              know-how

   Proprietary and patent-protected comfort      Purple designed and developed Mattress        Extensive expertise that can only be
    technologies and Mattress Max™                 Max™ and cushion molding machinery to          gained from years of hands-on
    machinery                                      enable Hyper-Elastic Polymer® molding at       manufacturing of our unusual materials
                                                   scale                                          and machines
   Competitors in general use the same
    old, basic materials - a mix of memory                                                       Mass manufacturing enables Purple to
    and polyurethane foam, steel coils and        Significant investments to develop             price into the majority of the market
    latex foam                                     machinery and trade-secrets over last 20
                                                   years creates a strategic advantage           Vertical integration enables rapid
   78 granted and pending patents owned                                                          innovation and continuous improvement
    or exclusive right to use in
     – Comfort technologies                                                                      On-site fabrication and repair teams
     – Manufacturing                                                                              enable high manufacturing uptime and in-
     – Products                                                                                   house development of new equipment
     – Packaging

                                    Purple maintains a strong competitive moat

                                                                                                                                             11
3 Expanding product portfolio creates compelling long-term value proposition

                                                                                                                                               Relieves tension using full-body
                                                                                                                                                massagers with variable comfort levels
                                                                                                                                               Elevates feet to reduce discomfort and
         Patented                                                              Strong, squeak-free platform with                              improve blood flow
          advanced comfort                                                       value pricing
                                                                                                                                               Customized comfort positions
          technology                                                             2.5 inches taller than standard
                                                                             
                                                                                                                             PowerBase
                                                                                 foundation – no boxspring needed
                                                                                 Provides more under-bed storage
                                                                             

                                                                                 space                                                              Multiple customer entry points
                          Mattress                            World’s first                                                                         across different price points
                        (The Purple Bed)                       bamboo-based,
                                                               ultra stretchy,
                                                               seamless sheets
                                                                                                                                                    Varying product replacement
                                                                                                                                                     cycle will lead to increased
                                                               for supreme
                                                               comfort                      Platform                                                 purchase frequency
   Hyper-Elastic                                             Makes any bed                  Base
    Polymer®: stretchy and                                     more comfortable                                                                     Synergies between durable
    durable                                                    than non-stretch                            Stretchy mattress                        and consumable products
   Grid pattern designed                                      standard or luxury                           protector leads to
                                     Gentle, invisible        sheets
    to progressively fold                                                                                   deeper, better sleep
                                      neck support for
    and yield under                   additional comfort                                                   Maintains mattress
    pressure                                                                                                comfort
                                     Sleeps cool with
                                      patented Purple                                                      Liquid proof
                                      design

                                                                           Sheets
           Seat                                                                                                                                                 New mattress
         Cushions                                                                                                                                                  models
         (since 2010)                                                                                                Mattress                                    (2H, 2, 3, 4)
                                                  Pillow                                                             Protector

                                                               2016                                                                         2017
                             Q1’16               Q2’16                   Q3’16                Q4’16                  Q1’17          Q2’17               Q3’17                Q4’17

                                                                                                 Launch date

                                                                                                                                                                                         12
4 Innovation + manufacturing + marketing = vertical integration

                 Innovation                                  Manufacturing                                          Marketing

   Dedicated team focused on improving          2 facilities totalling 646,000 sq. ft. located      Highly experienced digital marketing team
    existing products and prototyping new         in Alpine and Grantsville, UT                        that drives strong brand awareness
    designs
   Proprietary and patent-protected Hyper-      Facilities support massive growth                   Innovative marketing partnerships with
    Elastic Polymer® technology                                                                        major brands, including Disney
                                                 Proprietary & patent-protected Mattress              www.youtube.com/watch?v=UFVPBFzRFhY
   78 granted and pending patents owned          Max™ manufacturing equipment
    or exclusive right to use                                                                         Massive social media presence
                                                 Significant investments made to increase
           Manufacturing machines                 capacity and expand redundancy                      Marketing efficiency with high ROI

       Comfort technologies / products

                  Packaging

           Strong IP generation                                                                           Increase brand awareness,
                                                        Scalable infrastructure
               & protection                                                                                engagement & conversion

                                                  Vertically integrated brand
                                                                                                                                                   13
5 Innovative marketing drives unparalleled awareness

Consistent voice promoting a true lifestyle brand…                                    Purple’s video campaigns have extensive social reach
                                                                                                                         Video views

                                                                                          Campaigns

                                                                                                                  146m                 144m
       Sleep                                Sit                            Stand(1)
                                                                                                                   27m                 46m
 Loyal audience that frequently engages with Purple’s viral content
  throughout replacement cycles and across different products                                                      79m                 36m
 925m+ video views across Facebook and YouTube with 600,000+
  fans and subscribers across social media                                                 38 others              285m                 166m
 Efficient customer acquisition with tailored content
                                                                                      10 years of footage is watched every day on our channels(2)

Differentiated branding that is humorous, memorable and communicates unique & compelling product features

                       (1)   Purple has not yet entered into the stand market
                       (2)   As of Q3 2017                                                                                                      14
5 Multi-channel distribution strategy

1   Direct-to-consumer                                         2     Brick-and-mortar relationships                          3   Specialty

   Purple continues to increase sales and                          Established relationships given long                       Catalogue and TV home shopping provide
    penetration through existing channels                            history of products                                         additional levers for sales
   Millions of unique visitors per month                           Ability to reach large store footprint                     Strength in smaller ticket sales / impulse
   Coveted digital platform statistics                                                                                          purchases
    (YouTube, Facebook etc.)
                                                                              Select current partners:(1)

                                                                                                            (Samsclub.com)
4 Retail relationships
   Announced test with Mattress Firm in select locations
   Largest specialty mattress retailer with
    approximately 3,500 stores(2)                                            Consumer curious but
                                                                          would like to test in person,
                                                                          leading to in-store purchase
    Videos + Mobile + Social + Website                                                                                               Purple Zone in stores

                                                                                                   ?
                                                                                  In-store consumer
                                                                                 experience leading to
                                                                                   online purchase

                         (1)   Excluding samsclub.com, only non-mattress products are sold through these channels
                         (2)   2016 Furniture Today, Mattress Firm                                                                                                            15
6 Purple growth opportunities

                                                                               International
                                                                                expansion

                                                         Category & vertical
                                                             expansion

                                              New product
                                           launches across
                                           sleep, sit & stand

                             Existing product
                                innovation

            Multi-channel
          distribution / retail
             relationships

  Direct-to-
 consumer
   growth
& penetration

                                   Purple has multiple vectors to drive growth

                                                                                               16
7 Visionary leaders…

                          Sam led numerous teams at Walmart that were responsible for a $2 billion program to
   Sam
 Bernards                  optimize its global supply chain, a $7 billion program for strategic supplier management and
   Chief                   an $80 billion growth strategy for Walmart U.S., which resulted in the launch of Walmart
 Executive
  Officer                  Express and other innovations
                          Founding member of venture capital firm Peak Ventures, which invested in 31 companies

                          Terry has spent over 20 years focused on designing cushion technology and other products
                          Production, research & development and bringing the brothers’ ideas to life
                          Development of Mattress Max™, Purple’s patented mattress manufacturing machine
                          Over 20 years of experience in manufacturing, design and project management prior to Purple
                          Continues to realize his goal of making millions of people more comfortable
Terry & Tony
   Pearce
  Founders
                          Over 20 years of product development history with Purple’s predecessor companies
                          Tony is the visionary behind Purple’s patented Hyper-Elastic Polymer® technology
                          Has numerous patents and has been key to taking many ideas to the manufacturing stage
                          Over 13 years of experience in advanced aerospace materials and engineering
                          Has transitioned day to day responsibilities to Terry and the Management team

                                                                                                                          17
7 …Complemented by an exceptional executive team

                                   Alex leads the world class marketing and branding teams at Purple
                                    Has experience in both agency and in-house settings, including startups and large
          Alex McArthur         
                                    public enterprises
          Chief Marketing
                                   Experience leading high growth disruption leveraging progressive marketing tactics
              Officer
                                   Led all digital marketing strategies including web, content, mobile, email, social,
                                    analytics and search marketing efforts

                                   13 total years leading retail efforts
              Dan Hill
                                   Managed 13 MyComfort mattress stores
         Chief Retail Officer
                                   Led EquaPressure for 7 years and other wholesale programs for 10 total years

                                    Previously CMO for a large public company as well as an INC 500 company where
               Wayne
                                

            Moorehead               he was instrumental in building their billion-dollar brand
                                    Has led brand strategy at multiple creative agencies where he worked with many
         Chief Brand Officer    
                                    well-known and iconic brands

                                   Spent over a decade at NuSkin, heavily involved with investor relations and other
           Mark Watkins             public company functions
           Chief Financial         Spearheaded hyper-growth at Traeger and was instrumental in securing a major
               Officer              capital investment
                                   15 total years leading financial, HR, legal and IT functions

                                                                                                                          18
7 Complemented by an exceptional executive team (continued)

                                  Held executive leadership roles in pharmaceutical, consumer goods, food and
          Charlie Smith            beverage and international consulting
          Chief Operating         Over 20 years of experience leading supply chain, manufacturing, product
              Officer              development, engineering, real estate and human resources in over 70 different
                                   countries for companies with revenues over $300 million

          Mitch Edwards           Former C-level executive of public and private high-profile e-Commerce, consumer
          Chief Business           electronics, Internet, entertainment and consumer brand companies
           Development            CEO of Overstock.com and CFO & General Counsel of Skullcandy, Razer, BitTorrent
              Officer              and Digital Courier Technologies

                                  23 years of HR and organizational leadership experience with progressive and
           Jodi Deputy             proven track record
          Head of Purple          Global HR leader for industry-leading P&L’s in over 20 countries, focused on organic
             People                growth, mergers & acquisitions and attracting and retaining top talent in high-demand
                                   job markets

         Casey McGarvey           22 years of experience as a trial attorney, 9 years as a general counsel
         Chief Legal Officer      Litigated business cases, such as patent, trademark, anti-trust and products liability

                                                                                                                            19
Investment highlights

            Purple is recognized as a leading comfort technology brand
that designs and manufactures products to improve how people sleep, sit & stand(1)
1                                           2                                               3                                  4
      Market opportunity                              Unique technology                         Innovative product portfolio            Vertical integration

                                                                                            Success across multiple product
Large and growing market, with a            Backed by proprietary comfort and                                                      Purple’s integrated innovation,
                                                                                               categories leveraging the
  DTC segment that more than                  manufacturing technologies,                                                           manufacturing and marketing
                                                                                             Company’s proprietary Hyper-
doubled its market share between               know-how and design and                                                             capabilities provide competitive
                                                                                            Elastic Polymer® technology and
        2015 and 2016(2)                         development expertise                                                                        advantages
                                                                                                    innovative design

5                                           6                                               7                                  8
    Go-to-market strategy                           Growth opportunities                               Proven team                            Financial

Innovative marketing capabilities                                                           Experienced team of innovation,
  with multi-channel distribution               Open runway for growth and                    technology, manufacturing,           Attractive intersection of hyper-
   strategy drive strong brand                   expansion opportunities                    marketing, data management and                 growth and scale
     awareness and adoption                                                                           retail experts

                         (1)   Purple has not yet entered into the stand market
                         (2)   Based on ISPA estimates and published Wall Street research                                                                              20
Recent initiatives update
Mattress Firm

Launch details of pilot test

Start date                            11/22/17

                      Washington, D.C. metro area (open)

Roll-out              Sacramento, CA (week of 12/11/17)

                      Austin, TX (before year-end)

Projected store
                                 50+ pilot test stores
presence

                      Mattresses (new and existing models)
                      PowerBases
                      Pillows
Products
                      Platform bases
offered
                      Sheets
                      Mattress protectors
                      Seat cushions

                   Sales of mattress portfolio and cross-sale of
Preliminary
                    non-mattress products significantly above
results                                                            Dedicated Purple zone and branding
                                  expectations

                                                                                                        22
Product launches

 Product developments                               Components of mattresses

                                 Pricing              The Purple Bed (existing)

                                                                                                            1
                        Twin
                         XL      Queen      King
                                                                                                            2

                                                                                                            3
Existing

           The Purple
              Bed
                        $799     $999      $1,299

                                                      Purple.x (new)

                                                                                                            1
           Purple.2H    $799     $999      $1,299
                                                                                                            2

                                                                                                            4
            Purple.2    $1,049   $1,299    $1,699
                                                                                                            5
New

                                                     1
                                                     1.   Cover
            Purple.3    $1,499   $1,899    $2,499    2.
                                                     2    Hyper-Elastic PolymerTM Smart Comfort GridTM (2”, 3” or
                                                          4”, depending on model)
                                                     3
                                                     3.   High-Density Comfort Polyurethane Foam
                                                     4
                                                     4.   Comfort Polyurethane
            Purple.4    $1,999   $2,499    $3,299
                                                     5
                                                     5.   Dynamic Support Coils

                                                                                                                    23
Financial highlights
Historical financials

Commentary                                                                                                 Net revenue ($m) and growth (%)

Revenue                                                                                                                                 $190.1

   Hyper-growth at scale, achieving 227% year-over-year growth in                                                       190%                                                                       $133.8
    the first 9 months of 2017                                                                                                                                                               227%
                                                                                                                    $65.5
   Growth driven by DTC sales, increasing brand awareness and                                                                                                                        $40.9
    expanding product portfolio
    –    DTC represents 97% of 2017YTD net revenue
                                                                                                                    2016                 2017E                                    9M 2016           9M 2017
    –    Mattresses represents 72% of 2017YTD net revenue
                                                                                                           Adjusted gross profit ($m) and margin (%)
   2017 revenue impacted by capacity constraints – investments
                                                                                                                                         $85.6
    have been made in order to scale unit production
                                                                                                                                                                                                     $59.9
   Limited contribution from retail (no mattress sales)
                                                                                                                    $25.6
                                                                                                                                                                                      $15.3
Adjusted gross margins
   Significant margin expansion, driven by multiple efficiency gains                                               2016                 2017E                                    9M 2016           9M 2017
    associated with scale and manufacturing improvements and
    efficiencies                                                                                                   39.1%                 45.0%                                        37.4%          44.8%

   Benefited from deployment of additional Mattress Max lines
    (Mattress Max #2 and #3) and increased automation in 2017                                              Adjusted EBITDA ($m) and margin (%)

Adjusted EBITDA margins                                                                                             $2.6                                                              $2.1

   Approximately breakeven on an adjusted EBITDA basis
   2017 margins impacted by marketing spend and efficiency due to                                                                       ($0.5)
    increased digital marketing and brand awareness costs, capacity                                                                                                                                  ($2.1)
    constraints and negative publicity from Ghost Bed’s false claims                                                2016                 2017E                                    9M 2016           9M 2017
    in 2017 (1)
                                                                                                                    3.9%                 (0.3%)                                       5.2%           (1.6%)

                          Note: Refer to pages 37-39 for GAAP reconciliation
                          (1) Due to continued investments to expand capacity, under the current forecast, Purple is not expected to be capacity-constrained for the full year 2018                           25
Q3 2017 results

Commentary                                                                                                                                                                                            %∆/
                                                                                                       ($m) (unaudited)                                   Q3 2016                  Q3 2017
                                                                                                                                                                                                 expansion (bps)
Revenue
                                                                                                       Total net revenue                                    $20.2                      $56.0       177.5%
   Continue to experience tremendous growth, achieving year-over-
    year growth of 178% in Q3 2017                                                                         % YoY growth                                        NM                      178%            NM

   Growth driven by DTC sales across entire product portfolio                                         Cost of goods sold                                     12.6                      31.6       149.9%

   Q3 2017 continued to be impacted by capacity constraints(1)                                        Adjusted gross profit                                  $7.6                     $24.4       223.6%

    –   Mattress Max #2 (launched in May 2017) was still in                                                % gross margin                                  37.4%                   43.6%             621.9
        “production ramp” phase for all of Q3 2017, limiting unit
                                                                                                       Marketing and selling                                    4.7                     25.7           NM
        production
                                                                                                           % net revenue                                   23.3%                   45.8%           2,251.4
Adjusted gross margins
                                                                                                       General and administrative                               1.2                       3.1      157.0%
   Significant margin expansion year-over-year, driven by multiple
    efficiency gains associated with scale and manufacturing                                               % net revenue                                    5.9%                       5.4%          (43.4)
    improvements and efficiencies
                                                                                                       Research and development                                 0.2                       0.4       74.1%
Adjusted EBITDA margins
                                                                                                           % net revenue                                    1.0%                       0.6%          (37.8)
   Decline in Q3 2017 margins primarily attributed to increased
    marketing and selling costs                                                                        Total operating expenses                               $6.1                     $29.1       377.0%

    –   Increased ad spend during period to maximize sales over                                            % net revenue                                   30.2%                   51.9%           2,170.3
        labor day and increase brand awareness in anticipation for
        holiday sales in Q4                                                                            Adjusted operating income                              $1.5                      ($4.6)         NM

    –   Increased costs across digital channels including Facebook                                         % operating income margin                        7.2%                       (8.2%)     (1,548.4)
        Platform and Google Brand Search
                                                                                                       Adjusted EBITDA                                        $1.5                      ($4.4)         NM
   Marketing efficiency impacted by increased digital marketing and
    brand awareness costs, as well as capacity constraints across                                          % EBITDA margin                                  7.4%                       (7.8%)     (1,519.9)
    product portfolio

                         (1)   Due to continued investments to expand capacity, under the current forecast, Purple is not expected to be capacity-constrained for the full year 2018
                                                                                                                                                                                                                   26
Projected financials

Commentary
                                                                            ($m) (unaudited)               2016   2017E          2018E
Forecasting & budgeting overview
  Based on top-down and bottoms-up methodologies for financial             Total net revenue             $65.5   $190.1    $370.0 - $480.0
   forecasting and analysis                                                   % YoY growth                  NM    190%      94.7% - 152.5%
  New forecast driven by 2017YTD results and review of assumptions
   by Purple’s new CFO, Mark Watkins, who joined November 2017              Cost of goods sold             39.9    104.5     192.4 - 240.0
Revenue                                                                     Adjusted gross profit         $25.6    $85.6    $177.6 - $240.0
   Growth in DTC sales across entire product portfolio, including full       % gross margin              39.1%   45.0%     48.0% - 50.0%
    year benefit of expanded mattress portfolio in 2018, driving unit
    growth and uplift in blended ASP                                        Marketing and selling          17.9     74.5     155.4 - 182.4
   Broadening retail penetration through existing and new relationships      % net revenue               27.3%   39.2%     42.0% - 38.0%
    (i.e. Mattress Firm pilot test at 50+ locations)
   New product innovations                                                 General and administrative      4.4     11.1      25.0 - 28.8
   International expansion
                                                                              % net revenue               6.8%     5.9%      6.8% - 6.0%
   Due to continued investments to expand capacity, Purple is not
    expected to be capacity-constrained for the full year 2018              Research and development        0.8      1.2       3.0 - 4.0
Adjusted margins
                                                                              % net revenue               1.2%     0.6%          0.8%
  Continued adjusted gross margin improvements driven by efficiency
   gains associated with scale and manufacturing improvements               Total operating expenses      $23.1    $86.9    $183.4 - $215.2
  Increased DTC direct response and brand awareness ad spend
                                                                              % net revenue               35.3%   45.7%     49.6% - 44.8%
  Adjusted EBITDA margin benefit from increased retail penetration
Capital expenditures                                                        Adjusted operating income      $2.5    ($1.3)    ($5.8) - $24.8
  Expected to be $15.0m - $20.0m in 2018E                                    % operating income margin   3.8%    (0.7%)    (1.6%) - 5.2%
Working capital
   Expected to be a use of cash of $10.0m – $15.0m in 2018E, in            Adjusted EBITDA                $2.6    ($0.5)    ($4.0) - $26.6
    addition to a one-time $10.0m -$15.0m catch-up on working capital         % EBITDA margin             3.9%    (0.3%)    (1.1%) - 5.5%
    in Q1 2018

                          Note: Refer to page 28 for 2018E revenue detail
                                                                                                                                              27
Revenue detail

                               2018E
 Opportunities                                                                  Commentary                                                                   Long-term outlook
                               range

                                                       Based on current trends of Purple market share gains and growth                   Expectation of continued rapid growth of DTC for several years,
        DTC              $335m - $365m                  in DTC market overall                                                              and then growing with overall e-commerce growth once DTC
                                                       Assumes no capacity constraints in 2018                                            reaches 20%+ share of total industry sales

                                                                                                                                          Represents small penetration of the overall opportunity with these
       Retail                                          Increased penetration and expansion of product rollout at retailers                retailers
                             $15m - $25m
     (existing)                                         where Purple has had an existing relationship                                     Over 2,000+ possible “doors” at these existing retail relationships
                                                                                                                                           where Purple mattresses and other products could be sold

       Retail                                          Reflects the successful rollout of Mattress Firm pilot program and                Mattress Firm and additional retail partner revenue grows and
   (new, including           $15m - $75m                subsequent, moderate expansion of partnership                                      becomes a more significant portion of revenue mix

   Mattress Firm)                                      New retail relationships                                                          5,000+ of “doors” for Mattress Firm and others

                                                       Continued penetration and expansion in Canada and potential
    International            $2m - $10m                                                                                                   Broad international expansion
                                                        expansion into other international countries

   New products               $3m – $5m                Assumed two new product launches for 2018                                         Continue to introduce comfort technology products to the market

Total 2018E revenue:     $370m - $480m

Revenue bridge ($m)
                                                                                                                                              $45               $6                $4              $425
                                                                                   $167            $13              $370

                       $122                 $3                 $190
      $65

                                                                                                                                                                                 New products
       2016

                       DTC

                                                                2017

                                                                                    DTC
                                           Retail

                                                                                                   Retail

                                                                                                                     2018 (existing)

                                                                                                                                              New retail

                                                                                                                                                                International

                                                                                                                                                                                                   2018 (revised)
                                Note: Revenue bridge based on midpoint of 2018 opportunities
                                                                                                                                                                                                                    28
Purple DTC market share sensitivity

                                                                                                                2018E Purple DTC net revenue ($m)
 ($m) (unaudited)                            2016                2017E                2018E
                                                                                                                                                                 DTC % share of total market
 Market size
 Direct-to-consumer                         $780              $1,245                $1,962
 % YoY growth                             164%                    60%                  58%                                                               9.8%         9.9%         10.0%        10.1%         10.2%

 % total                                      4%                    7%                 10%
                                                                                                                                        Implied DTC
 Traditional                           $16,734              $16,902               $17,662                                               market growth   54.5%       56.0%         57.6%        59.2%         60.8%
 % YoY growth                                 3%                    1%                   4%                                                  %

 % total                                    96%                   93%                  90%
 Total market                          $17,514              $18,147               $19,624                                               17.4% / 2.7%    $335          $338         $342          $345         $349

 % YoY growth                                 6%                    4%                   8%

 Market share

                                                                                                              of DTC market / share ∆
                                                                                                                                        17.6% / 2.9%    $339          $342         $346          $349         $353

                                                                                                                 (DTC net revenue)
                                                                                                                  Purple % share
 Purple DTC net revenue                       $61                $183                  $350
 % YoY growth                                 NM               200%                    91%
                                                                                                                                        17.8% / 3.1%    $343          $347         $350          $354         $357
 % DTC market share                           8%                  15%                  18%
 % DTC market share ∆                         8%                    7%                   3%
 Purple total net revenue                     $65                $190                  $370                                             18.0% / 3.3%    $347          $351         $354          $358         $361

 % YoY growth                                 NM               190%                    95%
 % DTC market share                           8%                  15%                  19%                                              18.3% / 3.6%    $351          $355         $358          $362         $365
 % DTC market share ∆                         6%                    7%                   4%

                      Note: “Traditional” per ISPA, multiplied by a 2.0x retail markup; “Direct-to-consumer” per published Wall Street research, representing total revenues of e-Commerce mattress brands. Purple
                      financials shown at midpoint of “existing” net revenue range. Refer to page 28 for 2018E revenue detail                                                                                         29
                      Source: ISPA, Wall Street research, Furniture Today, Better Sleep Council
Key margin detail

    Key takeaways                                                                                           Adjusted OPEX and COGS as a % of net revenue(1)(2)

     COGS as a % of net revenue improvement driven by multiple
      efficiency gains associated with scale and manufacturing                                                                                              0.6%
                                                                                                                                                                                0.8%
      improvements                                                                                                         1.2%                             5.9%
                                                                                                                                                                             6.8% - 6.0%
      –   Deployment of additional Mattress MaxTM lines and increased                                                      6.8%
          automation in 2017 - 2018
      –   Margin benefit to be driven by more efficient production from
          optimized molding configurations in 2018
                                                                                                                          27.3%                             39.2%
     Marketing and selling expense as a % of net revenue projected to                                                                                                      42.0% - 38.0%
      increase to drive incremental sales growth
      –   Marketing efficiency impacted by increased digital marketing and
          brand awareness costs, capacity constraints and negative
          publicity from Ghost Bed’s false claims in 2017(2)
      –   Continued increase in DTC direct response and brand
          awareness ad spend to support further DTC penetration and
          increased brand awareness
      –   Assumes continued increase in costs across digital channels
          including Facebook Platform and Google Brand Search from                                                        60.9%
                                                                                                                                                            55.0%
          2017 to 2018                                                                                                                                                      52.0% - 50.0%
     G&A as a % of net revenue conservatively assumed to remain
      consistent
     Material R&D investments have already occurred to create core
      capabilities, product portfolio and accumulated expertise
     Adjusted EBITDA margin benefit from increased retail penetration
      from 2017 to 2018                                                                                                    2016                             2017E               2018E
                                                                                                                     COGS                                           Marketing and selling
                                                                                                                     General and administrative                     Research and development

                            Note: Refer to pages 37-39 for GAAP reconciliation
                            (1) Excludes “Loss on disposal of property and equipment”                                                                                                          30
                            (2) Due to continued investments to expand capacity, Purple is not expected to be capacity-constrained for the full year 2018
Purple’s mattress production machinery cycle and manufacturing capacity

 Production timeline for each Mattress Max machine

     0                                         Launch                                         Optimized

                          Build-out                            Production ramp                                               Continued optimization
            Originally took 9-12 months                 Uneven production throughout phase as            Continuous improvement in operations and efficiency result in
                                                          the Company tests and optimizes                   incremental improvements to throughput
            Experience and technology improvements
             will improve phase to 3-4 months            Phase can last 1-3 months

                                                      Launch date                                                           Commentary
                                                                                     Focus in 2016-2017 on manufacturing efficiencies and increasing throughput which
                       Mattress Max #1                    Pre 2016                    resulted in a 8x improvement in throughput since launch
                                                                                     Further efficiency in 2018 can be achieved through optimizing molding configurations

                                                                                     At tail end of production ramp phase
                       Mattress Max #2                    May 2017                   Improved production ramp cycle by leveraging the lessons learned while improving and
                                                                                      optimizing Mattress Max #1

                       Mattress Max #3                December 2017
                                                                                     Able to leverage the many learnings from Mattress Max #1 & #2, leading to shorter build-
                                                                                      out and production ramp cycles
                       Mattress Max #4                    Q1 2018

            Purple’s manufacturing and operational expertise has led to significant optimization and continuous improvement in throughput of
             each Mattress Max

            With Mattress Max #1 – #4, Purple will have a run rate capacity of $600m+, which exceeds 2018 revenue forecast

            Additional capacity investments can be made throughout 2018 to appropriately accommodate future growth

                                                                                                                                                                                 31
Medium-term business outlook

                               Target range             Commentary
                                                 Further DTC growth
                                                 Expand retail penetration
                                                  Cross-sell existing customers
     Revenue growth            35% - 50%+
                                              

                                                 New product introductions
                                                 Category expansion
                                                 International expansion

                                                 Higher margin products due to ASP uplift
                                                  Manufacturing optimization
  Adjusted gross margin           50%+
                                              

                                                 Economy of scale improvements including
                                                  direct material sourcing

                                                 Multi-channel distribution
                                                 Cross-sell of existing customers

 Adjusted EBITDA margin         10% - 15%        Marketing mix optimization
                                                 Marketing efficiency gains from increased
                                                  brand awareness

                                                                                              32
Summary transaction terms

 Key transaction terms                                                                                                              Sources & uses

   Pro-forma enterprise value of $885.5 million                                                                                  Sources (in $ millions)

                                                                                                                                  GPAC cash(2)                                                                                 $121.5
             −   2.1x Purple’s 2018E net revenue midpoint of $425 million
                                                                                                                                  Purple roll-over equity                                                                        801.4
   $50.0 million of cash to fund growth initiatives and for general corporate purposes
                                                                                                                                  Current cash on hand                                                                              3.2
   Existing Purple owners receive an equity value of $860.8                  million (1)
                                                                                                                                  Total sources                                                                                $926.2
             −   Transaction consideration include $59.3 million of cash and 80.1 million
                 shares(2) in GPAC at close (Purple owners rolling 93%+ of their equity)
                                                                                                                                  Uses (in $ millions)
   The minimum cash closing condition is $100 million, net of GPAC’s deal expenses                                               Cash to existing Purple shareholders                                                           $59.3

   1/3 of GPAC Founder shares are forfeited and another 1/3 to be subject to an                                                  Cash to balance sheet to fund growth initiatives                                                 50.0
    earnout, vesting when base shares trade up to $12.50
                                                                                                                                  Purple roll-over equity                                                                        801.4
   All Sponsor Warrants to be transferred to current Purple equity holders, further
                                                                                                                                  Deal expenses ($11.4 from GPAC and $4.0 from Purple)                                             15.4
    aligning their future interests with shareholders
                                                                                                                                  Total uses                                                                                   $926.2

 Pro-forma enterprise value at close (in $ millions, unless noted)                                                                  Illustrative post-transaction ownership breakdown
                                                                                                                                         GPAC              GPAC                                PF shares outstanding (millions)
 GPAC illustrative price per share                                                                     $10.00                         shareholders       sponsor 1%
                                                                                                                                          13%
 Pro-forma shares outstanding                                                                             93.6                                                                                Purple roll-over                     80.1

 Total equity value                                                                                    $935.5
                                                                                                                                                                                              GPAC shareholders                    12.1

 (+) Pro-forma debt(3)                                                                                     0.0
                                                                                                                                                                                              GPAC sponsor shares
                                                                                                                                                                                                                                    1.3
 (-) Cash to balance sheet to fund growth                                                                                                                                                     not subject to forfeiture
                                                                                                        (50.0)
 initiatives and for GCP
                                                                                                                                                                        Purple roll-
                                                                                                                                                                        over 86%              Total share count                    93.6
 Pro-forma enterprise value                                                                            $885.5
 Note: Transaction structure is illustrative, based on current capital structure and subject to change based on updated transaction terms
 (1) Existing Purple owners’ $900.0 million valuation is adjusted by its $38,359,326 of total liabilities, $4,000,000 of expected transaction expenses and $3,155,210 of cash on hand
 (2) Assumes an illustrative per share price of $10.00 and $12,545,000 of available SPAC proceeds will fund the transaction with investors not wishing to participate to be replaced rather than redeemed
 (3) Although the PF debt at close may change, current debt is only $37,165 (capital leases), consisting of the $16,344 of current portion of long-term obligations and $20,821 of long-term obligations figures on the balance sheet

                                                                                                                                                                                                                                          33
Appendix
Comparable company benchmarking
Revenue metrics

2016 – 2018E revenue CAGR
               171%
        155%
 138%
                                                Median: 17%                                        136%                    Median: 40%                                                Median: 7%
                                                                                                              63%
                                                                                                                         51%

                           27%                                                                                                     28%
                                     23%                                                                                                      23%       19%
                                               18%        17%
                                                                    11%        10%                                                                                             11%     8%    7%      6%

  Low   Mid    High

2018E EV / revenue

                           7.0x
                                                Median: 3.6x                                        6.3x                   Median: 2.2x                                               Median: 1.7x

                                     4.6x
                                                4.0x                                                          4.2x
                                                          3.2x
                                                                    2.8x                                                 2.5x
 2.4x                                                                                                                                                                          2.1x
        2.1x   1.8x                                                            2.0x                                                1.9x       1.9x      1.7x                          1.8x   1.7x
                                                                                                                                                                                                     1.0x

  Low   Mid    High

                                        High-growth consumer                      High-growth e-Commerce                        Traditional mattress and furniture

                      Note: Market data as of December 7, 2017. Multiples that are negative, unavailable or above a certain limit (50x) are considered not meaningful (“NM”)
                      Source: Company filings, Wall Street research and FactSet                                                                                                                             35
Comparable company benchmarking
Margin metrics

2018E gross margin
                                                Median: 49%                                                               Median: 48%                                               Median: 36%
                           63%                                                                     66%                                                                     63%
                                     59%
              50%                              53%                                                           51%        50%
 48%    49%                                                                                                                       46%
                                                          46%                                                                               44%
                                                                    42%                                                                                                               42%
                                                                              36%
                                                                                                                                                       30%                                      30%
                                                                                                                                                                                                          23%

  Low   Mid   High

2016 – 2018E gross margin expansion (bps)

                                                Median: 128                                                              Median: (210)                                                Median: 47

        988   1,088
  888
                           760
                                     498
                                                184                                                                                                                         137        85
                                                           71        70         10                  61                                                                                            9

                                                                                                             (21)       (68)                                                                              (68)
                                                                                                                                 (352)
                                                                                                                                            (647)
                                                                                                                                                     (1,752)
  Low   Mid   High

                                        High-growth consumer                      High-growth e-Commerce                       Traditional mattress and furniture

                      Note: Projections based on Wall Street research unless otherwise noted. Financials are normalized (adjusted for stock-based compensation, one-time items and amortization of intangibles)
                      Source: Company filings, Wall Street research and FactSet                                                                                                                                   36
Projected non-GAAP income statement

($m) (unaudited)                                                   2016     2017E          2018E        9M 2016   9M 2017

Total net revenue                                                   $65.5   $190.1    $370.0 - $480.0    $40.9    $133.8
  % YoY growth                                                       NM      190%     94.7% - 152.5%      NM       227%
Cost of goods sold                                                  39.9     104.5     192.4 - 240.0      25.6      73.9
Adjusted gross profit                                              $25.6     $85.6    $177.6 - $240.0    $15.3     $59.9
  % gross margin                                                  39.1%     45.0%     48.0% - 50.0%     37.4%     44.8%
Marketing and selling                                               17.9      74.5     155.4 - 182.4      10.0      54.0
  % net revenue                                                   27.3%     39.2%     42.0% - 38.0%     24.4%     40.3%
General and administrative                                            4.4     11.1      25.0 - 28.8        2.7       7.6
  % net revenue                                                     6.8%     5.9%      6.8% - 6.0%       6.7%      5.7%
Research and development                                              0.8      1.2       3.0 - 4.0         0.5       0.9
  % net revenue                                                     1.2%     0.6%         0.8%           1.3%      0.7%
Total operating expenses                                           $23.1     $86.9    $183.4 - $215.2    $13.2     $62.5
  % net revenue                                                   35.3%     45.7%     49.6% - 44.8%     32.3%     46.7%
Adjusted operating income                                            $2.5    ($1.3)    ($5.8) - $24.8     $2.1      ($2.6)
  % operating income margin                                         3.8%    (0.7%)     (1.6%) - 5.2%     5.1%      (1.9%)
Adjusted EBITDA                                                      $2.6    ($0.5)    ($4.0) - $26.6     $2.1      ($2.1)
  % EBITDA margin                                                   3.9%    (0.3%)     (1.1%) - 5.5%     5.2%      (1.6%)

                        Note: Refer to page 28 for 2018E revenue detail
                                                                                                                             37
Adjusted EBITDA reconciliation

($m) (unaudited)                                                    2016           2017E         2018E         9M 2016    9M 2017

Net income                                                            ($1.9)        ($2.4)   ($20.6) - $6.5      ($1.7)     ($3.4)
  Depreciation & amortization                                              0.1        0.8            1.8           0.0        0.5
  Net interest expense                                                     0.0        0.1            0.3           0.0        0.0
  Other expense, net                                                       (0.0)     (0.0)             -          (0.0)      (0.0)
  Income tax expense                                                         -          -            3.1             -          -
EBITDA                                                                ($1.8)        ($1.6)   ($18.5) - $12.1     ($1.6)     ($3.0)
  Loss on disposal                                                         0.0        0.0              -             -        0.0
  Legal fees                                                               0.2        0.8            0.9           0.1        0.6
  Deal fees                                                                  -        0.3           13.6             -        0.3
  Related party royalties                                                  4.1          -              -           3.6          -
Adjusted EBITDA                                                        $2.6         ($0.5)   ($4.0) - $26.6      $2.1       ($2.1)
  % EBITDA margin                                                    3.9%          (0.3%)    (1.1%) - 5.5%      5.2%       (1.6%)

                         Note: Refer to page 28 for 2018E revenue detail
                                                                                                                                     38
Adjusted COGS and G&A reconciliation

($m) (unaudited)                                                   2016           2017E         2018E         9M 2016    9M 2017

GAAP COGS                                                           $44.0         $104.5    $192.4 - $240.0    $29.2      $73.9
  Related party royalties                                                 (4.1)        -              -          (3.6)        -
Adjusted COGS                                                       $39.9         $104.5    $192.4 - $240.0    $25.6      $73.9
  % net revenue                                                   60.9%           55.0%     50.0% - 52.0%     62.6%      55.2%

($m) (unaudited)                                                   2016           2017E         2018E         9M 2016    9M 2017

GAAP gross profit                                                   $21.5          $85.6    $177.6 - $240.0    $11.7      $59.9
  Related party royalties                                                 4.1          -              -          3.6          -
Adjusted gross profit                                               $25.6          $85.6    $177.6 - $240.0    $15.3      $59.9
  % net revenue                                                   39.1%           45.0%     48.0% - 50.0%     37.4%      44.8%

($m) (unaudited)                                                   2016           2017E         2018E         9M 2016    9M 2017

GAAP general & administrative                                         $4.6         $12.2     $39.5 - $43.3      $2.8       $8.5
  Legal fees                                                              (0.2)     (0.8)          (0.9)         (0.1)      (0.6)
  Deal fees                                                                 -       (0.3)         (13.6)           -        (0.3)
Adjusted general & administrative                                     $4.4         $11.1     $25.0 - $28.8      $2.7       $7.6
  % net revenue                                                     6.8%           5.9%      6.0% - 6.8%       6.7%       5.7%

                        Note: Refer to page 28 for 2018E revenue detail
                                                                                                                                    39
Disclaimer

This Investor Presentation is for informational purposes only and does not constitute an offer to sell, a solicitation of an offer to buy, or a recommendation to purchase any equity, debt or other financial instruments of Purple Innovation, LLC (“Purple” or the “Company”) or GPAC
or any of Purple’s or GPAC’s affiliates’ securities (as such term is defined under the U.S. Federal Securities Laws). This Investor Presentation has been prepared to assist interested parties in making their own evaluation with respect to the proposed business combination of
Purple and GPAC and for no other purpose. The information contained herein does not purport to be all-inclusive. The data contained herein is derived from various internal and external sources. No representation is made as to the reasonableness of the assumptions made
within or the accuracy or completeness of any projections, modelling or back-testing or any other information contained herein. Any data on past performance, modeling or back-testing contained herein is no indication as to future performance. Purple and GPAC assume no
obligation to update the information in this Investor Presentation. This Investor Presentation contains certain non-GAAP financial information and forward-looking information which will not be included in future public filings or investor guidance. The inclusion of financial
information or metrics in this presentation should not be construed as a commitment by Purple to provide guidance on such information in the future. The trademarks and trademark symbols used herein are the properties of their respective companies.

These slides include financial information and estimates based on Purple’s financial results through June 30, 2017. Purple has not yet finalized its September 30, 2017 financial information, and advises that the guidance and projections set forth in these slides are subject to
change. Purple reiterates the full year 2017 net revenue guidance of $190 million. However, based on increased operating expenses incurred for the period following June 30, 2017, including sales and marketing expense, Purple has advised GPAC that it now expects
profitability on an Adjusted EBITDA basis to be approximately breakeven for the full year 2017.

Use of Projections
This Investor Presentation and the proxy statement referred to below contain financial forecasts with respect to Purple’s estimated net revenues, gross profit, gross margin, EBITDA and EBITDA margin for Purple’s fiscal years 2017 and 2018. Neither GPAC’s independent
auditors nor the independent auditors of Purple audited, reviewed, compiled or performed any procedures with respect to the projections for the purpose of their inclusion in this Investor Presentation and, accordingly, neither of them expressed an opini on or provided any other
form of assurance with respect thereto for the purpose of this Investor Presentation. These projections should not be relied upon as being necessarily indicative of future results.

In this Investor Presentation certain of the above-mentioned projected financial information has been repeated (in each case, with an indication that the information is an estimate and is subject to the qualifications presented herein), for purposes of providing comparisons with
historical data. The assumptions and estimates underlying the prospective financial information are inherently uncertain and are subject to a wide variety of significant business, economic and competitive risks and uncertainties that could cause actual results to differ materially
from those contained in the prospective financial information. Accordingly, there can be no assurance that the prospective results are indicative of the future performance of GPAC or Purple or that actual results will not differ materially from those presented in the prospective
financial information. Inclusion of the prospective financial information in this Investor Presentation should not be regarded as a representation by any person that the results contained in the prospective financial information will be achieved.

Forward Looking Statements
Certain statements made in this Investor Presentation are “forward looking statements” within the meaning of the “safe harbor” provisions of the United States Private Securities Litigation Reform Act of 1995. When used in this Investor Presentation, the words “estimates,”
“projected,” “expects,” “anticipates,” “forecasts,” “plans,” “intends,” “believes,” “seeks,” “may,” “will,” “should,” “future,” “propose,” “poised,” “opportunities” and variations of these words or similar expressions (or the negative versions of such words or expressions) are intended
to identify forward-looking statements. These forward-looking statements are not guarantees of future performance, conditions or results, and involve a number of known and unknown risks, uncertainties, assumptions and other important factors, many of whi ch are outside
GPAC’s or Purple’s control, that could cause actual results or outcomes to differ materially from those discussed in the forward-looking statements. Important factors, among others, that may affect actual results or outcomes include: the inability for any reason to close the
merger transaction contemplated by the merger agreement; the inability to recognize the anticipated benefits of the proposed business combination, which may be affected by, among other things, the amount of cash available following any redemptions by GPAC stockholders;
the ability to meet NASDAQ’s listing standards following the consummation of the transactions contemplated by the proposed business combination; costs related to the proposed business combination; Purple’s ability to manage growth; Purple’s ability to execute its plans to
develop and market new products and the timing and costs of these development programs; Purple’s estimates of the size of the markets for its products; the rate and degree of market acceptance of Purple’s products; the success of other competing cushioning and bedding
technologies that exist or may become available; Purple’s ability to identify and integrate acquisitions; the performance of Purple’s products; rising costs or pricing pressures adversely affecting Purple’s profitability; potential litigation involving GPAC or Purple or the validity or
enforceability of Purple’s intellectual property; general economic and market conditions impacting demand for Purple’s products ; the possibility that Purple may be adversely affected by other economic, business and/or competitive factors; and other risks and uncertainties
indicated from time to time in the definitive proxy statement of GPAC, including those set forth under “Risk Factors” therein, and other documents filed or to be filed with the SEC by GPAC. Neither GPAC nor Purple undertakes any obligation to update or revise any forward-
looking statements, whether as a result of new information, future events or otherwise, except as required by law.

Industry and Market Data
In this Investor Presentation, Purple relies on and refers to information and statistics regarding market shares in the sectors in which it competes and other industry data. Purple obtained this information and statistics from third-party sources, including reports by market
research firms, such as KeyBanc Capital Markets Inc. Purple has supplemented this information where necessary with information from discussions with Purple customers and its own internal estimates, taking into account publicly available information about other industry
participants and Purple’s management’s best view as to information that is not publicly available.

Use of Non-GAAP Financial Measures
This Investor Presentation includes non-GAAP financial measures, including EBITDA, Adjusted EBITDA, Adjusted EBITDA Margin, Adjusted Gross Profit, Adjusted Gross Profit Margin, Adjusted Cost of Goods Sold and Adjusted General and Administrative Expense. In this
Investor Presentation, “EBITDA” means net income (loss) before interest expense, income taxes and depreciation and amortizati on and “Adjusted EBITDA” means EBITDA excluding loss on disposal, legal fees and deal fees associated with the Business Combination, and
related party royalties. EBITDA and Adjusted EBITDA do not represent, and should not be considered as, an alternative to net income or cash flows from operations, each as determined in accordance with GAAP. Adjusted EBITDA Margin means Adjusted EBITDA divided by
revenue. Adjusted Gross Profit means Gross profit (as calculated in accordance with GAAP) plus related party royalties. Adjusted Gross Profit Margin means Adjusted Gross Profit divided by revenue. Adjusted Cost of Goods Sold means Cost of Goods Sold (as calculated in
accordance with GAAP) less related party royalties. Adjusted General and Administrative Expense means General and Administrative Expense (as calculated in accordance with GAAP) less legal fees and transaction fees associated with the Business Combination. We have
presented these non-GAAP measures in this Investor Presentation because we consider them key measures, because Purple believes that these measures are frequently used by analysts, investors and other interested parties in the evaluation of companies. Other
companies may calculate these non-GAAP measures differently than Purple does. These non-GAAP measures have limitations as analytical tools, and you should not consider them in isolation or as a substitute for analysis of Purple’s results as reported under GAAP.

A reconciliation of these non-GAAP measures can be found in this presentation, which is an exhibit to GPAC’s Form 8-K filed with the SEC and can be found on the SEC’s website at www.sec.gov and was also posted on the GPAC website at www.globalpartnerac.com and
the Purple website at www.purple.com.

Additional Information about the Transaction and Where to Find It
In connection with the proposed business combination, GPAC will file preliminary and definitive proxy statements with the SEC and will mail a definitive proxy statement and other relevant documents to its stockholders. Investors and security holders of GPAC are advised to
read, when available, the preliminary proxy statement, and amendments thereto, and the definitive proxy statement in connecti on with GPAC’s solicitation of proxies for its stockholders’ meeting to be held to approve the proposed business combination because the proxy
statements will contain important information about the proposed business combination and the parties to it. The definitive proxy statement will be mailed to stockholders of GPAC as of a record date to be established for voting on the proposed business combination.
Stockholders will also be able to obtain copies of the proxy statement, without charge, once available, at the SEC’s website at www.sec.gov or by directing a request to: Global Partner Acquisition Corp., c/o Andrew Cook, 1 Rockefeller Plaza, 11th Floor New York, New York
10020, e-mail: info@globalpartnerac.com.

Participants in the Solicitation
GPAC, Purple, and their respective directors, executive officers and other members of their management and employees, under SEC rules, may be deemed to be participants in the solicitation of proxies of GPAC stockholders in connection with the proposed business
combination. Investors and security holders may obtain more detailed information regarding the names, affiliations and interests in GPAC’s directors and in its Annual Report on Form 10-K for the fiscal year ended December 31, 2016, which was filed with the SEC on March
14, 2017. Information regarding the persons who may, under SEC rules, be deemed participants in the solicitation of proxies to the GPAC’s stockholders in connection with the proposed business combination will be set forth in the proxy statement for the proposed business
combination when available. Information concerning the interests of GPAC’s and Purple’s participants in the solicitation, whi ch may, in some cases, be different than those of GPAC’s and Purple’s equity holders generally, will be set forth in the proxy statement relating to the
proposed business combination when it becomes available.

Disclaimer
This Investor Presentation shall neither constitute an offer to sell or the solicitation of an offer to buy any securities, nor shall there be any sale of securities in any jurisdiction in which the offer, solicitation or sale would be unlawful prior to the registration or qualification under
the securities laws of any such jurisdiction.

                                                                                                                                                                                                                                                                                                        40
You can also read