Desktop Metal Investor Presentation - Confidential
←
→
Page content transcription
If your browser does not render page correctly, please read the page content below
Desktop Metal
Investor Presentation
                        August   2020
                          Confidential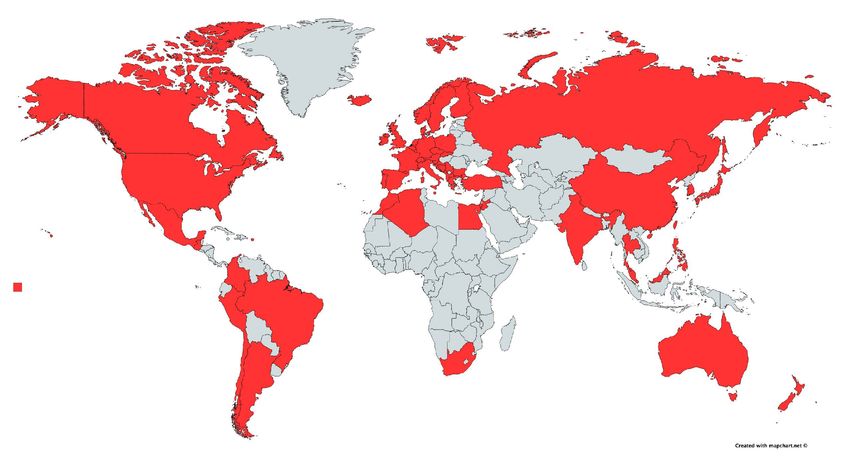
Disclaimer
This presentation (this “Presentation”) is provided for informational purposes only and has been prepared to assist interested parties in making their own evaluation with respect to a potential business combination between Desktop Metal, Inc. (“Desktop
Metal”) and Trine Acquisition Corp. (“Trine”) and related transactions (the “Proposed Business Combination”) and for no other purpose.

No representations or warranties, express or implied are given in, or respect of, this Presentation. To the fullest extent permitted by law, in no circumstances will Desktop Metal, Trine, or any of their respective subsidiaries, stockholders, affiliates,
representatives, partners, directors, officers, employees, advisers or agents be responsible or liable for any direct, indirect or consequential loss or loss of profit arising from use of this Presentation, its contents, its omissions, reliance on the information
contained within it, or on opinions communicated in relation thereto or otherwise arising in connection therewith. This Presentation does not purport to be all-inclusive or to contain all of the information that may be required to make a full analysis of
Desktop Metal or the Proposed Business Combination. Viewers of this Presentation should each make their own evaluation of Desktop Metal and of the relevance and adequacy of the information and should make such other investigations as they deem
necessary.

Forward-Looking Statements
This document contains certain forward-looking statements within the meaning of the federal securities laws with respect to the Proposed Business Combination, including statements regarding the benefits of the Proposed Business Combination, the
anticipated timing of the Proposed Business Combination, the services offered by Desktop Metal and the markets in which it operates, and Desktop Metal’s projected future results. These forward-looking statements generally are identified by the words
“believe,” “project,” “expect,” “anticipate,” “estimate,” “intend,” “strategy,” “future,” “opportunity,” “plan,” “may,” “should,” “will,” “would,” “will be,” “will continue,” “will likely result,” and similar expressions. Forward-looking statements are
predictions, projections and other statements about future events that are based on current expectations and assumptions and, as a result, are subject to risks and uncertainties. Many factors could cause actual future events to differ materially from the
forward-looking statements in this document, including but not limited to: (i) the risk that the Proposed Business Combination may not be completed in a timely manner or at all, which may adversely affect the price of Trine’s securities, (ii) the risk that the
Proposed Business Combination may not be completed by Trine’s business combination deadline and the potential failure to obtain an extension of the business combination deadline if sought by Trine, (iii) the failure to satisfy the conditions to the
consummation of the Proposed Business Combination, including the receipt of the requisite approvals of Trine’s and Desktop Metal’s stockholders, the satisfaction of the minimum trust account amount following redemptions by Trine’s public
shareholders and the receipt of certain governmental and regulatory approvals, (iv) the lack of a third party valuation in determining whether or not to pursue the Proposed Business Combination, (v) the occurrence of any event, change or other
circumstance that could give rise to the termination of the agreement and plan of merger, (vi) the effect of the announcement or pendency of the Proposed Business Combination on Desktop Metal’s business relationships, performance, and business
generally, (vii) risks that the Proposed Business Combination disrupts current plans of Desktop Metal and potential difficulties in Desktop Metal employee retention as a result of the Proposed Business Combination, (viii) the outcome of any legal
proceedings that may be instituted against Desktop Metal or against Trine related to the agreement and plan of merger or the Proposed Business Combination, (ix) the ability to maintain the listing of Trine’s securities on the New York Stock Exchange, (x)
the price of Trine’s securities may be volatile due to a variety of factors, including changes in the competitive and highly regulated industries in which Desktop Metal plans to operate, variations in performance across competitors, changes in laws and
regulations affecting Desktop Metal’s business and changes in the combined capital structure, (xi) the ability to implement business plans, forecasts, and other expectations after the completion of the Proposed Business Combination, and identify and
realize additional opportunities, and (xii) the risk of downturns in the highly competitive additive manufacturing industry. The foregoing list of factors is not exhaustive. You should carefully consider the foregoing factors and the other risks and
uncertainties described in the “Risk Factors” section of Trine’s Annual Reports on Form 10-K, Quarterly Reports on Form 10-Q, the Registration Statement (as defined below), the proxy statement/consent solicitation statement/prospectus contained
therein, and the other documents filed by Trine from time to time with the U.S. Securities and Exchange Commission (the “SEC”). These filings identify and address other important risks and uncertainties that could cause actual events and results to differ
materially from those contained in the forward-looking statements. Forward-looking statements speak only as of the date they are made. Readers are cautioned not to put undue reliance on forward-looking statements, and Desktop Metal and Trine
assume no obligation and do not intend to update or revise these forward-looking statements, whether as a result of new information, future events, or otherwise. Neither Desktop Metal nor Trine gives any assurance that either Desktop Metal or Trine,
respectively, will achieve its expectations.

Additional Information and Where to Find It
This document relates to the Proposed Business Combination between Desktop Metal and Trine. Trine intends to file a registration statement on Form S-4 relating to the Proposed Business Combination (the “Registration Statement”), which will include a
proxy statement/prospectus of Trine and a consent solicitation statement of Desktop Metal. The proxy statement/consent solicitation statement/prospectus will be sent to all Trine and Desktop Metal stockholders. Trine will also file other documents
regarding the Proposed Business Combination with the SEC. Before making any voting decision, investors and security holders of Trine and Desktop Metal are urged to read the Registration Statement, the proxy statement/consent solicitation statement/
prospectus contained therein, and all other relevant documents filed or that will be filed with the SEC in connection with the Proposed Business Combination as they become available because they will contain important information about the Proposed
Business Combination.

Investors and security holders will be able to obtain free copies of the proxy statement/consent solicitation statement/prospectus and all other relevant documents filed or that will be filed with the SEC by Trine through the website maintained by the SEC
at www.sec.gov. In addition, the documents filed by Trine may be obtained free of charge from Trine’s website at www.trineacquisitioncorp.com or by written request to Trine at Trine Acquisition Corp., 405 Lexington Avenue, 48th Floor, New York, NY 10174.

                                                                                                                                                                                                                                                                          2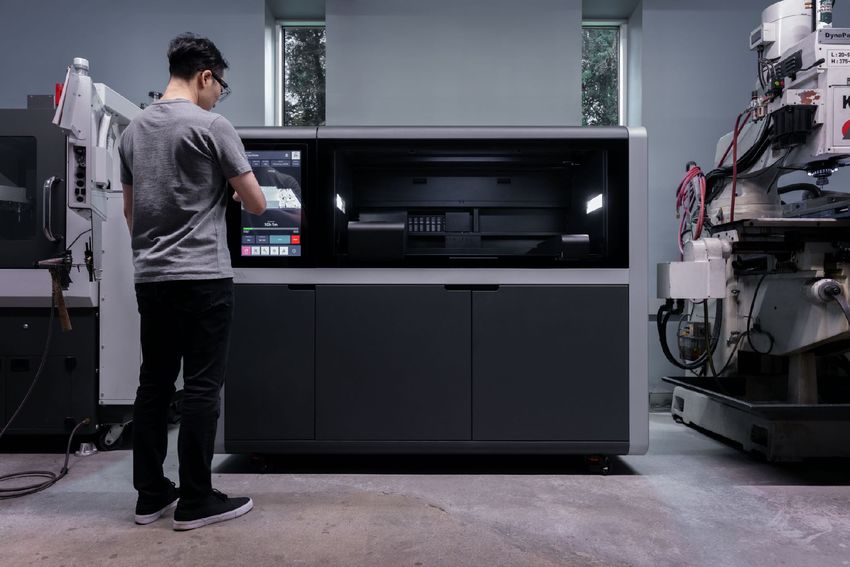
Disclaimer (cont’d)
Participants in Solicitation
Trine and Desktop Metal and their respective directors and officers may be deemed to be participants in the solicitation of proxies from Trine’s stockholders in connection with the Proposed Business Combination. Information about Trine’s directors and
executive officers and their ownership of Trine’s securities is set forth in Trine’s filings with the SEC, including Trine’s Annual Report on Form 10-K for the fiscal year ended December 31, 2019, which was filed with the SEC on March 26, 2020. To the extent
that holdings of Trine’s securities have changed since the amounts printed in Trine’s Annual Report on Form 10-K for the fiscal year ended December 31, 2019, which was filed with the SEC on March 26, 2020, such changes have been or will be reflected
on Statements of Change in Ownership on Form 4 filed with the SEC. Additional information regarding the interests of those persons and other persons who may be deemed participants in the Proposed Business Combination may be obtained by reading
the proxy statement/consent solicitation statement/prospectus regarding the Proposed Business Combination when it becomes available. You may obtain free copies of these documents as described in the preceding paragraph.

Industry and Market Data
This presentation has been prepared by Desktop Metal and Trine and includes market data and other statistical information from sources believed by Desktop Metal and Trine to be reliable, including independent industry publications, governmental
publications or other published independent sources. Some data is also based on the good faith estimates of Desktop Metal or Trine, which in each case are derived from its review of internal sources as well as the independent sources described above.
Although Desktop Metal and Trine believe these sources are reliable, Desktop Metal and Trine have not independently verified the information and cannot guarantee its accuracy and completeness.

Financial Information; Non-GAAP Financial Measures
The financial information and data contained in this Presentation is unaudited and does not conform to Regulation S-X. Accordingly, such information and data may not be included in, may be adjusted in or may be presented differently in the Registration
Statement to be filed by Trine with the SEC and the proxy statement/consent solicitation statement/prospectus contained therein. some of the financial information and data contained in this Presentation, such as Adjusted EBITDA and free cash flow, has
not been prepared in accordance with United States generally accepted accounting principles (“GAAP”). Desktop and Trine believe these non-GAAP measures of financial results provide useful information to management and investors regarding certain
financial and business trends relating to Desktop Metal’s financial condition and results of operations. Desktop Metal’s management uses these non-GAAP measure for trend analyses and for budgeting and planning purposes.

Desktop Metal and Trine believe that the use of these non-GAAP financial measures provides an additional tool for investors to use in comparing Desktop Metal’s financial condition and results of operations with other similar companies, many of which
present similar non-GAAP financial measures to investors. Management does not consider these non-GAAP measures in isolation or as an alternative to financial measures determined in accordance with GAAP. The principal limitation of these non-GAAP
financial measures is that they exclude significant expenses and income that are required by GAAP to be recorded in Desktop Metal’s financial statements. In addition, they are subject to inherent limitations as they reflect the exercise of judgments by
management about which expenses and income are excluded and included in determining these non-GAAP financial measures. In order to compensate for these limitations, management presents non-GAAP financial measures in connection with GAAP
results. You should review Desktop Metal’s audited financial statements, which will be included in the Registration Statement.

No Offer or Solicitation
This Presentation shall not constitute an offer to sell or the solicitation of an offer to buy any securities, nor shall there be any sale of securities in any jurisdiction in which such offer, solicitation or sale would be unlawful prior to registration or qualification
under the securities laws of any such jurisdiction. No offering of securities shall be made except by means of a prospectus meeting the requirements of the U.S. Securities Act of 1933, as amended.

Use of Projections
This Presentation contains projected financial information with respect to Desktop Metal and Trine. Such projected financial information constitutes forward-looking information, and is for illustrative purposes only and should not be relied upon as
necessarily being indicative of future results. The assumptions and estimates underlying such financial forecast information are inherently uncertain and are subject to a wide variety of significant business, economic, competitive and other risks and
uncertainties. See “Forward-Looking Statements” above. Actual results may differ materially from the results contemplated by the financial forecast information contained in this Presentation, and the inclusion of such information in this Presentation
should not be regarded as a representation by any person that the results reflected in such forecasts are achieved.

Trademarks
This Presentation contains trademarks, service marks, trade names and copyrights of Trine, Desktop and other companies, which are the property of their respective owners.

                                                                                                                                                                                                                                                                             3
Transaction summary
Desktop Metal team                                                                    Transaction highlights

           Ric Fulop                                                                   Transaction              • Trine Acquisition Corp (NYSE:TRNE) is a publicly listed special purpose
           Co-founder, Chairman & CEO                                                  structure                  acquisition company with $300M in cash

                                                                                                                • $275M PIPE commitments before transaction announcement
           Elizabeth Linardos
           CFO                                                                                                  • $1.8B enterprise value with a strong balance sheet
                                                                                       Valuation
                                                                                                                • Implied 1.9x 2025E revenue of $942M offers an attractive valuation
           Arjun Aggarwal                                                                                         relative to peer average
           VP Product & Business Development
                                                                                       Capital                  •     Pre-transaction, Desktop Metal is already fully-funded to achieve a
Trine Acquisition Corp team                                                            structure                      positive self-sustaining cash flow profile

                                                                                                                •     Post-transaction, ~$625M on balance sheet(1) enables significant
           Leo Hindery, Jr.
                                                                                                                      optionality to enhance growth, profitability and diversification
           Chairman & CEO
                                                                                       Ownership                •     74% existing shareholders; 14% SPAC and founder shares; 11% PIPE
           Tom Wasserman                                                                                              investors(1)(2)
           Director
                                                                                     Trine has identified Desktop Metal as a unique and compelling opportunity to invest in the
                                                                                     only publicly-traded, pure-play Additive Manufacturing 2.0 company primed to be the industry
           Pierre Henry                                                              leader due to a proprietary and defensible technology platform that is significantly faster, more
           CFO & EVP of Development                                                  cost effective, higher quality and more environmentally sustainable than its competitors.

                   1.   Assumes no redemptions by Trine Acquisition Corp’s existing shareholders and transaction expenses of approximately $49M. See slide 33 “Detailed transaction overview” for key assumptions and additional details.
                   2.   Percentages may not total 100 due to rounding.                                                                                                                                                                      4
Trine overview

Who we are and what we offer                                                             Winning partnership

A Strategic Partnership             Track Record of          Extensive History of                   •   Long history of public company leadership
with global investment              Building Businesses &    M&A Success and                            and value creation with an extensive
                                                                                                        network of contacts, including operators
firm HPS Investment                 Mentorship from Leo      Industry Consolidation
                                                                                         Leo            and wall street professionals
Partners ($63B of                   Hindery, Jr. and HPS     using a proven
                                                                                         Hindery,   •   Led TCI to a nearly 400% increase in market
AUM)(1)                             Governing Partner and    playbook of operating
                                                                                         Jr.            value, culminating in the $52 billion ($66
                                    CEO, Scott Kapnick       methodologies                              per share) sale of TCI to AT&T, which was
                                                                                                        announced in June 1998 and closed in
                                                                                                        March 1999

                                                                                                    •   Leading global private investment firm with
                                                                                                        ~$63B of capital under management as of
                                                                                                        August 2020
Access to a Proprietary             Extensive Public         $300M Equity Capital
Network of potential                Company Experience at    Raised in March 2019                   •   Founded in 2007 and headquartered in New
                                                                                         HPS            York with 10 additional offices worldwide
customers and                       leading institutions     via a listing on the NYSE
financing sources                   including TCI, Liberty                                          •   Led by Scott Kapnick (Governing Partner
                                                                                                        and CEO), former Partner and Co-Head of
through HPS                         Media and AT&T                                                      Global Investment Banking at Goldman
Investment Partners                                                                                     Sachs

                   1.   As of August 1, 2020.                                                                                                         5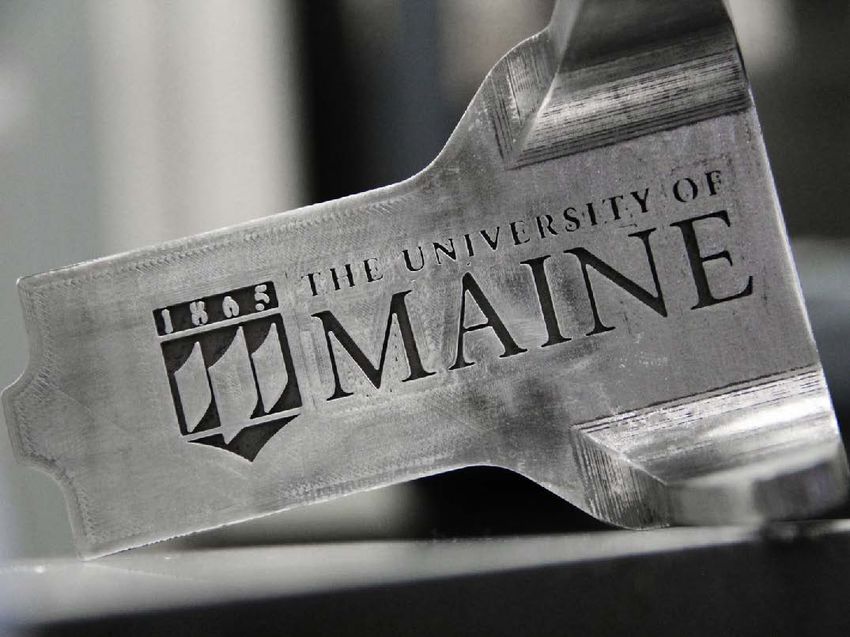
Our opportunity is to build the first

$10+ Billion
Additive 2.0 company
 Superior Management    Barriers to Entry   Top Line Growth   Inorganic upside

                                                                                 6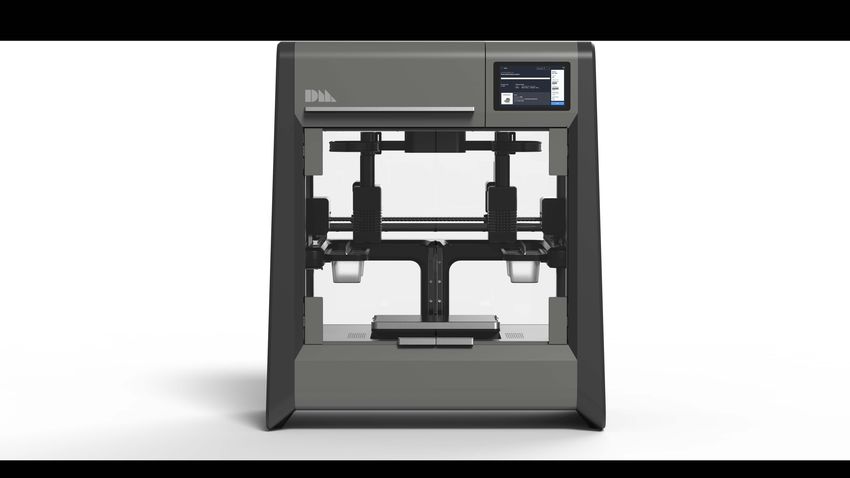
Desktop Metal is the only pure-play Additive 2.0 public opportunity
       Large & expanding                                 • Additive market estimated to grow 11x to $146B(1) this decade
[01]   addressable market
                                                         • Propelled by a shift from prototyping to mass production
                                                         • Strong secular tailwinds around re-shoring manufacturing and supply chain flexibility

                                                         • Team with public market, investing and M&A experience across 60+ transactions
       World-class
[02]   management team
                                                         • Deep scientific pedigree — founding team includes 4 MIT professors
                                                         • Board of directors with a track record of investing in and advising category disrupters

                                                         • Fastest 3D printing platform, up to 100x the speed of legacy technology(2)
       Industry-leading, defensible
[03]   technology platform
                                                         • Advanced sintering & software capabilities combined with differentiated materials platform
                                                         • Broad technology portfolio with over 120 patents issued or pending

                                                         • Prolific distribution in 60+ countries around the world
       Global distribution
[04]   & broad customer adoption
                                                         • Demonstrated customer demand across a diverse array of industries with no account concentration
                                                         • Production System™ reservations provide critical technology validation & revenue visibility through early 2024(3)

                                                         • High-margin recurring revenue streams including consumables and services
       Compelling unit economics
[05]   & attractive financial profile
                                                         • Gross margin improvements and operating leverage drive profitability
                                                         • Organic growth funded with pre-transaction balance sheet cash

                                                         • Opportunity to accelerate growth trajectory with transaction proceeds via industry consolidation
       Inorganic upside potential
[06]   through consolidation
                                                         • $2B of estimated inorganic revenue identified across 60+ potential targets
                                                         • ~$625M on pro forma balance sheet(4) enables optionality to enhance growth, profitability and diversification

                  1.   Source: Wohlers Report 2020 (2020 - 2029 forecast); 2030 figure based on management calculations.
                  2.   Based on published speeds of binder jetting and laser powder bed fusion systems comparable to the Production System™ available as of August 25, 2020 and using comparable materials and processing parameters.
                  3.   Assumes 100% conversion of existing reservations to orders.                                                                                                                                                         7
                  4.   Assumes no redemptions by Trine Acquisition Corp’s existing shareholders and transaction expenses of approximately $49M. See slide 33 “Detailed transaction overview” for key assumptions and additional details.
[01]
Additive manufacturing industry to grow 11x over next decade
Propelled by shift from prototyping to mass production of end use parts
$146B
Evolution of the AM market Additive manufacturing market size(1) 25% CAGR
Additive 1.0 $150B
• Key players now off-patent, leaving them with
Company adoption of additive
minimal differentiation and commoditized
manufacturing for end-use parts(2)
$120B
technology
5% 18% 46%
• Significant loss in market share to open 2016 2019 2022E
source and low cost providers $90B
• Have not participated in market growth due to
focus on design and rapid prototyping
$60B
Additive 2.0
• Additive 2.0 innovation is being driven by VC-
20% CAGR
funded, emerging players across printers, $30B
materials and parts businesses 9% CAGR(3)
$12B
• New players are driving advances in speed, $0.6B $1B
accuracy, material variety and build volume $0B
00
02
04
06
08
10
12
14
16
18
20
22
24
26
28
30
• Focus on mass production and end-use parts
20
20
20
20
20
20
20
20
20
20
20
20
20
20
20
20
is driving market growth
Source: Wohlers Report 2020
Research Additive 1.0 Additive 2.0
1. Source: Wohlers Report 2020 (2000 actuals - 2029 forecast); 2030 figure based on management calculations.
2. Source: “3D printing: hype or game changer?” Ernst & Young Global Report 2019. 8
3. Compound annual growth rate.
[01]

   The market is split into three primary segments:
   printers, parts and materials
   Breakdown of 2019 global additive manufacturing market(1)                                                                         Breakdown of global additive manufacturing vendors(2)
        Other
        $0.1B                                Other 1%                                                                                           Other
                                             $0.1B                                                                                               12%
     Materials
         16%
                      $1.9B
                                                                                                                                                                                                                                          Parts
                                                                                                                                                                                                                                          34%
                                                                                                                                         Materials
                                                                                                   Parts                                     16%
                                                  $12B                             $4.9B           42%                                                                                  1,300+
                                                   2019                                                                                                                                   global
                                                  market                                                                                                                                 Vendors

                                 $4.9B
     Printers &
  OEM services
       Printers
           41%
                                                                                                                                            Printers
   Source: Wohlers Report 2020                                                                                                                 38%

                                  1.   Source: Wohlers Report 2020; management calculations. Printers segment includes revenue from maintenance contracts, OEM parts, OEM services, and related aftermarket products and software. Parts segment only
                                       includes revenue from independent parts providers.                                                                                                                                                               9
                                  2.   Source: “3D printing: hype or game changer?” Ernst & Young Global Report 2019. Other segment includes software and 3D scanner vendors.
[01]

   Additive enables the future…

                                                        Electric &        Space           Robotics &
                                                        Autonomous        Exploration &   Industrial
                                                        Vehicles          Services        Automation

       Additive
       Manufacturing
       facilitates more than a new approach to
       industrial production — it is a key enabler of
       the fourth industrial revolution that
       underpins revolutionary technologies driving
       global economic growth.

                                                        Next-generation   Personal &      Green Energy
                                                        Defense           Commercial      & Utilities
                                                        Capabilities      Aviation

                                                                                                         10
[01]
…and is transformational to the manufacturing industry
Conventional manufacturing hurdles Additive manufacturing benefits at-scale
Product innovation Complex & generative designs Mass customization
• Geometry: machines & tooling encouraging
simpler designs with reduced performance
• Lack of customization: tooling prevents
producing products tailor to niche and local
markets
Process innovation
• Time-to-market: lead-times associated with
tooling slow down new product introductions
• Volumes: tooling is a fixed expense that must Assembly consolidation Supply chain re-engineering(1)
be amortized across large quantities of parts
• Inventory: tooling leads to minimum quantity Russia
Canada Germany 27%
builds, typically resulting in excess inventory 19% UK 24%
USA 25% China(2) Japan
• Cost: machining is a time- and labor- 8% 21%+ 13%
Mexico India
intensive process that is costly at-scale 23% 36%
Brazil
• Scrap: machining and casting have high 28% Australia
12%
levels of scrap, waste and pollution
[a] 95% [b]
weight Value-added tax (VAT) plus average country tariff
100 part antenna reduction 1 part antenna
1. Source: VAT from Tax Foundation website (https://taxfoundation.org/2020-sales-taxes/) and PwC website (https://taxsummaries.pwc.com/quick-charts/value-added-tax-vat-rates) as of August 5, 2020; country tariff from
World Trade Organization; management calculations. 11
2. Does not include the full effect of additional tariffs placed on US exports to China starting in 2018.[02]
Our management team has industry Ric Fulop
Co-founder, Chairman & CEO
expertise & proven success
Steve Billow Arjun Aggarwal Jonah Myerberg
President VP Product & Bus. Dev. Co-founder & CTO
Elizabeth Linardos Paul Maloney Ely Sachs
CFO VP Global Sales Co-founder, MIT Prof. Mech Eng
Mike Rubino Michael Hackney Chris Schuh
EVP Corp. Dev. VP Software Co-founder, Chair MIT DMSE
Meg Broderick Tom Nogueira John Hart
VP & General Counsel VP Operations Co-founder, MIT Prof. Mech Eng
Ilya Mirman Maor Ben David Yet Ming Chiang
CMO VP Customer Support Co-founder, MIT Prof. DMSE
12[02]
Board of directors with a history of creating category disruptors
Ric Fulop Leo Hindery, Jr.
Chairman & CEO, Chairman & CEO,
Desktop Metal Trine Acquisition Corp.
Wen Hsieh Gary Johnson
General Partner, Chief Manufacturing Officer,
Kleiner Perkins Ford
Andy Wheeler Jeff Immelt
General Partner, Venture Partner, NEA
Google Ventures Frmr. CEO, GE
Bilal Zuberi Byron Knight
General Partner, Managing Director,
Lux Capital Koch Disruptive Technologies
Dayna Grayson Steve Papa
Founder & CEO, Parallel Wireless
General Partner,
Chairman, Toast
Construct Capital
Founder & CEO, Endeca (acq. ORCL)
1. Represents Desktop Metal’s current Board of Directors; Leo Hindery, Jr. to join Board of Directors upon completion of the transaction. 13[03]
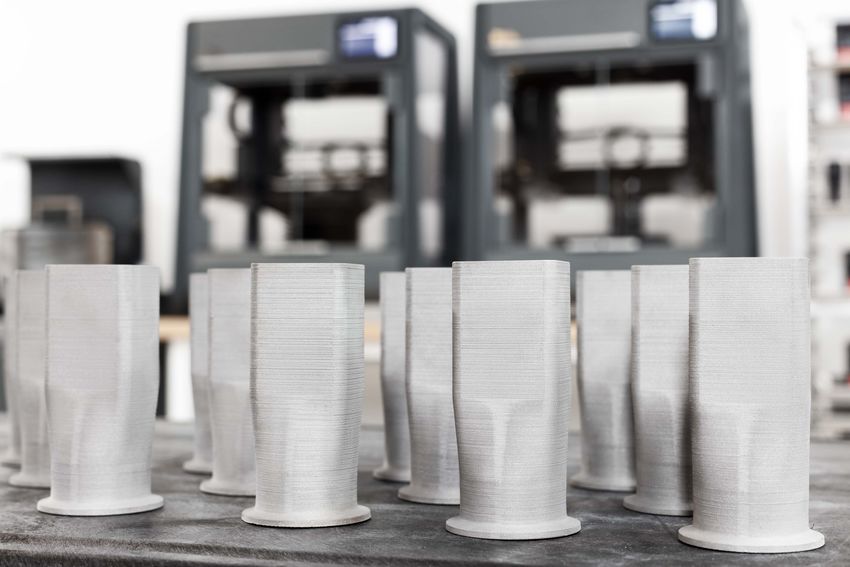
Desktop Metal’s pioneering product portfolio
Addresses key pain points in productivity & ease of use across product lifecycle
Fiber™ Studio System™ Shop System™ Production System™
[Composite] [Metal] [Metal] [Metal]
Print continuous fiber-reinforced parts Office-friendly production of prototypes Serial, mid-volume production of dense, High-speed, mass production of metal
with aerospace-grade AFP tape and low volume, end-use parts customer-ready metal parts parts, designed for the factory floor
Scheduled to ship in volume 2H 2021
Scheduled to ship in volume Q4 2020 Shipping in volume since Q4 2018 Scheduled to ship in volume Q4 2020
*At select customers today
Ease of use with automated workflows and turnkey solutions
Volume production with attractive part economics
Differentiated technology building blocks across hardware, software and materials (120+ patents issued or pending)
14[03]
Hardware designed for massive throughput & ease of use
Fastest metal 3D printing technology(1)(2) Advanced sintering technology(5)
Powder bed fusion Single Pass Jetting™
• Desktop Metal™ Single Pass Jetting™ • Offers industrial-strength sintering in an
(SPJ™) is up to 100x faster than laser office friendly package, sized to fit
powder bed fusion and significantly through an office door — minimal to no
faster than conventional binder jetting(1) facilities investment required
• Organizations can print up to millions of • Automated sintering cycles based on
parts per year at lower costs than many material selection — no user
traditional manufacturing methods and programming required
fractions of the part costs achievable via
laser powder bed fusion(3) • Over-the-air (OTA) firmware updates for
new features & enhancements
• Engineered for robust, reliable high-
SPJ™ Printing: Speeds up to
speed printing to optimize print-to-print • Designed to achieve peak temperatures
of 1400 °C under vacuum with high
consistency and part quality
100x faster(4) thermal uniformity — enabling high
densities with low gas consumption
Desktop Metal sintering technology makes powder metallurgy-based 3D printing processes
broadly accessible to the market, enabling wide metal 3D printing adoption
1. Based on published speeds of binder jetting and laser powder bed fusion systems comparable to the Production System™ available as of August 25, 2020 and using comparable materials and processing parameters.
2. Selected issued or pending patents related to SPJ™ & binder jet technology: 16/327,915; PCT/US2019/056508; 10,486,363; 2020/0009788; PCT/US19/051151; 16/328,272; 10,406,751; 2019/0375009; 2019/0388966;
2019/0210294; 16/328,350; 2019/0193150; 2020/0038958; 2018/0304301; 2018/0304302; 2018/0297278; 16/328,272; 10,486,363; 16/328,012; PCT/US19/051151; 16/328,012; 10,406,751; 10,500,789; 2019/0375009;
2019/0210294; 16/328,350.
3. Management estimates.
4. Based on published speeds of single-laser, mid-range laser powder bed fusion systems as of August 25, 2020. 15
5. Selected issued or pending patents related to sintering technology: 10,191,456; 2019/0187639; 2019/0160529; D881,823; 10,578,361.[03]
Desktop Metal technology vs. conventional manufacturing
Illustrative breakeven analysis vs. tool-based manufacturing Inkjet technology Moore’s law(1)
Printhead drops per second(2)
Casting
Additive 1.0 technologies are
typically throughput-limited, 1E+10
Inkjet performance (printhead drops per
breaking even with conventional
manufacturing at ~100’s of units second) has roughly doubled every
Machining 1E+09 18-24 months for the past 20 years MEMS
Single Pass
Cost per part
1E+08
Additive 1.0
Additive 2.0 leverages advances in 1E+07
inkjet technology to drive throughput
improvements, bringing breakeven
quantities to ~100,000’s of units 1E+06
Desktop Metal (today) 1E+05
Desktop Metal (2030) 1E+04
Glass chip
1E+03
1 10 100 1K 10K 100K 1M 1980 1990 2000 2010 2020
Quantity of parts
Desktop Metal’s Single Pass Jetting™ print engine is designed to be the world’s fastest and most advanced print engine implemented in additive manufacturing.
1. Source: Wijshoff, Herman, (2008), Structure and fluid-dynamics in piezo inkjet printheads, Integrated Assessment; management estimates.
2. Printhead drops per second calculated as number of nozzles multiplied by maximum drop frequency. 16[03]
High-performance and flexible material platforms
Office-friendly & extensible metal 3D printing platforms Breakthrough aerospace-grade composite solutions
• Fiber™ introduces micro AFP™ technology adapted from multi-
million dollar AFP machines to bring breakthrough aerospace-
grade materials to the 3D printing market(2)
• Compatible with a range of industry-qualified composite
thermoplastics with continuous carbon fiber and fiberglass
reinforcement options
• Up to 75x stiffer & 60x stronger than FFF materials (e.g. ABS)
Thousands of possible materials Office-friendly printing via Studio System™
• Materials are stronger than steel, lighter than aluminum and
• Our metal 3D printing systems are built • Proprietary Bound Metal Deposition™ capable of withstanding temperatures up to 250 ºC(3)
on the foundation of scalable powder technology on the Studio System™
metallurgy processes eliminates the use of lasers and loose
160
metal powders(1) Traditional FFF materials + chopped fiber
• Printer processing parameters for Fiber™ PEEK/PEKK + Continuous CF
Tensile Modulus (GPa)
thousands of metal alloys and ceramic • This enables office-friendly metal 120
materials can be developed with powder processing and easy material
metallurgy processes changeovers as well as minimizes
80
requirements for special facilities or
• Production System™ offers an open
expensive EHS equipment as compared
platform for customers to procure
to legacy technologies 40
material directly from third party
suppliers of their choice, allowing for • Bound metal rods facilitate high-force
0
minimal supply chain disruption and printing and highly loaded media inputs
optimal pricing — up to 63% metal by volume — for 0 500 1000 1500 2000 2500
high-quality sintered metal parts
Tensile Strength (MPa)
1. Selected issued or pending patents related to BMD™ technology: 10,464,260; 10,384,396; 10,272,492; 10,456,833; 2020/0047417; 10,421,124; PCT/US19/60499; 2019/0210106; 10,654,102; PCT/US19/38096; PCT/
US2019/039516; 2019/0375014; 2020/0009795; 9833839; 2018/0297289; 10,232,443; 16/328,705; 2018/0311899; 10,189,204; 2020/0101534; 2018/0297288; 2018/0297113; 2018/0297272; 2017/0252851.
2. Selected issued or pending patents relating to Micro AFP™ technology: PCT/US19/58226; PCT/US19/41255; 10,449,731; 2020/0130257. 17
3. Strength and weight based on performance of continuous carbon fiber-reinforced Nylon (PA6), PEEK, and PEKK composites; temperature resistances based on performance of PEEK and PEKK composites.[03]
Software-enabled additive manufacturing
Fabricate software
From your computer or phone… …to Desktop Metal products
• Cloud-enabled, browser-based • Onboard touchscreen controls
build preparation & workflow tools with consistent user experience
automate the end-to-end additive
• Remote over-the-air (OTA)
manufacturing process(1)
updates delivered directly to on-
• Cohesive, modern user interface & device software for new features
experience across products and enhancements
Sintering process simulation(2)
• Proprietary technology designed to improve part
accuracy, reduce costs, and eliminate trial and error
for powder metallurgy-based additive manufacturing
• Dynamically simulates the results of the sintering
process by leveraging a GPU-accelerated, multi-
physics engine & artificial intelligence
• Automates the compensation of geometries for
distortion and shrinkage during sintering
1. Cloud-enabled software available on select Desktop Metal products.
2. Selected issued or pending patents related to simulation & artificial intelligence: 2019/0138673; 2019/0329322; 10,598,467; 2018/0304540; 2019/0329501; 2018/0307209. 18[03]
Desktop Metal delivers green manufacturing solutions at-scale
TRADITIONAL MANUFACTURING TRADITIONAL MANUFACTURING ADDITIVE MANUFACTURING
Casting Machining Binder jetting & Single Pass Jetting™
• Near zero waste
Waste • Mold destroyed with each part • Vast majority of metal turns
Production
• Vast majority of metal turned into parts
• Significant pollution from effluents into waste (from billet)
• Powder is highly re-usable
• Significant geometric freedom
Parts • Limited geometries • Limited geometries • Lightweighting
• Assembly & part consolidation
• Environmental regulations driving shift to • Enables on-demand, distributed
Supply Chain emerging markets • Difficult / expensive to scale to large manufacturing
Dynamics • Result in tariffs, lead times, volumes • Digital inventory reduces physical
transportation pollution facilities requirements
Energy
Consumption • Very high • High • Very low
19[04]
Leading global distribution network
Coverage across 60+ countries around the world Additional commentary
• Distribution partners with years
of experience in digital
modeling, additive
manufacturing, and metal
manufacturing
• Built to support sales of both (i)
low touch, high volume and (ii)
high touch, high value product
offerings, facilitating a land-and-
expand sales strategy to
accelerate market penetration
• Provide marketing, sales, and
support services to Desktop
Metal end users
20[04]
Broad horizontal adoption across industries
Transportation Consumer goods & healthcare Energy, mining & heavy industry
Design, development, and Improved designs, accelerated time- Manufacture of industrial equipment
manufacture of air, land and sea to-market or mass customized and high performance parts.
transportation components products for personal or medical use.
Advanced research Machinery & machine design Manufacturing tooling
Exploration and adoption of additive Design and manufacture of Low-volume and serial production of
through advanced research and mechanical systems and machinery manufacturing aids, jigs, fixtures and
training in conjunction with industry sub-assemblies and components. tooling.
partners.
21[04]
Automotive is a key vertical for volume additive manufacturing
Desktop Metal position anchored by strategic investments from Ford and BMW
Selected automotive OEM customers
• Automotive is a major market for powder
metallurgy (PM) parts today
• PM parts via conventional binder jetting and
Single Pass Jetting™ enable assembly
Investors
consolidation, lightweighting, increased cost
efficiencies and advanced materials
• Desktop Metal has received strategic
investments from Ford and BMW with a goal
of accelerating the penetration of additive
manufacturing in automotive
• Desktop Metal is well positioned to capture
an outsized share of this segment relative to
competitors
22[04]
Blue chip customer base
Successful customers are driving expansion
2018
Mar-18: 1st Intro
Mar-19: 1st system sold
May-19: Intro to 2nd business unit
Jul-19: 2nd system sold
Aug-19: Intro 3rd and 4th business unit
Dec-19: 3rd system sold
Mar-20: 4th system sold
2020
23[05]
High-margin product platforms with recurring revenue streams
Shop System™ illustrative 10-year lifetime unit economics
Revenue & Gross Profit ($000s) Cumulative Gross Margin (%)
$350 60%
Year 1: $290K upfront sale + $33K consumables(1)
$280 54%
$210 48%
10-Year Lifetime Total
$1.1M Revenue
$140 $600K Gross profit 42%
Recurring: $80K+ consumables & service @ ~60% GM(2)
$70 36%
$0 30%
Y1 Y2 Y3 Y4 Y5 Y6 Y7 Y8 Y9 Y10
Cumulative Gross Margin Annual Revenue Annual Gross Profit
1. Assumes at-scale $130K Shop System™ Product COGS and indirect COGS as 5% of revenue.
2. Consumables & service annual revenue based on management estimates assuming 20% of 24 x 7 utilization, 20% bed packing density, decaying renewals on service to 50% of initial cohort in year 5 and beyond, and at- 24
scale indirect COGS as 5% of revenue. Includes binder, metal powder (17-4PH stainless steel) and machine service consumables.[05]
High-margin product platforms with recurring revenue streams
Production System™ illustrative 10-year lifetime unit economics
Revenue & Gross Profit ($M) Cumulative Gross Margin (%)
$2.5 60%
Year 1: $2.2M upfront sale + $250K consumables(1)
$2.0 52%
$1.5 10-Year Lifetime Total 44%
$6.5M Revenue
$1.0 $3.8M Gross profit 36%
Recurring: $450K+ consumables & service @ 70%+ GM(2)
$0.5 28%
$0.0 20%
Y1 Y2 Y3 Y4 Y5 Y6 Y7 Y8 Y9 Y10
Cumulative Gross Margin Annual Revenue Annual Gross Profit
1. Assumes at-scale $1.4M Production System™ Product COGS and indirect COGS as 5% of revenue.
2. Consumables & service annual revenue based on management estimates assuming 80% of 24 x 7 utilization, 20% bed packing density, decaying renewals on service to 25% of initial cohort in year 2 and 0% beyond, and 25
at-scale indirect COGS as 5% of revenue. Includes only binder consumables.[05]
Positioned for rapid growth over the next decade
Summary financials(1) ($M) Key growth drivers & commentary
Reflects only 2.0% of $942
$942 • Over 11x industry growth to $146B in 2030(2)
[100% organic
$48B+ 2025E driven by accelerating adoption of additive for
growth case] addressable market(2) mass production
• Expanding Desktop Metal product portfolio — shift
to four products scheduled to ship by end of 2021
7 % $584 • New applications enabled by material
: 8
G R development and introductions
CA
• Growing system install base yields compounding
$329 consumables revenue
$268 • 25% of 2025E revenue from install base —
consumables & services recurring revenue
$166
$134
$78 • 90+ Production System™ reservations provide
$26 $15$24
- $25 $44 shipment visibility through the first half of 2024E(4)
($2) • 30% MoM growth in Studio System™ & ™ pipeline
($25) 2020 YTD (through June 30)
($64)
($96)
• Organic growth case fully funded — opportunity
for upside through consolidation of material
2019A 2020E 2021E 2022E 2023E 2024E 2025E
producers and parts providers
Revenue Adj. EBITDA (3)
1. Presented financial data not inclusive of estimated public company-related costs of approximately $6M per year.
2. Source: Wohlers Report 2020 (2020 - 2029 forecast); 2030 figure based on management calculations.
3. Adj. EBITDA defined as Operating Income (Loss) plus Depreciation and Amortization, adjusted for stock-based compensation. Please reference slide 39 “Reconciliation of non-GAAP financials” for additional information
regarding the non-GAAP measures. 2020E Adj. EBITDA assumes high end of 2020E revenue range ($15M - $25M). 26
4. Assumes 100% conversion of existing reservations to orders.[05]
Operating leverage yields growth in EBITDA & FCF
Driven by Desktop Metal’s core focus on technology & product development
Operating expenses(1) (% of revenue) Adjusted EBITDA & FCF(1)(2)(3) ($M)
350% $300
Our business is asset light with Adj. EBITDA
manufacturing completed through FCF
300% contract manufacturers, enabling us to $225
achieve significant leverage as
revenue scales
250% $150
200%
90% $75
60% $0
30% ($75)
0% ($150)
2019A 2020E 2021E 2022E 2023E 2024E 2025E 2019A 2020E 2021E 2022E 2023E 2024E 2025E
1. Presented financial data not inclusive of estimated public company-related costs of approximately $6M per year.
2. Adj. EBITDA defined as Operating Income (Loss) plus Depreciation and Amortization, adjusted for stock-based compensation. Please reference slide 39 “Reconciliation of non-GAAP financials” for additional information
regarding the non-GAAP measures. 2020E Adj. EBITDA assumes high end of 2020E revenue range ($15M - $25M).
3. FCF defined as Cash Flow from Operations minus Capital Expenditures. Please reference slide 39 “Reconciliation of non-GAAP financials” for additional information regarding the non-GAAP measures. 2020E FCF assumes 27
high end of 2020E revenue range ($15M - $25M).[06]
Significant upside to unit economics through consolidation
Vertical integration of additional profit pools such as metal powder
Additional commentary
10-YR Production System™ lifetime value 10-YR Production System ™ lifetime value
[Binder only] [Binder + metal powder] • 2x - 6x(1) binder only lifetime value
achievable through vertical integration of
2x - 6x(1) powder suppliers
Lifetime value • Low end of the range represents
commodity metals (e.g. stainless steels)
• High end of the range represents
specialty metals & super alloys (e.g.
inconel, copper, titanium)
• 90+ Production System™ reservations to
date total an estimated ~$500M to
several billion dollars of lifetime value
(excluding & including vertical
integration)(2)
$6.5M
$3.8M
Revenue System Recurring Overhead Gross Revenue System Recurring Overhead Gross
COGS COGS Profit COGS COGS Profit
1. Management estimates based on $12.30 17-4PH stainless steel and $60.00 Inconel 625 price per kg at 50%+ product gross margin; additional assumptions as listed on slides 24 and 25 “High-margin product platforms
with recurring revenue streams”. 28
2. Assumes 100% conversion of existing reservations to orders.[06]
Desktop Metal has a compelling M&A pipeline with a
team ready to execute
Other(3)
20%
100’s $12B 2019 Additive Parts
of companies manufacturing market(1) 37%
60+
Materials Opportunities
14% identified
60+ ~$2B revenue
opportunities opportunity identified(2)
Printers
29%
10+ In contact &
under analysis Key leadership has experience across an aggregate of 60+ M&A
opportunities
and investment transactions; ~$625M cash on the pro forma
balance sheet(4) + public equity currency to capitalize on
strategic opportunities
1. Source: Wohlers Report 2020.
2. Represents approximate aggregate LTM revenue of the target companies on a standalone basis as communicated by such target companies or estimated by Desktop Metal management as of August 9, 2020.
3. Includes software and post-processing technologies. 29
4. Assumes no redemptions by Trine Acquisition Corp’s existing shareholders and transaction expenses of approximately $49M.[06]
Potential to consolidate the industry and build a long-term
virtuous cycle 01
06
01 Printers Materials
State-of-art technology 04
Economies of scale with global via on-premises and
Differentiation and
channel and distribution in optimization Depreciated systems at
hardware-as a-service
60+ countries subscription termination
02
05
Vertical integration drives lower 03
05
cost parts and accelerates Drive predictable and
additive adoption consistent volume
03
06
Internal & direct customer feedback
to improve next generation products Material and system
and generate leads at scale 04 optimization
Parts 02
Cost-effective, serial
production across
materials & applications
30Desktop Metal is the only pure-play Additive 2.0 public opportunity
Large & expanding • Additive market estimated to grow 11x to $146B(1) this decade
[01] addressable market
• Propelled by a shift from prototyping to mass production
• Strong secular tailwinds around re-shoring manufacturing and supply chain flexibility
• Team with public market, investing and M&A experience across 60+ transactions
World-class
[02] management team
• Deep scientific pedigree — founding team includes 4 MIT professors
• Board of directors with a track record of investing in and advising category disrupters
• Fastest 3D printing platform, up to 100x the speed of legacy technology(2)
Industry-leading, defensible
[03] technology platform
• Advanced sintering & software capabilities combined with differentiated materials platform
• Broad technology portfolio with over 120 patents issued or pending
• Prolific distribution in 60+ countries around the world
Global distribution
[04] & broad customer adoption
• Demonstrated customer demand across a diverse array of industries with no account concentration
• Production System™ reservations provide critical technology validation & revenue visibility through early 2024(3)
• High-margin recurring revenue streams including consumables and services
Compelling unit economics
[05] & attractive financial profile
• Gross margin improvements and operating leverage drive profitability
• Organic growth funded with pre-transaction balance sheet cash
• Opportunity to accelerate growth trajectory with transaction proceeds via industry consolidation
Inorganic upside potential
[06] through consolidation
• $2B of estimated inorganic revenue identified across 60+ potential targets
• ~$625M on pro forma balance sheet(4) enables optionality to enhance growth, profitability and diversification
1. Source: Wohlers Report 2020 (2020 - 2029 forecast); 2030 figure based on management calculations.
2. Based on published speeds of binder jetting and laser powder bed fusion systems comparable to the Production System™ available as of August 25, 2020 and using comparable materials and processing parameters.
3. Assumes 100% conversion of existing reservations to orders. 31
4. Assumes no redemptions by Trine Acquisition Corp’s existing shareholders and transaction expenses of approximately $49M. See slide 33 “Detailed transaction overview” for key assumptions and additional details.Transaction & valuation overview
Detailed transaction overview
Key transaction terms                                                                                                        Illustrative pro forma valuation ($M)
• $526M cash proceeds inclusive of PIPE proceeds and                                                                          Desktop Metal share price                                                                          $10.00
                                                                                                                                  Pro forma shares outstanding                                                                    246.1
  transaction expenses(1)
                                                                                                                                  Pro forma equity value                                                                         $2,461

• $275M of PIPE commitments before transaction                                                                                   (-) Assumed pro forma net cash(3)                                                                (625)
                                                                                                                              Pro forma enterprise value                                                                         $1,836
  announcement
                                                                                                                              Transaction multiple                                                                Metric
                                                                                                                              EV / 2025E Revenue                                                                    $942           1.9x

Pro forma ownership @ $10.00 per share(2)                                                                                    Illustrative sources and uses ($M, except per share data)

        SPAC shares                                                                                                           Sources                                                             $                          %   Shares
               12%                                                                                                            Existing DM shareholders                                       $1,830                        74%    183.0
      Founder shares                                                                                                          SPAC cash in trust(1)                                             300                        12%     30.0
                 2%                                                                                                           Additional PIPE equity                                            275                        11%     27.5
         PIPE equity                                                                                                          Founder shares(4)                                                  56                         2%      5.6
                11%                                                                                                           Total sources                                                  $2,461                       100%    246.1

                                                                                                                              Uses                                                                $                          %
                                                                                                                              Existing DM shareholders                                       $1,830                        74%
                                                                                                                              Cash to balance sheet                                             526                        21%
                                                                     Seller rollover                                          Founder shares                                                     56                         2%
                                                                      74%                                                     Estimated fees and expenses                                        49                         2%
                                                                                                                              Total uses                                                     $2,461                       100%

                       1.   Assumes no redemptions by Trine Acquisition Corp’s existing shareholders.
                       2.   Percentages may not total 100 due to rounding.
                       3.   Pro forma net cash calculated as Desktop Metal’s net cash balance of $99M as of June 30, 2020 and transaction proceeds of $526M.                                                                        33
                       4.   Assumes 5.6M founder shares at $10.00. Incremental 1.9M additional founder shares subject to $12.50 earnout. Excludes 8.5M founder warrants, which have a strike price of $11.50 per share.
Select peers operational benchmarking
Advanced manufacturing Tech-enabled industrials Legacy AM
87%
30%
25%
71% AM average: 3% TE average: 9% LAM average: (9%)
CY’19A-
CY’21E 16% 16% 15% Overall average(1): 8%
Revenue 12%
CAGR 7%
5%
3%
1%
19-21E 21-25E
(3%)
(7%)
(10%)
94%
CY’21E AM average: 52% TE average: 69% LAM average: 46%
76% 76% 75%
Gross Overall average(1): 65%
margin 61%
53% 54% 53% 51% 49%
43%
35%
N.A.
2024E 2025E
49%
CY’21E AM average: 19% TE average: 31% LAM average: 10%
EBITDA 36% Overall average(1): 29%
32% 30%
margin(2) 28% 29%
23% 25% 25%
18%
13%
9% 11%
2024E 2025E
1. Overall average excludes Legacy AM players.
2. Presented financial data not inclusive of estimated public company-related costs of approximately $6M per year.
3. Source: Desktop Metal projections based on management estimates; peer projections based on company filings and FactSet as of August 25, 2020.
4. Peers are ordered in descending CY’19A — CY’21E revenue CAGR.
34
5. N.A. denotes “not available” due to limited disclosure on broker estimates.Select peers valuation benchmarking
Advanced manufacturing Tech-enabled industrials Legacy AM
EV / CY'21E AM average CY’21E: 7.7x 14.8x TE average CY’21E: 9.4x LAM average CY’21E: 1.1x
Revenue 13.5x
12.9x Overall average CY’21E(2): 9.0x
7.9x
7.4x
6.8x 6.9x
5.7x
5.2x
3.1x (1)
1.9x (1)
0.9x 1.3x
2024E 2025E
EV / CY'21E AM average CY’21E: 44.6x TE average CY’21E: 30.0x LAM average CY’21E: 11.1x
EBITDA(3) Overall average CY’21E(2): 33.3x
59.2x
44.4x
37.6x
35.4x
30.1x 30.0x
21.8x 23.2x
17.8x
(1)
13.7x 12.0x
10.1x
6.8x (1)
2024E 2025E
1. Enterprise value based on 1.9x 2025E revenue.
2. Overall average excludes Legacy AM players.
3. Presented financial data not inclusive of estimated public company-related costs of approximately $6M per year.
4. Source: Desktop Metal projections based on management estimates; peer projections based on company filings and FactSet as of August 25, 2020. 35
5. Peers are ordered in descending CY`19A — CY`21E revenue CAGR.Transaction priced at a discount to peer multiples
Implied EV based on comparable
Commentary companies current trading valuations Transaction valuation
Discounted value of
• Based on the organic growth plan Comparable companies comparable companies(2) Post-money valuation
• Pro forma for transaction, Company will
$9,415
have ~$625M on the balance sheet(1)
• Significant opportunity to deploy for
strategic & accretive acquisitions
$5,649
• Vertical integration through materials & $3,960
parts, enabling larger-scale, higher
$1,836
growth & margin enhancement $2,376
Implied future enterprise value Implied discounted enterprise value Post-money enterprise value
EV / Revenue Metric (Discount rate: 20%)
CY 2024E $584M 9.7x – 16.1x 2024E Revenue 9.7x – 16.1x 2024E Revenue 3.1x 2024E Revenue
CY 2025E $942M 6.0x – 10.0x 2025E Revenue 6.0x – 10.0x 2025E Revenue 1.9x 2025E Revenue
• Applies a range of 6.0x – 10.0x multiples to Desktop Metal 2025E revenue to arrive at an implied future enterprise value. The future enterprise value is
discounted 4.75(2) years back to September 30, 2020 to arrive at an implied discounted enterprise value
Summary of
approach • The applied range of multiples is centered around the mean of Desktop Metal’s peer group (9.0x), with sensitivity built on both high and low ends
• 2025E projected financials-based valuation is the appropriate approach given the significant revenue growth of Desktop Metal over the next few years
1. Assumes no redemptions by Trine Acquisition Corp’s existing shareholders and transaction expenses of approximately $49M.
2. Discounted as of September 30, 2020 using mid-year discount convention. 36
3. Source: Desktop Metal projections based on management estimates; peer projections based on company filings and FactSet as of August 25, 2020.Appendix
37Summary financials
($M)(1)(2) 2019A 2020E(3) 2021E 2022E 2023E 2024E 2025E
Revenue 26.4 15 - 25 77.5 165.8 328.7 584.3 941.5
% Growth (7.7%) 217.3% 114.0% 98.3% 77.8% 61.1%
Cost of goods sold 50.8 39.8 57.6 95.7 171.4 277.7 433.2
Gross profit (24.4) (15.4) 19.8 70.1 157.3 306.6 508.3
% Gross margin N.M. N.M. 25.6% 42.3% 47.9% 52.5% 54.0%
Operating Expenses 84.7 60.9 56.8 84.2 133.8 203.6 282.5
Adjusted EBITDA(4) (95.8) (64.0) (24.5) (1.5) 43.6 133.6 268.2
% EBITDA margin N.M. N.M. N.M. N.M. 13.3% 22.9% 28.5%
1. Presented financial data not inclusive of estimated public company-related costs of approximately $6M per year.
2. N,M. denotes “not meaningful”.
3. All 2020E figures excluding revenue assume high end of the revenue range ($15M - $25M).
4. Adj. EBITDA defined as Operating Income (Loss) plus Depreciation and Amortization, adjusted for stock-based compensation. Please reference slide 39 “Reconciliation of non-GAAP financials” for additional information
38
regarding the non-GAAP measures.Reconciliation of non-GAAP financials
Adjusted EBITDA(1)
($M) 2019A 2020E(2) 2021E 2022E 2023E 2024E 2025E
Operating income (loss) (109.0) (76.3) (36.9) (14.1) 23.5 103.0 225.8
Depreciation & amortization 8.1 7.8 8.0 7.5 7.5 7.5 7.5
Stock-based compensation 5.2 4.5 4.4 5.1 12.6 23.0 34.9
Adjusted EBITDA (95.8) (64.0) (24.5) (1.5) 43.6 133.6 268.2
Free cash flow(1)
($M) 2019A 2020E(2) 2021E 2022E 2023E 2024E 2025E
Cash flow from operations (96.0) (77.9) (25.6) (3.7) 33.2 110.7 240.5
Capital expenditures (6.9) (3.2) (6.0) (7.0) (8.0) (10.0) (10.0)
Free cash flow (102.8) (81.1) (31.6) (10.7) 25.2 100.7 230.5
200%+ CAGR
1. Presented financial data not inclusive of estimated public company-related costs of approximately $6M per year.
2. All 2020E figures excluding revenue assume high end of the revenue range ($15M - $25M). 39You can also read