GAME-CHANGING OPPORTUNITIES - Investor Day | July 13, 2021 - XPO's Investor Relations
←
→
Page content transcription
If your browser does not render page correctly, please read the page content below
GAME-CHANGING OPPORTUNITIES

Investor Day | July 13, 2021
Disclaimer
 Additional Information

 References herein to “GXO” refer to GXO Logistics, Inc., a wholly owned subsidiary of XPO Logistics, Inc. (“XPO”). For additional information with respect to GXO and the proposed spin-off, please refer to the Form 10 Registration Statement, as it may be
 further amended, as filed by GXO with the U.S. Securities and Exchange Commission (the “Form 10”). The spin-off is subject to various conditions, and there can be no assurance that the spin-off will occur or, if it does occur, of its terms or timing. The
 financial information included in this presentation may not necessarily reflect GXO’s financial position, results of operations and cash flows in the future or what GXO’s financial position, results of operations and cash flows would have been had GXO been
 an independent, publicly traded company during the periods presented. This presentation shall not constitute an offer of any securities for sale, nor shall there be any offer, sale or distribution of securities in any jurisdiction in which such offer, sale or
 distribution would be unlawful prior to appropriate registration or qualification under the securities law of such jurisdiction.

 Non-GAAP Financial Measures

 Some of the information included in this presentation is derived in part from XPO’s and GXO’s consolidated financial information but is not presented in XPO’s and GXO’s financial statements prepared in accordance with accounting principles generally
 accepted in the United States of America (“GAAP”). Certain of these data are considered “non-GAAP financial measures” under Securities and Exchange Commission (“SEC”) rules. As required by the SEC, reconciliations of the non- GAAP financial
 measures contained in this presentation to the most directly comparable measure under GAAP are provided and are set forth in the financial tables attached to the presentation.

 This presentation contains the following non-GAAP financial measures: adjusted earnings before interest, taxes, depreciation and amortization (“adjusted EBITDA”), pro forma adjusted EBITDA less net capex, adjusted earnings before interest, taxes and
 amortization (“EBITA”), adjusted earnings before interest, taxes, depreciation, amortization and rent expense (“adjusted EBITDAR”), return on invested capital (“ROIC”) and organic revenue.

 The above adjusted financial measures facilitate analysis of GXO’s business operations because they exclude items that may not be reflective of, or are unrelated to, GXO’s core operating performance, and may assist investors with comparisons to prior
 periods and assessing trends in GXO’s underlying businesses. Other companies may calculate these non-GAAP financial measures differently, and therefore GXO’s measures may not be comparable to similarly titled measures of other companies. These
 non-GAAP financial measures should only be used as supplemental measures of GXO’s operating performance.

 Adjusted EBITDA, pro forma adjusted EBITDA less net capex and adjusted EBITA include adjustments for transaction and integration, as well as restructuring costs and other adjustments as set forth in the tables included in the accompanying presentation.
 Transaction and integration adjustments are generally incremental costs that result from an actual or planned acquisition, divestiture or spin-off and may include transaction costs, consulting fees, retention awards, and internal salaries and wages (to the
 extent the individuals are assigned full-time to integration and transformation activities) and certain costs related to integrating and converging IT systems. Restructuring costs primarily relate to severance costs associated with business optimization
 initiatives. Management uses these non-GAAP financial measures in making financial, operating and planning decisions and evaluating GXO’s ongoing performance.

 Adjusted EBITDAR excludes rent expense from adjusted EBITDA and is useful to management and investors in evaluating GXO’s performance because adjusted EBITDAR considers the performance of GXO’s operations, excluding decisions made with
 respect to capital investment, financing and other non-recurring charges. Adjusted EBITDAR is also a measure commonly used by management, research analysts and investors to value companies in the logistics industry. Since adjusted EBITDAR excludes
 interest expense and rent expense, it allows management, research analysts and investors to compare the value of different companies without regard to differences in capital structures and leasing arrangements.

 We calculate Return on Invested Capital (ROIC) as net operating profit after tax divided by average invested capital. We believe ROIC provides investors with an important perspective on how effectively GXO deploys capital and use this metric internally as
 a high-level target to assess overall performance throughout the business cycle. We believe that presenting organic revenue improves the comparability of our operating results from period to period by excluding the impact of foreign currency exchange rate
 fluctuations. We believe comparability is improved because these items are not reflective of our normalized operating activities.

 With respect to GXO’s full year 2021 and full year 2022 financial targets for adjusted EBITDA, pro forma adjusted EBITDA less net capex, adjusted EBITDAR, ROIC and organic revenue a reconciliation of these non-GAAP measures to the corresponding
 GAAP measures is not available without unreasonable effort due to the variability and complexity of the reconciling items described above that GXO excludes from these non-GAAP target measures. The variability of these items may have a significant
 impact on GXO’s future GAAP financial results and, as a result, GXO is unable to prepare the forward-looking statement of income and statement of cash flows prepared in accordance with GAAP that would be required to produce such a reconciliation.
 Forward-looking Statements
 This presentation includes forward-looking statements within the meaning of Section 27A of the Securities Act of 1933, as amended, and Section 21E of the Securities Exchange Act of 1934, as amended. All statements other than statements of historical
 fact are, or may be deemed to be, forward-looking statements. In some cases, forward-looking statements can be identified by the use of forward-looking terms such as “anticipate,” “estimate,” “believe,” “continue,” “could,” “intend,” “may,” “plan,” “potential,”
 “predict,” “should,” “will,” “expect,” “objective,” “projection,” “forecast,” “goal,” “guidance,” “outlook,” “effort,” “target,” “trajectory” or the negative of these terms or other comparable terms. However, the absence of these words does not mean that the
 statements are not forward-looking. These forward-looking statements are based on certain assumptions and analyses made by the company in light of its experience and its perception of historical trends, current conditions and expected future
 developments, as well as other factors it believes are appropriate in the circumstances.
 These forward-looking statements are subject to known and unknown risks, uncertainties and assumptions that may cause actual results, levels of activity, performance or achievements to be materially different from any future results, levels of activity,
 performance or achievements expressed or implied by such forward-looking statements. Factors (including risks, uncertainties and assumptions) that might cause or contribute to a material difference include, but are not limited to: the severity, magnitude,
 duration and aftereffects of the COVID-19 pandemic and government responses to the COVID-19 pandemic; public health crises (including COVID-19); economic conditions generally; competition and pricing pressures; our ability to align our investments in
 capital assets, including equipment, service centers and warehouses, to our customers’ demands; our ability to successfully integrate and realize anticipated synergies, cost savings and profit improvement opportunities with respect to acquired companies;
 our ability to develop and implement suitable information technology systems and prevent failures in or breaches of such systems; our ability to raise debt and equity capital; litigation; labor matters, including our ability to manage our temporary workers, and
 risks associated with labor disputes at our customers and efforts by labor organizations to organize our employees; risks associated with defined benefit plans for our current and former employees; fluctuations in currency exchange rates; fluctuations in fixed
 and floating interest rates; issues related to our intellectual property rights; governmental regulation, including trade compliance laws, as well as changes in international trade policies and tax regimes; governmental or political actions, including the United
 Kingdom’s exit from the European Union; natural disasters, terrorist attacks or similar incidents; political, economic, and regulatory risks relating to GXO’s global operations, including compliance with U.S. and foreign trade and tax laws, sanctions,
 embargoes and other regulations; a material disruption of GXO’s operations; the inability to achieve the level of revenue growth, cash generation, cost savings, improvement in profitability and margins, fiscal discipline, or strengthening of competitiveness
 and operations anticipated or targeted; the impact of potential cyber-attacks and information technology or data security breaches; the inability to implement technology initiatives successfully; the expected benefits and timing of the separation, and
 uncertainties regarding the planned separation, including the risk that conditions to the separation will not be satisfied and that it will not be completed pursuant to the targeted timing, asset perimeters, and other anticipated terms, if at all, and that the
 separation will not produce the desired benefits; a determination by the IRS that the distribution or certain related transactions should be treated as taxable transactions; the possibility that any consents or approvals required in connection with the separation
 will not be received or obtained within the expected time frame, on the expected terms or at all; expected financing transactions undertaken in connection with the separation and risks associated with additional indebtedness; the risk that dis-synergy costs,
 costs of restructuring transactions and other costs incurred in connection with the separation will exceed our estimates; and the impact of the separation on our businesses, our operations, our relationships with customers, suppliers, employees and other
 business counterparties, and the risk that the businesses will not be separated successfully or that such separation may be more difficult, time-consuming or costly than expected, which could result in additional demands on our resources, systems,
 procedures and controls, disruption of our ongoing business, and diversion of management’s attention from other business concerns.
 There can be no assurance that the separation, distribution or any other transaction described above will in fact be consummated in the manner described or at all. The above list of factors is not exhaustive or necessarily in order of importance. All forward-
 looking statements set forth in this presentation are qualified by these cautionary statements and there can be no assurance that the actual results or developments anticipated by us will be realized or, even if substantially realized, that they will have the
 expected consequences to or effects on us or our business or operations. Forward-looking statements set forth in this presentation speak only as of the date hereof, and we do not undertake any obligation to update forward-looking statements to reflect
 subsequent events or circumstances, changes in expectations or the occurrence of unanticipated events, except to the extent required by law.                                                                                                                              2
Agenda

                INTRODUCTION

            INVESTMENT HIGHLIGHTS

              INDUSTRY OVERVIEW

              A WINNING CULTURE

         MARGIN-ENHANCING TECHNOLOGY

              FINANCIAL OVERVIEW

                                       3
Introduction
Today’s presenters and contributors

                   Brad Jacobs           Malcolm Wilson               Baris Oran                 Mark Manduca
                     Chairman             Chief Executive             Chief Financial            Chief Investment
                                              Officer                     Officer                     Officer

       Eduardo                  Richard               Bill Fraine                  Neil Shelton               Karlis Kirsis
     Pelleissone               Cawston               Chief Commercial            Chief Strategy Officer      Chief Legal Officer
  President – Americas      President – Europe             Officer
    and Asia Pacific

      Sandeep                  Meagan                 M a r yc l a i r e          Gavin Williams             An g u s T w e e d i e
     Sakharkar              Fitzsimmons                Hammond                     President – UK                Senior Vice
    Chief Information       Chief Compliance           Chief Human                   and Ireland             President, Strategy
         Officer            and ESG Officer          Resources Officer

                                                                                                                                      5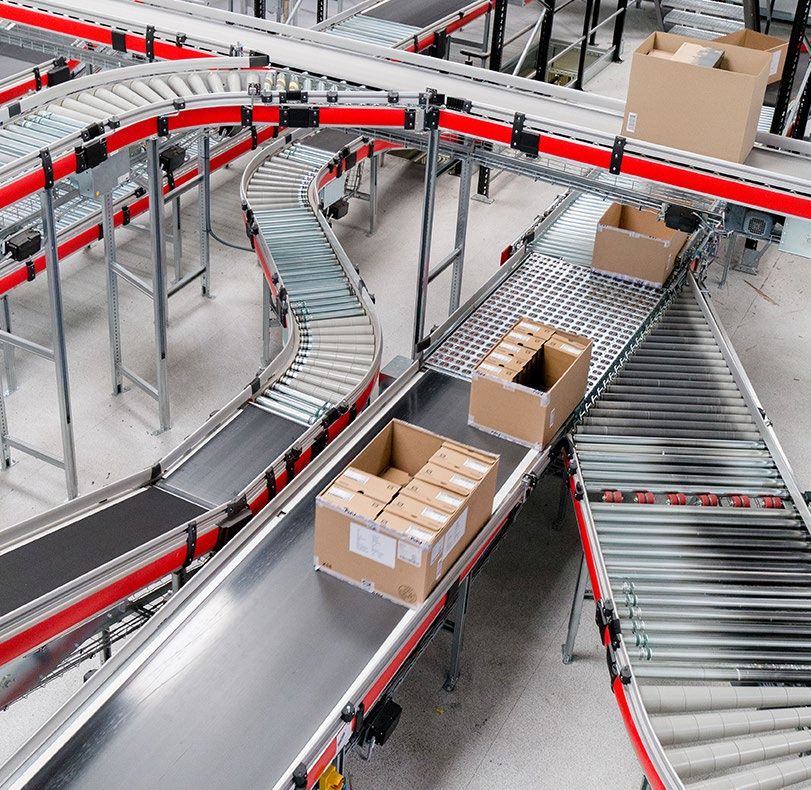
Global leader in supply chain management and warehouse automation

                                             10%                    17%
                                         2021E – 2022E             2021E – 2022E
                                        Revenue growth1       Adjusted EBITDA growth1

                           $1.5 billion                             28%
                               2022E Adjusted EBITDAR1       Return on invested capital²

                                        INVESTMENT-GRADE CAPITAL STRUCTURE

1   Represents midpoint of 2022E guidance
2   See ROIC reconciliation in appendix for calculation
                                                                                           6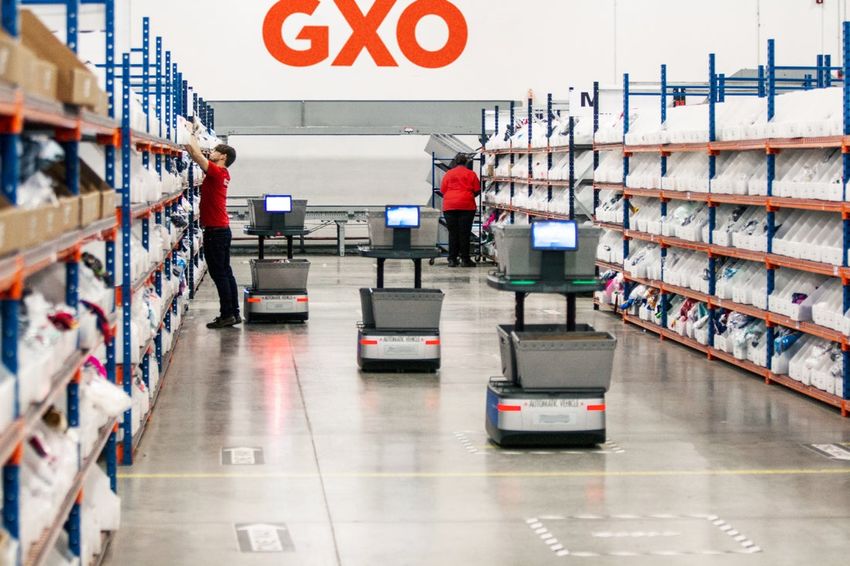
Introducing GXO, logistics at full potential

                                               7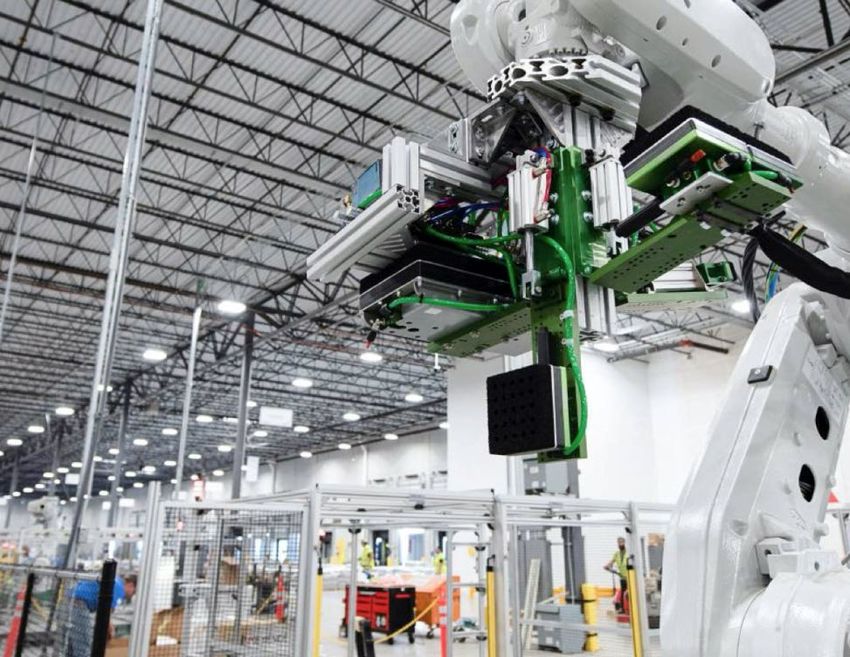
Investment highlights
Key investment highlights

 1   Massive secular tailwinds

 2   Long-term relationships with blue-chip customers

 3   Critical scale in a growing market

                                                          Largest global
 4   Revenue- and margin-enhancing technology
                                                        pure-play contract
                                                        logistics provider

 5   Attractive, resilient financial profile

 6   World-class team

                                                                         9
1 GXO’s three major structural tailwinds

                 E-COMMERCE                                      WAREHOUSE AUTOMATION                                 OUTSOURCING

 E-commerce penetration1                                  Warehouse automation penetration2           % of logistics that is outsourced3

                                                                                                          Currently insourced              Outsourced
      E-commerce              Global e-commerce              Automation        Automated warehouses              70%                          30%
       opportunity                   20%                     opportunity               5%                     $300 billion                 $130 billion
          80%                                                   95%

                       Megatrends at early stage with significant runway ahead
Sources: L.E.K. Consulting, other third-party research
1 Represents global e-commerce market
2 Represents approximate penetration in U.S. and Europe
3 Represents North America and Europe
                                                                                                                                                          10
1 Balanced mix of high-growth and durable verticals
GXO’S VERTICAL MIX KEY HIGHLIGHTS
% of 2020 revenue
11%
Other E-commerce,
24% omnichannel and
technology
50%
2021E – 2025E e-commerce
industry CAGR1
Consumer
packaged goods
13%
76%
GXO revenue coming from non-
cyclical consumer end markets
Food and
beverage
13%
Source: Third-party industry research
1 CAGR for North America and Europe combined 112 Diversified blue-chip customer base with long tenure
END MARKETS KEY CUSTOMERS
MULTI-YEAR
CONTRACTS WITH
93%
AVERAGE HISTORICAL
E-commerce,
REVENUE RETENTION RATE
omnichannel and
technology
AVERAGE TENURE OF
TOP 20 CUSTOMERS IS
15
YEARS
Food and
NO ONE CUSTOMER
beverage
ACCOUNTS FOR
MORE THAN
Consumer
packaged goods 4%
OF TOTAL REVENUE1
1 Based on 2020 revenue
123 GXO’s footprint and scale are major competitive advantages
885 locations, primarily in North America and Europe
133 Largest global pure-play contract logistics provider
KEY M ET RICS 1 2022E REVENUE VS. PURE- PL AY PEERS 4
$ in billions
Countries of operation 27
Locations 885
Team members2 ~93,000
Total addressable opportunity3 ~$430 billion
Total warehouse space ~210 million sq. ft.
Total customers >1,000
GXO Peer A Peer B Peer C
Approximately 4x – 8x the size of nearest pure-play competitors
Note: Financials converted to USD using exchange rate as of July 2, 2021
1 As of March 31, 2021
2 ~66,000 employees and ~27,000 temporary workers
3 Third-party industry research; total estimated logistics industry size in North America and Europe; ~$130 billion opportunity currently outsourced
4 Peers include Clipper Logistics, ID Logistics, and Wincanton; figures reflect 2022E IBES consensus estimates as of July 2, 2021 144 Intelligent warehouse automation generates measurable improvements
ROBOTICS GOODS-TO-PERSON ADVANCED VISION TECHNOLOGY
SYSTEMS SORTATION SYSTEMS
Driving improved productivity,
revenue and margin growth
Up to 6x labor productivity improvement with automation
Faster, more consistent outcomes for customers
154 Sophisticated, technology-driven solutions
165 Typical contracting process
O UR STRENG TH S PO SI TI O N US TO WI N KEY SELECTI O N CRI TERI A
Higher-value-add
1 1 services (e.g., reverse
logistics)
Initial RFP
3-5 bidders
Scale and ability to
2
2 service customers
Initial Down Select globally
2-3 bidders
3
Finalists Robotics and
3 advanced automation
1-2 bidders
4
Winner Investment-grade
4 balance sheet
175 Anatomy of a target GXO contract
Customer typically covers most upfront costs
Variable rate; based on output
Leases are generally co-terminus with contracts
Protections against labor cost inflation
Long durations create durable partnerships
185 GXO has a balanced contract mix that passes through costs
Open Closed
book book
Spectrum of typical contracts
Higher Higher
ROIC margin
HYBRID CONTRACTS INCLUDE ELEMENTS OF BOTH
OPEN AND CLOSED BOOK STRUCTURES BASED ON:
Region Vertical Services
195 Customer contract profile
~3 yrs. Day 1 28%
Target payback period Target contract profitability 2021E GXO ROIC1
Long-duration contracts create visibility into future revenue
1 See ROIC reconciliation in appendix for calculation
205 GXO has shown resilience through all cycles
$ in billions
Grew
through M&A MILESTONES
COVID
6.2 2008: Acquisition of
6.1 6.1
Salvesen Logistics
5.2 2011: Acquisition of TDG
(Laxey Logistics)
4.8
2015: Full-year impact
4.0 of New Breed Logistics,
Stable through Great
Jacobson, and
3.6
Financial Crisis1 Norbert Dentressangle
3.2
acquisitions
2.8 2.8
2.4 2016: Full-year impact
2.3 2.2
of Menlo Logistics
acquisition
1.2
1.0
0.8 0.8
0.6
0.4
2002 2003 2004 2005 2006 2007 2008 2009 2010 2011 2012 2013 2014 2015 2016 2017 2018 2019 2020
Nearly two decades of double-digit revenue CAGR
Sources: Management’s pro forma financials: 2016-2017 revenue as reported for XPO’s logistics segment; 2018-2020 as presented in GXO’s audited combined financial statements
1 EUR/USD annual depreciation of ~5%
215 Best-in-class growth profile on track to deliver strong earnings in 2022E
2021E – 2022E ORGANI C REVENUE GROW TH¹ PRO FORMA ADJUSTE D EBI TDA 1
$ in millions
+3 – 4% +8 – 12%
700 - 735
+5 – 8%
457
Business wins² Growth in existing 2022E organic growth 2020⁴ 2022E
facilities
Growth propelled by a combination of new business wins
and margin expansion
¹ Represents 2022E guidance ² Net of attrition ³ Calculated using the midpoint of 2022E guidance 4 Calculated using the midpoint of pro forma adjusted EBITDA guidance 22
comparable to 2021 outlook (see reconciliations of GXO pro forma adjusted EBITDA in appendix)Industry overview
Highly fragmented growth market

              ~$430 billion                                                                                 ~$130 billion
                       Total addressable opportunity1                                                              Current addressable opportunity2
Regionally diverse revenue base
KEY REGIONS % OF 2020 REVENUE GXO’S COUNTRY POSITION
36%
United States #2
United Kingdom #2
25%
France #4
10%
The Netherlands 8%
#2
7%
Spain #2
GXO is a top logistics provider in all of its key geographies
25Decades of expertise in high-growth verticals
% OF 2020
TOP VERTICALS STRONG VALUE PROPOSITION
REVENUE
Comprehensive B2C services, including sophisticated supply chain management facilitated by
50%
advanced automation and data science
E-commerce, High-value-add services include order personalization, reverse logistics, peak labor
omnichannel management, complex inventory management and forecasting
and technology Characterized by dual channels: retail and direct-to-consumer fulfillment
Consumer tech logistics for manufacturers and telecom providers includes high-volume returns
management, repair and refurbishment of consumer electronics
13%
Frozen, refrigerated and dry storage, with stringent regulatory compliance and code tracking
Food and
Fulfillment for retail, hospitality and direct-to-consumer supply chains
beverage
Recalls management
13%
Consumer Replicable solutions for consistent results across national and multinational consumer markets
packaged goods Consumer purchase behavior driving demand for e-commerce and omnichannel fulfillment
26Mix, automation and scale expected to drive GXO revenue outperformance
C O N T R AC T L O G I S T I C S I N D U S T R Y G R O W T H 1 P R I M AR Y G R O W T H D R I V E R S F O R T O P P L AYE R S
$ in billions
>10%
153
130
111
~4.0%
2015 2019 2023E Market Growth in Demand for Regional Adjusted GXO
growth e-commerce automation outsourcing growth rate 2
growth
GXO’s favorable geographic and vertical mix coupled with technology
leadership are driving even greater levels of growth
Sources: Management estimates and third-party research
1 Assumes EUR to USD exchange rate of 1.1
2 Represents 2022E guidance
27E-commerce exposure and growth rates by region
NORTH AMERI C AN EUROPEAN
GXO’ S GEOGRAPHI C MI X
E-COMMERCE I NDUSTRY GROW TH E-COMMERCE I NDUSTRY GROW TH
$ in billions 2020 revenue mix $ in billions
Other
2%
1,290 809
North
America
550
829 36%
Europe
62%
2021E 2025E 2021E 2025E
E-commerce industry growing at ~11% across GXO’s key geographies
Source: Third-party industry research
28Product returns increase demand for e-commerce logistics
E-COMMERCE DRI VES HI GHER
GXO REVERSE LOGI STI CS REVENUE TREND
W AREHOUSE DEMAN D
$ in millions
3x – 10x 522
Revenue uplift when a customer
switches to e-commerce
389
2x – 5x
Revenue uplift from reverse logistics
vs. outbound parcel
2018 2020
GXO plays a pivotal role in the circular economy
29Increasing complexity drives outsourcing trend
CUSTOMER NEEDS BECOMING MORE COMPLEX1 OUTSOURCED SHARE OF SUPPLY CHAIN ACTIVITY
43% 90% 90%
Expected annual growth in same-day deliveries
60%
1 in 3
E-commerce products are returned
30%
60% Full truckload Courier, express Ocean and air Contract logistics
Retail apparel purchases are omnichannel or online and parcel services freight
GXO is well-positioned to capitalize on shift to outsourcing
Source: Third-party industry research
1 North American market data
30A winning culture
We solve complex supply chain problems

                                         32
GXO’s winning culture
Global scale
As much as 8x larger than other
pure-play logistics providers1
Two decades of experience
Deep expertise implementing high-value-added
services to 1,000+ customers
Trusted partner
Top 20 customers have been with
GXO for 15 years on average
Customers choose GXO for its unrivaled capabilities
1 Includes only publicly listed peers
33GXO possesses significant scale advantage over pure-play peers
Pure-play peers1
~16,000 ~93,000
Number of team members Number of team members2
~29 million ~210 million
Warehouse space, sq. ft. Warehouse space, sq. ft.3
Source: Public filings
1 Figures represent median of selected peers (CLG, WIN, IDL) as of latest filings
2 As of March 31, 2021; ~66,000 employees and ~27,000 temporary workers
3 As of March 31, 2021 34GXO has the expertise to run the industry’s most complex supply chains
CUSTOMER PROBLEM GXO SOLUTION
“We need a comprehensive Full-service offerings for entire
e-commerce supply chain solution” e-commerce supply chain
“We need a single provider to manage Unified offering across global
our multinational supply chain” footprint
Strong real estate negotiating
“Our warehouse rents are too high” power as a top five global
industrial tenant
GXO’s ability to replicate outcomes across markets is a key differentiator
35Customer case study – Walt Disney Parks and Resorts
The Disney MagicBand is an all-in-one, personalized wristband
technology that gives a guest access to the Park, unlocks the
Disney hotel room and is used to buy food and merchandise
In 2013, Disney sought a partner to collaborate in creating a
CUSTOMER supply chain for the new MagicBand product
NEED Disney required a customized logistics process for engraving and
fulfilment that would ensure accuracy and delight their guests
GXO developed a custom software-hardware solution, working
with Disney, the MagicBand manufacturer and laser manufacturer
GXO had previously invested in RFID, the technology used to
GXO
read the MagicBand
SOLUTION
GXO’s packaging engineers helped create a solution that satisfies
production and shipping objectives, while providing guests with an
attractive keepsake at the lowest possible cost
Rigorous controls built into GXO’s solution ensure that the right
name is engraved on each band prior to shipping
KEY
RESULTS Engineered packaging enhances the out-of-box experience for
recipients in keeping with the Disney brand, without adding
unnecessary cost
Tenure SUPERIOR GXO has helped transform how guests enjoy Disney Parks and
VALUE resorts through a personalized experience
Personalized fulfillment: 8 years
36GXO’s capabilities cover the full spectrum of warehousing needs
CUSTOMER PROBLEM GXO SOLUTION
“1 in 3 pairs of shoes we sell are being
returned and it’s causing significant Reverse logistics
disruption”
“We’re sending customers the Advanced automation
wrong products at a high rate” and robotics
“Labor availability has become less GXO Smart™
predictable during Covid” labor management tools
Digital capabilities create value for the company and its customers
37Customer case study – Nike
Nike is one of the world’s most recognizable brands for athletic
footwear, apparel, equipment and accessories
CUSTOMER In 2017, Nike sought a logistics partner to manage product returns
NEED An increase in returns was adversely impacting Nike’s bottom line
GXO facilitated the set-up of over 1 million sq. ft. of reverse
logistics space and accelerated the processing of inbound returns
GXO
SOLUTION Deployed advanced planning to predict and prioritize high-value
products in the reverse logistics process, reducing unnecessary
inspections and the remerchandising of low-value products
Increased margin through improved velocity, advanced planning
and analytics at a state-of-the-art facility, with engaged employees
KEY
Eliminated backlog of more than 1,000 trailers, with remaining
RESULTS
trailers processing packages within 48 hours
Continue to provide support for 4,000,000 SKUs
GXO dramatically reduced overall cycle time for Nike returns by
SUPERIOR
integrating cutting-edge technology and reverse practices to
Tenure VALUE
achieve hyper-fast velocity
Reverse logistics: 4 years
38Customer case study – Nike Rebound: Hyper-fast returns
39GXO builds long-term partnerships with customers
CUSTOMER PROBLEM GXO SOLUTION
“We need a trusted 3PL partner Largest global pure-play contract
without channel conflict” logistics provider
“We’re selling a high-profile
Long-tenured track record of
new product and need to ensure a
smooth rollout” superior execution
Expertise building
“We need to reduce the carbon
footprint in our supply chain” environmentally friendly
warehouses
Customers trust GXO with their most important asset – their reputation
40Continuous improvement positions GXO as a trusted partner
Focus on continuous improvement (“CI”) drives best-in-class solutions and outcomes
Identifies best CI tools available and shares universal best practices across footprint
Identifies best vertical-specific practices, clearly differentiating GXO to customers and market
Annual efficiency gains of 1% to 2% of sales, realized through CI initiatives
CONTINUOUS IMPROVEMENT
CONTINUOUS IMPROVEMENT LEVERS
EFFICIENCY GAINS AS % OF REVENUE
Management Customer A
Logistics processes Business retention
performance
Levers: Levers: Levers: Customer B
SMART (productivity) Playbook per vertical IN SITE (tariff
IN SITE (daily P&L) Maturity assessment profitability analysis)
Customer C
SID (CI plans data (360° audit) Dedicated CI programs
base) Productivity Renewal support
ABC (slotting benchmarks Customer D
optimization) TIME PRO (video tool)
0.0% 1.0% 2.0%
41GXO Direct: an innovative, shared-space distribution solution for customers
National distribution solution that gives customers fluid fulfillment with more flexibility than traditional distribution
models, and at lower cost
ADV ANT AGES FOR CUSTOMERS ADV ANT AGES FOR GXO
Maintain independent brand identity and value chain Differentiates GXO from other logistics providers
Access to logistics scale, expertise and technology without adding Shared warehouse model increases utilization of existing
high-fixed-cost distribution centers warehouses and other resources
Predictive analytics help plan inventory flows – Over 1.7 million square feet of warehouse space converted
into GXO Direct across 20 locations
Reposition inventory within one and two-day ground delivery range
of ~99% of the US population – increasing customer revenue Enables commercial relationships with emerging
growth by ~20% on average super-growth firms that are too small to support a dedicated
logistics facility
Service agility enhances brands
Unrivaled speed to market
GXO DI RECT I NTEGRATES THI RD PARTY E-COMMERCE PLATFORMS AND OMNI CHAN NEL RETAI LERS
>$100 million of 2021E GXO Direct revenue,
with 30% YoY growth in 2021E
42Committed to achieving bold environmental targets
30% 100% 50%
Greenhouse gas
Carbon neutral Renewable global
emission reduction by
by 2040 electricity by 2030
2030 vs. 2019
80% 80%
Global operations using Global landfill
LED lighting by 2025 conversion rate by 2025
GXO is focused on attaining its own ESG targets and helping
customers attain their targets
Note: All ESG targets are subject to approval by the board of directors to be appointed at time of spin-off
43Customer case study – Kering Group, the carbon negative warehouse
Kering is a global luxury group with an ensemble of renowned
labels in fashion, leather goods, jewelry and watches
Kering sought an experienced contract logistics provider to help ship
CUSTOMER its luxury goods under various brands on a global scale
NEED The solution must include value-added services, including drop
shipments and reverse logistics
GXO’s comprehensive solution includes multi-shuttle technology,
line-hanging solutions, conveyors, mobile racking and shelving, and
GXO packing stations supported by automation
SOLUTION GXO began operating the first warehouse in 2020 and the second in
2021; the operations are designed to reduce environmental impact
and are certified to ensure sustainability
GXO’s sophisticated logistics solution has led to extremely
short lead times for B2B fulfillment, comparable to the speed of
KEY e-commerce operations
RESULTS
Shipments are customized based on final destination, close to the
time of distribution
A new, GXO-managed logistics complex of 150,000 sq. m.
(~1,615,000 sq. ft.) is in the start-up phase in Trecate, Italy
Tenure
SUPERIOR The Trecate plant will have one of Europe’s largest rooftop solar
20 years
VALUE systems, saving an estimated 7,500 tons CO2 a year
The site will also be the first industrial complex in Italy to produce
more energy than it consumes
44Dedicated to fostering a culture of safety, diversity, inclusion and development
Favorable mix of employees and
agency labor
Best-in-class safety record
Diversity, inclusion and belonging steering
committee
High level of employee engagement
Ongoing employee education to raise
awareness about inclusion
Numerous community outreach programs
78% of 2020 US hires were diverse 1
1 Defined as a person of color, military veteran, LGBTQ+, or a person with a disability
45GXO’s culture of safety and diversity
46$2 billion pipeline focused on e-commerce
PIPELINE NEAR ALL-TIME HIGHS1 DRIVING SUBSTANTIAL NEW BUSINESS
$ in billions Annualized revenue from new business won
$ in billions
2.0
1.8 1.8
0.8
0.6
2019 2020 2021 YTD 2019 2020
OUTSIZED EXPOSURE TO FAST GROWING E-COMMERCE VERTICAL1
% of current pipeline
66%
34% E-commerce, omnichannel
Other retail and technology
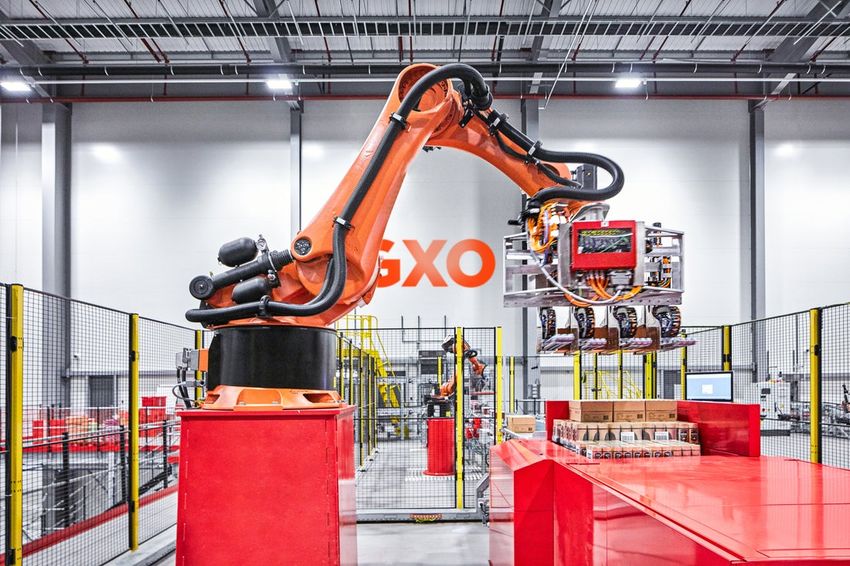
1 Represents total pipeline as of June 2021 47Margin-enhancing technology
GXO is already building the warehouses of the future

                 Warehouse of the past                                          Warehouse of the future

                                                                                         Advanced
                      Labor intensive
                                                                                        automation

                                              Reduced             Intelligent                             Improved
 Lack of speed
                                             productivity          robotics                               efficiency

                                                                Artificial
Poor service                                   Limited      intelligence and                               Reduced
and accuracy                                 automation     machine learning                               footprint

                    Lack of visibility and                                          Cloud-based systems
                      interconnectivity

                 Logistics is 3% of customer ’s overall cost base and has a
                         massive impact on consumer experience
                                                                                                                       49
Technology enables better outcomes for GXO and its customers
Revenue Margin Scale and
Growth Expansion Retention
Automated customer
Automation drives Automated customers
solutions have higher
improved productivity are bigger and stay with
revenue growth than
and higher margins GXO longer
GXO’s average
Pipeline and Efficiency and Customer
Implementation Sustainability Service
Higher win percentage Enhanced safety,
Greater speed, accuracy
of automated vs. visibility, management
and predictability;
non-automated of resources, and ESG
lower cost
opportunities credentials
50Hardware: GXO’s automation implementations deliver operational benefits …
Provides superior visibility and control
Increases fulfillment speed and accuracy
AUTOMATED GUIDED
ROBOTICS
Eliminates data silos VEHICLES
Overcomes space and labor constraints
Mitigates safety risks
ADVANCED SORTATION
VISION TECHNOLOGY
SYSTEMS
3,100+ robots and automation systems in place by YE 2021
51And generate dramatic productivity gains …
Manual Automated
Robotic arm
210 800
+4x
Cases / hour picking rate Cases / hour picking rate
Robotic destacker
17 100
Pallets / hour de-stacking rate
+6x Pallets / hour de-stacking rate
Automated gantry
210 3,400
Cases per hour rate
+16x Cases per hour rate
Note: Data represents recent GXO deployments
52Leading to higher growth and expanding margins
GREATER AUTOMATION EXPOSURE FASTER REVENUE GROWTH HIGHER AUTOMATED MARGINS
Automation revenue as a % of total revenue % revenue growth from customers using automation EBITA margins for customers using automation
~30%
~5%
Industry GXO Non-automated Automated Traditional warehousing Automated solutions
Source: Third-party data, management data
Note: Data represents GXO European operations
53Software: GXO’s proprietary digital ecosystem enhances visibility and control
Enables sophisticated integration of advanced automation
Facilitates collaboration with world-class manufacturers to engineer customized solutions
Provides in-house control of intelligent solutions, including robotics and goods-to-person systems
Speeds startup of customer projects
Supports management decision-making with data-driven insights
GXO SmartTM WMx OMx
Labor management Warehouse management Order management
CMx WCx BAx
Connection
Warehouse controls Business analytics
management
54Software: GXO Smart™ technology delivers productivity improvements of 5% to 7%
Proprietary suite of intelligent
productivity tools that optimize
labor cost Continuous
+ Improvement
Machine learning drives productivity Cloud
and operational effectiveness
HR data Analytics applications
Optimizes labor force through peaks
and troughs
Managing Mobile
Transactional devices and
data handhelds
Site-specific modeling helps
managers optimize decision-making
Modeling
Delivering tangible EBITDA Time and Productivity
improvement in 2021 attendance Planning
SmartTM currently deployed in ~60%
of GXO sites
“You have done an outstanding job…our productivity is through the roof.”
– Large European omnichannel retailer
55GXO Smart™ productivity management
56Customer case study – Nestlé
Nestlé is the world’s largest food and beverage company
“I'd like to offer a huge thank
you to the many people at
CUSTOMER Nestlé sought to build a state-of-the-art digital warehouse and
Nestlé and [GXO] who have NEED innovation center in the UK for global product distribution
worked so hard to bring our
vision to life in this magnificent
facility. Our digital distribution
GXO helped design and develop a ~638,000 sq. ft. facility that
warehouse is an important step GXO launched in 2020 with the ability to dispatch 1 million pallets per
forward for our business and SOLUTION year – the highest throughput of any site in Nestlé’s global
logistics network
our customers.”
Andrew Shaw The state-of-the-art digital warehouse of the future gives
Supply Chain Director, consumers faster, more efficient access to the iconic brands of
KEY the global food and beverage leader
Nestlé UK and Ireland RESULTS
GXO and Nestlé are continuously improving responsiveness to
channel customers by innovating fulfillment
GXO strengthened its relationship with this world-class company
Tenure SUPERIOR
through an innovative collaboration, and Nestlé continues to trust
VALUE
CPG logistics: 21 years GXO with critical logistics needs
Warehouse of the future: 1 year
57Customer case study – Nestlé digital warehouse of the future
58Financial overview
Expected timeline of the spin-off

Key events                                                                                                  Timing

Public announcement of separation                                                                           December 2, 2020

Public Form 10 filing                                                                                       June 9, 2021

Completed debt financing                                                                                    July 2, 2021

Investor day presentation                                                                                   July 13, 2021

Start of regular way trading                                                                                August 2, 2021

Note: There can be no assurance that the spin-off will occur or, if it does occur, of its terms or timing
                                                                                                                               60
Financial performance highlights
Best-in-class top-line growth
8% to 12% 2022E YoY revenue growth, underpinned by $2 billion pipeline
Attractive returns profile
28% 2021E ROIC1
Robust free cash flow generation
Maintenance capex of ~1% of revenue
Strong balance sheet
Investment-grade capital structure
Note: Figures represent 2022E guidance unless stated otherwise
1 See ROIC reconciliation in appendix for calculation
61Capital allocation priorities
Organic
Prioritizing above-market growth
growth
Productivity and
Ongoing investment in productivity and automation
technology
Balancing Disciplined approach to acquisitions
acquisitions and
capital return Return of capital to shareholders
Near-term
investment- Committed to remaining investment-grade
grade profile
62Key investment criteria
2021E ROIC BRIDGE
33% 5%
28%
Maintain
ROIC target:
investment-grade
28%+
rating
Target project
Aligned to ESG
payback period:
goals
~3 years
Project ROIC Central costs and GXO ROIC
investment
~68% of GXO’s 2021E capex relates to growth projects
632021E – 2022E organic revenue growth bridge
COMMENTARY
+8 – 12%
+3 – 4% Organic revenue growth of 8% – 12%
for FY 2022E, above pro forma 2021E
Growth of 5% – 8% from business wins
– Record sales pipeline of ~$2 billion
and growing
+5 – 8%
– High-quality opportunities converted
to GXO wins
Growth of 3% – 4% in revenue from
existing customers
Long-cycle contracts
Increase in volume and prices
Business wins¹ Growth in existing 2022E organic
facilities growth
1 Net of attrition
64More than a decade of above-market growth remains
MEGATREN DS DRI VI NG TOPLI NE GROW TH GXO’ S TAI LW I NDS DRI VE ABOVE-M AR KET GROW TH
2019–2023 industry CAGR
E-commerce adoption is accelerating coming out of
COVID >10%
– ~11% e-commerce CAGR over next 5 years
Customers are demanding increased automation
capabilities
– GXO is a leader in automation, where there is ~4.0%
only currently ~5% penetration
Increased complexity of supply chains will drive
further trend towards outsourcing
– Only 30% of contract logistics is currently
outsourced
Market Growth in Demand for Regional Adjusted GXO
growth e-commerce automation outsourcing growth rate 1
growth
Secular megatrends will contribute to expected
double-digit revenue growth
Sources: Management estimates and third-party research
1 Represents 2022E guidance
652021E – 2022E adjusted EBITDA bridge
$ in millions
30 – 35 700 – 735
26 – 32
40 – 45
600 – 630
2021E adjusted EBITDA Business wins¹ Growth in existing facilities Operating efficiencies 2022E adjusted EBITDA
Revenue growth Margin improvement
Note: 2021E adjusted EBITDA is shown on a pro forma basis
1 Net of attrition
66Drivers of long-term margin expansion
MARGI N EXPANSI ON LEVERS E-COMMERCE DRI VES MARGI N EXPANSI ON
Drive further implementation of GXO SmartTM and 2020 adjusted EBITDA margin % before overhead allocation
other proprietary software tools
– GXO SmartTM implemented in ~60% of sites +290 bps
Grow base of multinational, high-margin contracts 11.0%
Expand high-value-added services (e.g. reverse
logistics) 8.1%
– Reverse logistics only being used by ~30% of
customers
Mobilize strategic account management teams
solely focused on landing the largest, most profitable
accounts
Customers without Customers with
reverse logistics reverse logistics
Clearly defined initiatives underway for long-term margin expansion
67Attractive capital structure to fuel future growth
EXPECTED CAPITAL STRUCTURE AT SPIN-OFF COMMENTARY
Balance sheet right-sized for optimal
Cash $100 million cost of capital
No maturities due before 2026
Expect minimum total liquidity of $900 million
Debt $800 million
– Minimum cash balance of $100 million
– Five-year revolving credit facility with
$800 million capacity
Average cost of debt 2.15%
Capabilities to invest in growth;
investment-grade balance sheet
Net debt1 / 2021E Maintain leverage in target range of
1.1x
pro forma adjusted EBITDA2 1.0x – 1.5x
Fully funded pension position; no cash
contribution required
Dividend policy to be determined by Board
1 Calculated as total debt of $800 million less cash and cash equivalents of $100 million
2Reflects 2021 guidance; leverage is not inclusive of finance leases
68
Refer to the “Non-GAAP Financial Measures” section on page 2 of this documentSignificant runway for free cash flow generation
Track record of significant cash generation SIG NIFICANT LEVERS T O EXPAND
EARNING S ACRO SS CY CLES
whilst delivering best-in-class revenue Pro forma adjusted EBITDA less net capex1
growth
$ in millions
370
247
Two-thirds of capex relates to growth
– Maintenance capex on a favorable
trend due to operational efficiencies 2020 2021E
M O D E S T C AP E X R E Q U I R E M E N T S
– Maintenance capex currently ~1% of Maintenance capex as % of revenue
revenue
1.5%
~1.3%
2020 2021E
Low maintenance capital requirements drive future
free cash flow expansion
1 See adjusted EBITDA less net capex reconciliation in appendix
69Summary
Reasons to invest in GXO

                           MASSIVE SECULAR TAILWINDS

                   CRITICAL SCALE IN A GROWING MARKET

      LONG-TERM, CONTRACTED AND DIVERSE BLUE-CHIP CUSTOMERS

       PROPRIETARY TECHNOLOGY IMPROVING CUSTOMER OUTCOMES

           FAST-GROWING AND HIGH-RETURN FINANCIAL PROFILE

         Largest global pure-play contract logistics provider,
                      led by a world-class team

                                                                 71
Appendix
GXO Investor Day presenters
Brad Jacobs Malcolm Wilson
Chairman Chief Executive Officer
Over 40-year career, has started five companies from Three decades of executive experience managing
scratch and led each to become a billion dollar or multinational supply chain operations
multi-billion dollar enterprise CEO of XPO’s European business since 2017
Includes XPO Logistics (NYSE: XPO) and United Head of logistics division for Norbert Dentressangle;
Rentals (NYSE: URI), both among the 20 best- grew the division to global scale in 15 countries as
performing stocks of the last decade ND’s largest revenue-producing unit
Serves as Chairman and CEO of XPO
Baris Oran Mark Manduca
Chief Financial Officer Chief Investment Officer
Over 20-year track record in capital markets and Over 15-year track record in equity research covering
omnichannel retail, with a strong background in transportation and logistics, with distinction as the #1
international finance European transport research analyst for eight
consecutive years
Former CFO of the Sabanci Group, one of
Former Managing Director at Citigroup leading
Turkey’s largest publicly traded companies
transportation research activities
Spent eight years at Bank of America leading business
services, leisure, and transport research teams
Bill Fraine Richard Cawston
Chief Commercial Officer President – Europe
Over 30 years in logistics, including 10 with XPO 20-year career in logistics, including deep expertise
in the e-commerce sector
Former Division President, Sales and Operations, of
XPO’s logistics business in the Americas and Asia Former President of XPO’s logistics business in
Pacific Europe
Previously, spent more than 20 years at FedEx in Joined XPO from Norbert Dentressangle with a
various positions strong track record of customer expansion
Eduardo Pelleissone Gavin Williams
President – Americas and Asia Pacific President – UK and Ireland
Over 15-year track record in logistics and Over 25-year track record in logistics and
operations operations, including 7 with XPO
Former Chief Transformation Officer for XPO, Former Managing Director for the United Kingdom
responsible for the company’s business and Ireland for XPO
transformation initiatives
Previously, spent 18 years with Wincanton in a
Former COO and executive vice president of
breadth of senior roles
global operations for Kraft Heinz
73Reconciliations of GXO pro forma adjusted EBITDA
GXO ADJUSTED EBITDA RECONCILED TO OUTLOOK
$ in millions
2020 GXO pro forma adjusted EBITDA (as presented in Form 10) 442
Adjusted for expected corporate cost run rate 10 – 20
2020 GXO pro forma adjusted EBITDA (comparable to 2021 outlook) 452 – 462
2021 underlying EBITDA growth 148 – 168
2021 GXO pro forma adjusted EBITDA outlook 600 – 630
74Reconciliations of GXO pro forma adjusted EBITDA (cont.)
NET LOSS ATTRIBUTABLE TO GXO RECONCILED TO ADJUSTED EBITDA FOR 2020
$ in millions
Net loss attributable to GXO (14)
Net income attributable to noncontrolling interest (9)
Net loss (5)
Interest expense 31
Income tax provision 15
Depreciation and amortization expense 325
Transaction and integration costs 47
Restructuring costs 29
GXO pro forma adjusted EBITDA (as presented in Form 10) 442
75Estimated impact of a January 1 spin-off on full-year financial targets
SPIN-OFF IMPACT ON SELECT 2021 FINANCIAL TARGETS
$ in millions
GXO
Post-Spin-Off
Depreciation and amortization1 240 – 250
Interest expense2 20 – 25
Income tax rate 26% – 28%
Net capital expenditures 240 – 250
Cash interest 20 – 25
Cash taxes 80 – 90
1 Excludes acquisition-related amortization expense of $55 million
2 Assumes GXO issues $800 million of notes at an average interest rate of ~2%
76ROIC reconciliation
SELECT FINANCIALS AND GUIDANCE
$ in millions
Select income Select balance sheet items2 GXO pro forma
2021E Guidance
statement items
Adjusted EBITDA 600 – 630 Equity 2,451
(-) Depreciation and amortization1 240 – 250 (+) Debt 800
Adjusted EBITA 360 – 380 (+) Finance leases 161
(-) Income tax rate @ 26% – 28% 94 – 106 (-) Cash 100
NOPAT 266 – 274 (-) Goodwill 2,048
(-) Intangibles 307
Invested capital 957
1 Excludes acquisition-related amortization expense of $55 million
2 Per the GXO Form 10
77Adjusted EBITDA less net capex reconciliation
SELECT FINANCIALS AND GUIDANCE
$ in millions
2020 2021E3
Adjusted EBITDA 4571 615
(-) Net capital expenditures 2102 245
Adjusted EBITDA less net capex 247 370
1 Midpoint of 2020 GXO pro forma adjusted EBITDA comparable to 2021 outlook (see reconciliations of GXO pro forma adjusted EBITDA in appendix)
2 Calculated as $222 million gross capital expenditures and $12 million gross proceeds per GXO Form 10
3 Reflects midpoint of 2021E guidance
78You can also read