Results Presentation For the full year ended 30 June 2020 - Bell Direct
←
→
Page content transcription
If your browser does not render page correctly, please read the page content below

Results
Presentation
For the full year ended
30 June 2020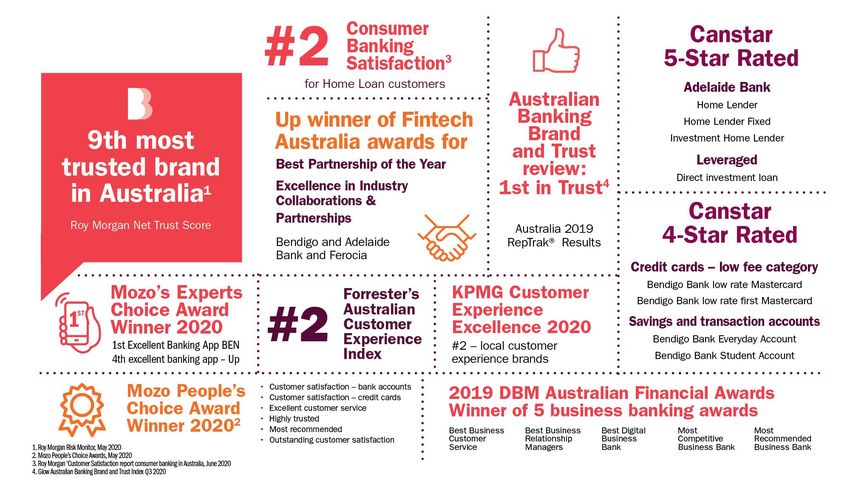
Agenda

Overview           Marnie Baker

FY20 financials    Travis Crouch

COVID-19 impacts   Taso Corolis

Summary            Marnie Baker

Questions          Marnie Baker, Travis Crouch & Taso Corolis

                                                                2
Overview
Marnie Baker
Managing Director

                    3
FY20 results - overview
                               •   Strong deposit funding and liquidity profile
            Strong financial   •   Reinforced balance sheet: CET1 of 9.25%
            position           •   Well secured lending portfolio
                               •   Resilient business performance

                               •   Supporting our customers and partners
            Purpose            •   Assisting communities
            in action          •   Protecting our employees

                               •   Acceleration of digital engagement

           Strategic           •   Above system growth

           execution           •   Building new capability
                               •   Cost reduction program in place

                                                                                  4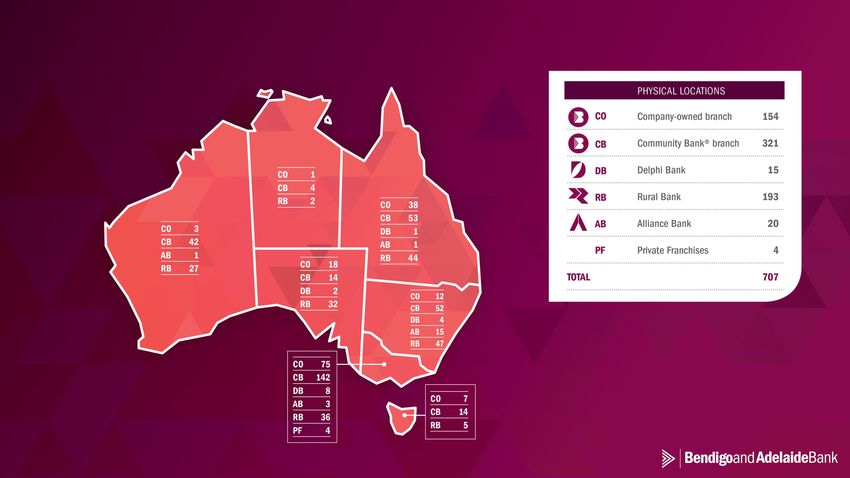
Key measures
    Strong growth with heightened focus on costs

                                                                                                                                                                                                                      -1.0
           Customer
                                                                                       1.88m                                 Net promoter                                                   32.1
                                                                                                                                   3                                         24.8
           numbers                                             1.71m
                                                                                                                             score                                                                    -3.1

                                                               Jun-19                    Jun-20                                                                             Jun-19         Jun-20    Jun-19          Jun-20

                                                                   2.24%       76.18%
           Market                                                                             75.08%                          MFI business                                   48             48
                 1                                                                                                                4
           share                                      2.18%                                                                   NPS                                                                    -22
                                                                                                                                                                                                                     -16

                                                      Jun-19       Jun-20       Jun-19            Jun-20                                                                                            Jun-19          Jun-20
                                                                                                                                                                           Jun-19      Jun-20

                                                                      2.0x
           System lending                                                                                                                                                                                  73.0%

           growth
                  2
                                                        0.3x
                                                                                                                             Employee NPS                                            67.7%
                                                                                   0.6x             0.5x

                                                       FY19        FY20            FY19             FY20                                                                             Jun-19                Jun-20

           Cost to                                                                   62.7%                                   Return on                                            10.73%
                                                            59.2%
           income                                                                                                            tangible equity                                                               7.42%

                                                               FY19                   FY20
                                                                                                                             (cash)                                                  FY19                   FY20

1 APRA Monthly Banking Statistics June 2020, APRA Monthly Banking Statistics June 2019. Market share change calculated on total lending over corresponding 12-month period
2
  APRA Monthly Banking Statistics June 2020. BEN total lending growth rate and major bank average against system
3
  Roy Morgan Net Promoter Score – 6 month rolling averages. Net Promoter, Net Promoter System, Net Promoter Score, NPS and the NPS-related emoticons are registered trademarks of Bain &
Company, Inc., Fred Reichheld and Satmetrix Systems, Inc.
4 DBM Atlas (Business) MFI NPS – Total Business with
FY20 financial result
    Pre-COVID-19 impacts earnings broadly stable
                                                                                                      FY20                     FY19                   FY20 vs                                         FY20 net profit
                                                                                                      ($m)                     ($m)                    FY19
                                                                                                                                                                                                      impacted by1
          Statutory net profit                                                                     $192.8                    $376.8                  (48.8%)
                                                                                                                                                                                                  •    COVID-19 collective
          Cash earnings                                                                            $307.1                    $415.7                  (27.4%)                                           provision overlay of
                                                                                                                                                                                                       $127.7m
          Cash earnings (ex COVID-19 impacts)2                                                     $403.9                    $415.7                   (2.8%)                                      •    Software impairments of
                                                                                                                                                                                                       $121.9m,
          Total income                                                                           $1,614.2                  $1,599.5                     0.9%
                                                                                                                                                                                                  •    Accelerated amortisation
          Cost to income                                                                            62.7%                    59.2%                  +350bps                                            of $19.0m
          Return on tangible equity                                                                 7.42%                   10.73%                  (331bps)                                      •    Restructuring and other
                                                                                                                                                                                                       specific expense items
          CET1                                                                                      9.25%                    8.92%                    +33bps                                           $14.2m

          Net interest margin                                                                       2.33%                    2.36%                     (3bps)
          Cash earnings per share                                                                    59.7c                    85.0c                  (29.8%)
          Dividends per share3                                                                        31c                       70c                  (55.7%)

1
  Pre-tax
2
  Cash earnings (ex COVID-19 impact) reflects cash earnings after tax and removes the notable impacts from COVID-19 (after tax impact of $102.2m). Refer to slide 23 for additional information
3
  FY20 final dividend decision has been deferred
                                                                                                                                                                                                                                  6
Dividends
Balance sheet well positioned

    Balance sheet                                                                    Dividends
    •     Strong customer deposit funding at 75.2% backed by                         •   Whilst economic uncertainty remains and the impact of
          wholesale funding programs                                                     COVID-19 is still evolving, the Board has acted prudently
                                                                                         to defer a final dividend decision
    •     Liquidity profile remains strong with positive call deposit flows
                                                                                     •   Ongoing stress testing supports the strong balance sheet
    •     Conservative COVID-19 provision with a 0.54% coverage
                                                                                         and capital position
          ratio1
                                                                                     •   We continue to adhere to APRA’s industry guidance on
    •     CET1 ratio of 9.25% above APRA’s unquestionably strong
                                                                                         capital management
          benchmark target for standardised banks
                                                                                     •   1H20 interim dividend of 31c declared in February 2020

                                                                            13.61%           68c         68c          70c            70c
                                             12.85%                13.14%
          12.21%                 12.46%
                                                                                             34c         34c          35c            35c
                                                                                                                                            31c

                                                                                             34c         34c          35c            35c    31c
           8.09%                 8.27%           8.62%             8.92%    9.25%
                                                                                             FY16        FY17         FY18           FY19   FY20

           Jun-16                Jun-17          Jun-18            Jun-19   Jun-20                                Interim    Final

                                          CET1     Total capital

1
    as % of GLA – 30 June 2020

                                                                                                                                                     7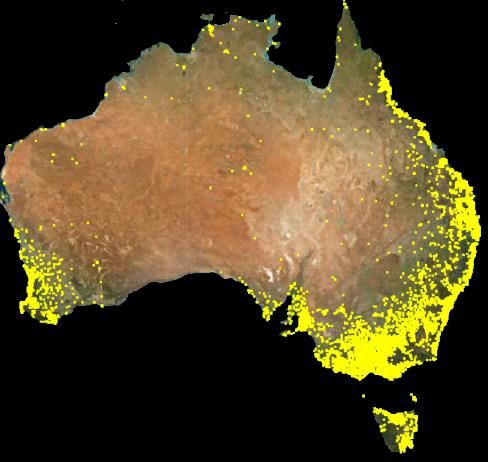
Operating in a COVID-19 environment
Unprecedented economic disruption, requiring decisive and collaborative action

    Economy has severely contracted                                                                                                                               Support measures put in place
    •         First recession in 30 years and largest contraction since 1930                                                                                      •            Government and banks work together to support Australians
    •         Forecast reduction in growth with slow recovery from March ’21                                                                                      •            Largest economic stimulus package in history by Government
    •         Pre-pandemic growth levels not expected to return until at least 2022                                                                               •            RBA cut official cash rate to 0.25% and introduced QE measures
    •         Unemployment expected to peak at 10%                                                                                                                •            Banks providing support to ~10% of their customers

                                                                                                                                            2
    %
                           P      rowth
                                           1                             abour nderutilisation Rates                                                                                                                                                              oans sub ect to 4
                                                               %                                                                                                      %             Australian Cash Rate 3
                              uarterly                                                      eads based                                                                                                                                                          re ayment deferral
                                                                                                                                                                                                                                                        12%
                                                                                                                                                                                                                                                                       hare of total loans
                                                              12
                                                                                                                                                                                                                                                        1 %

    2                                                                                                                                                                                                                                                    %
                                                              9
                                                                                            nderem loyment rate
                                                                                                                                                                                                                                                         %

                                                                                                                                                                      2
                                                                                                                                                                                                                                                         %

                                                                                                                    nem loyment rate                                                                                                                    2%

    2
          1995    2       2   5      2 1       2 15   2 2              1995         2          2    5         2 1           2 15          2 2                         2                                                                                  %
                                                                   ource A    R A                     ull time wor ers on reduced hours fro economic reasons               1995         2     2   5         2 1           2 15           2 2              MAR    APR                MA
        ource A                                                                         and art time wor ers who would li e and are available to wor more hours
                                                                                                                                                                          ource A   A   R A               Calculated using average of year ended weighted
                                                                                                                                                                                                      median inflation and year ended trimmed mean inflation

                                                                                  Strong position leading into COVID-19
                                                                   Committed to supporting our customers, communities and employees
1
  Australian Bureau of Statistics
2
  Australian Bureau of Statistics, Reserve Bank of Australia
3
  Australian Bureau of Statistics, ASX & Reserve Bank of Australia
4
  APRA banking industry data - loan deferrals, June 2020
                                                                                                                                                                                                                                                                                             8
Purposeful in our response to COVID-19
Supporting our customers and employees

    Our customers                                                                    Our employees
    • As at 31 July, a total of 24,365 customer accounts have received 3 - 6 month   • Granted all permanent employees an additional
      payment deferrals with 4,041 accounts having recommenced payment                 10 days of ersonal (sic /carer’s) leave
    • 20,324 customer accounts remain active in deferrals representing:              • Protective screens provided in branches
          $4.6bn of residential and consumer loans ~9% of the portfolio              • Over 90% of our corporate office employees
                                                                                       working from home
          $2.0bn of commercial loans representing ~12% of the portfolio
                                                                                     • Supported our employees to establish working
    • Over 99% of branch network remained open                                         from home protocols
    • 100% ATM availability                                                          • Expanded our wellbeing program to include a
    • 4,666 merchants had terminal fees waived                                         range of webinars, in addition to our 24/7
                                                                                       Employee Assistance Program, available to all
    • Re-positioned the roles of over 200 staff to meet customer demands
                                                                                       employees and their families
    • Business customers all received proactive calls from relationship managers
                                                                                     • Reimbursements for seasonal flu vaccines made
    • Extended 24/7 Employee Assistance Program to customers                           available to all employees
    • Increased resources in our Mortgage Help Team to provide timely support to     • Kept our people critically informed and connected
      our impacted customers                                                           virtually through technology upgrades to support
    • Added more resources to our Financial Assist Support Team (FAST) to              productivity and effective remote working, learning
      support vulnerable customers                                                     and collaboration

                                                                                                                                             9
Purposeful in our response
     Community at our core

                                                             Harden Murrumbeena Community Bank Branch                         Community Contributions
        Community Bank                                       Granted $20,000 towards a stimulus package for local
                                                                                                                              Over $245m in community contributions1 since
        Over 220 Community Banks have                        businesses to apply for assistance due to COVID-19.
                                                                                                                              inception, enabling tangible economic and social
        provided direct financial support in                                                                                  benefits for their communities and our business.
        response to COVID-19 as well as
        engaging in their local communities                  Mt Evelyn & Districts Community Bank
        with the broader community response.                 “We created a $50,000 stimulus program to support              Macedon Ranges
                                                             local organisations recover and start up after the             “We have Director representation on the MRSC Pandemic
                                                             COVID 19 lockdown.”                                            Working Group to ensure a collaborative approach to
                                                                                                                            critical community requirements.”
      Caulfield Park Community
      Bank
      Grants totalling $104,000                         National Bushfire Appeal                                                   Alice Springs Community Bank
      awarded to 25 local community                     Our National Bushfire Disaster Appeal has raised over $46 million          ‘We helped set up a group called Mutual Aid Alice
      organisations providing                           from over 140,000 generous donors to support those in bushfire             Springs. It is a group for sharing local information
      emergency relief and                              affected areas. Many businesses and communities have been hit              and updates around COVID19. It is a network of
      assistance to people impacted                     twice as hard with COVID-19 severely impacting their recovery.             volunteers from a range of services with the
      by Covid-19.                                                                                                                 purpose of ensuring support to the wider
                                                                                                                                   community.’

      Canterbury Surrey Hills Community Bank
      “The Company opened specific Covid-19 grants for up to $5,000 which we approved within the week for those
      in the community in need of support for PPE etc, or other financial assistance. Some examples are; supporting                   Yarra RangesShire
      food purchases for a local organisation providing for those in need in the community as the avenues for                         5 of our Community Banks are working together
      collection of food had disappeared with Covid-19. Supporting aged care providers with iPads for the clients to                  in collaboration with the LGA to facilitate the
      contact loved ones during this time.”                                                                                           local councils grant program.

1   Includes total sponsorships, donations and grants

                                                                                                                                                                                          10
Strategy
Multi-year transformation and growth strategy in action
VISION Australia’s bank of choice
PURPOSE To feed into the prosperity of our customers and communities, not off it
STRATEGY OUTCOMES
Reduce complexity Seamless customer experience
Invest in capability Medium-term reduction in cost base
Tell our story Sustainable growth
11A national bank with distinctive and compelling strengths
Focused on key growth markets
New customers in FY20 Key priority markets Our competitive strengths
and advantages
• Trusted brand
• Service and relationship
• Grounded in purpose
• Embedded in community
Couples, Families,
Millennials • Strong growth prospects
Professionals, Savers
• Partnering capability
• Track record of innovation
860k e-banking users
Small Business,
Agribusiness
Middle-Market
977 face-to-face points of presence1
Share outside major cities 13%
Share of Australia 10%
1
APRA ADI Points of Presence Database; includes Branches and other face-to-face points of presence Index; September 2019
12Executing on our growth and transformation strategy
1 Early action to remove complexity and cost
2 Investing in capacity for growth in existing and new markets
Reducing operational complexity and moving on productivity
3 opportunities
Prioritising growth and transformation opportunities in line with changing
4 customer needs and operating environment
13Executing on our growth and transformation strategy
Early action taken
1 Early action to remove complexity and cost
FY20 actions
• Reduction in businesses and brands • Acquired remaining 50% of Community Sector
Banking joint venture and commenced
• Geography/locations consolidation
optimisation of the operating model
• Product and applications • Net reduction of 17 branches
rationalisation • Introduction of new loan roduct “ endigo
• Restructuring of functions and removal Com lete ome oan” which has removed 95
of layers products from our system
• 12% reduction in technology applications
• Redundancies
• Restructures of Marketing and Technology
divisions
14Executing on our growth and transformation strategy
Investing in growth
2 Investing in capacity for growth in existing and new markets
Existing customers Key growth markets
Millennials, couples, families,
professionals, savers
Customers as Market share $1.8 trillion housing loan market
Millennials
a percentage of total
of population footings 2.2% current market share
Future market
$1 trillion household deposit market
Latent 3% current market share
opportunity
Small business, Agribusiness
middle-market
$70 billion market
$800 billion
market 8.4% current
market share
1.9% current
market share
15Executing on our growth and transformation strategy
Growth in core consumer origination channels
FY20 residential lending settlements - by channel Customer deposit portfolio by channel – June 2020
Retail - branch network 32%
TPB - Mortgage Partners 21% 22%
Branches
TPB - Mortgage Brokers 19% TPB
1%
6% Rural
TPB - Strategic Partners 14% 4% Up
68%
Other
Retail - MRM's 10%
Tic:Toc 4%
Investing for growth:
• Established and deepened partnerships in Third Party Banking
• Increased digital engagement
• Additional mobile lenders and relationship managers and improved lending processing capabilities
• Continued modernisation and optimisation of branch network, including concept branches and network tiering
16Executing on our growth and transformation strategy
Structural and sustainable change
3 Reducing operational complexity and moving on productivity opportunities
• Established a cost transformation program to: Examples:
• Pursue significant cost reductions focusing on
• Optimise front-line productivity through
permanent, structural and sustainable reductions in enhanced scheduling
multi-year annual cost savings that become part of how
we operate • Continue to match positioning of our branch
footprint with customer and community demand
• Pursue cost base reductions that improve the value
proposition and experience for our customers and drive • Simplify our organisation structure to drive
growth economies of scale in repeatable processes and
like functions
• Currently mobilising around three early areas of opportunity:
• Continue to divest non-core businesses
• Productivity
• Optimise procurement spend through demand
• Organisational simplification management and select vendor renegotiation
• Procurement
• Drive digitisation of core value streams e.g.
• Appointed Boston Consulting Group to support us in achieving lending
our medium term cost to income objective
17Delivering on our growth and transformation strategy
Reset operating model for the new world
Prioritising growth and transformation opportunities in line with changing
4 customer needs and operating environment
• Simplified business and operating model with ability to scale
• Ability to anticipate and adapt with speed to changing customer behaviour
• Acceleration of digital engagement and adoption
• Flexible, agile and resilient workforce
• Community and social connection based on trust
• Embracing environmental and social challenges
• Human relationships, automated processes
• Robust risk management systems and frameworks powered by data analytics and insights
18Delivering on our transformation strategy
To support growth, increase operational leverage and maintain a leading customer experience
• Introduced ability to sign documents digitally and identify customers via video
Customer • Collection of digital capability initiatives and products delivered to enable enhanced customer experience through COVID-19
pandemic and beyond
experience • Enhancements in commercial lending to allow faster processing with reduced human input
• Digital logons increased 20% year on year
• Connect and Up Apps features continued to be enhanced and both apps are rated in the Top 4 banking apps in Australia
Digital • Continued investment made in capabilities of Up, including streamlined payments between Up users, improved payment
identifications and COVID-19 related budgeting assistance which helped to drive an increase in Up customer numbers of 140%
• Implemented new data streaming and integration capabilities to deliver real-time data and transition to Cloud
• Reduced the number of technology applications from 684 to 601 (12% reduction) in order to remove duplication, cost and
reduce risk
Simplification • Migrated multiple systems from aged, unsupported infrastructure enabling greater efficiency with significantly less risk
• aunch of ‘Com lete’ ome oan under the endigo brand – removed 95 products from our system
• Digital signature capability implemented to allow for greater automation of document signatures, improving time to lend for
customers and frontline staff
Automation • Significant number of workflows automated to enhance customer experience
• Automation of the scheduled review process for business customers
Regulatory • First deliverable under the Open Banking regime (Providing Product Reference Data in the cloud) was delivered ahead of
schedule. Focus now moves to the delivery of compliance with the obligations under the Consumer Data Right in 2021
change • Continued to enhance data capabilities to mitigate risk
19Delivering on our transformation strategy
FY21 transformation roadmap
• Simplify and then digitise key customer journeys prioritising joining the bank, home,
business and agribusiness lending Outcomes
• Simplify our operating structures and continue to expand our capability around
• Reduced time to decision
operating in an increasingly digital environment
• Reduced cost to serve
• Deliver Open Banking in line with industry timelines and leverage new capability into
new customer offerings • Increased ease to join
• Extend Cloud and API capability and further leverage cloud based applications, • Increased number of and depth
services and platforms of customer relationships
• Continue to reduce the number of products and technology applications we operate to • Reduced number of products
simplify our business and applications
• Leverage our partners capability to accelerate the build out of our key digital channels • Increased use of Cloud and
and offers cloud based applications
• Further consolidation of business models, brands and banking platforms • Increased employee advocacy
• Deliver an enhanced Wellbeing solution with the tools, programs and services to • Increased employee
support the physical, emotional and mental health and safety of our people engagement
• Launch BEN U, our corporate university that supports the modern learner and our • Increased productivity
hiloso hy of ‘learning through rograms through eo le and through ractice’
20FY20 financials
Travis Crouch
Chief Financial Officer
21Financial performance
FY20 FY19 FY20 v 2H20 v
($m) ($m) FY19 2H19
Net interest income $1,346.4 $1,308.0 2.9% 3.2%
Other income $267.8 $291.5 (8.1%) (11.8%)
1
Homesafe $15.7 $14.1 11.3% 24.6%
Operating expenses $1,021.5 $954.5 7.0% 8.9%
Credit $168.5 $50.3 235.0% 485.9%
Cash earnings (after tax) $301.7 $415.7 (27.4%) (56.1%)
2
Cash earnings (ex COVID-19 impact) $403.9 $415.7 (2.8%) (3.9%)
Statutory net profit (after tax) $192.8 $376.8 (48.8%) (72.9%)
Cash EPS 59.7c 85.0c (29.8%) (58.5%)
Note: NII, other income and operating expenses all cash basis before tax
1 Homesafe net realised income before tax
2
Cash earnings (ex COVID-19 impact) reflects cash earnings after tax and removes the notable impacts from COVID-19 (after tax impact of $102.2m)
22COVID-19 impacts
FY20
($m)
Notable COVID-19 impacts on FY20 financials:
• Other income reductions associated with customer Other income $8.8
activity Fee, Commission and FX income
• Direct costs associated with staff safety and welfare
Operating expenses
• Higher leave provisions as our staff responded to
changing work environment and higher customer Staff safety and welfare costs $1.9
demand Staff costs & higher leave provisions $7.6
• Staff levels maintained and reallocated to assist in our
response to supporting customers Credit costs $127.7
AASB 9 Collective Provision overlay
• Collective Provision overlay in accordance with AASB9
Financial Instruments accounting standard
1
Total COVID-19 impact (pre-tax) $146.0
1
Total COVID-19 impact (after-tax) $102.2
1 Table is indicative of notable items related to COVID-19 and does not capture all impacts
23Lending growth profile
Total lending Residential lending Business lending3
+$3.9b
9.4%
12 months1 +$3.5b
5.8% 5.4%
2.9% 2.6%
1.3% -$0.6b
-3.7%
-6.7% Reflects
seasonality
+$2.3b
+$2.7b 10.7%
6 months
2 8.7%
(annualised) 9.7%
7.2%
+$0.3b
3.2% 3.5%
2.6%
-0.5%
1 APRA Monthly Banking Statistics June 2020. Growth rate based on a 12-month period (30/06/19 – 30/06/20)
2 APRA Monthly Banking Statistics June 2020. Data is an annualised growth rate based on a 6-month period (31/12/19 – 30/06/20)
3
Business lending reflects growth rates in non-financial corporations as defined by APRA 24Executing on strategy
Residential lending applications – by month
$3000m
FY20
$2500m
Start of COVID-19
restrictions
$2000m
$1500m
$1000m
$500m
$m
Jul-18 Jan-19 Jul-19 Jan-20 Jul-20
1 Loan applications represent total retail and third party banking mortgages. Excludes Delphi Bank, Alliance Bank and line of credit products
25Residential lending activity
Retail - settlements breakdown Third Party Banking – settlements breakdown
($m)
1 1
($m)
$5,000m
$5,000m
$4,000m $4,000m
$3,000m $3,000m
$2,000m $2,000m
$1,000m $1,000m
$m $m
OO INV Total OO INV Total
1H19 2H19 1H20 2H20 1H19 2H19 1H20 2H20
1 Excludes Delphi Bank, Alliance Bank and line of credit products
26Net interest margin Historical NIM (%)
2.35 2.37 2.37 2.36 2.33
2.29
• FY20 NIM contracted by 3bps to 2.33%
0.40 0.40 0.38 0.36 0.40 0.37
• Ongoing active management of price/volume balance – lending and
term deposits
• Lending portfolio rate continues to drive lower due to mix of growth 1.95 1.97 1.99 1.96 1.96
1.93
and competitive new business rates
• Customer deposit repricing following RBA rate cuts in 2H20
impacted NIM, offset by variable loan repricing 1H19 2H19 1H20 2H20 FY19 FY20
• June 2020 exit NIM of 2.33% BEN Community Bank & Alliance Bank share
NIM impacts 2H20 1H20 2H19
Front book/back book repricing (7bps) (6bps) (6bps) NIM monthly movement
Variable loan repricing 10bps 10bps -
Monthly NIM 3 Month rolling NIM
BBSW priced commercial lending - - (1bp)
2.5
Hedging (3bps) 6bps 3bps
Treasury liquids (1bps) (2bps) (1bps) 2.4
Customer deposit repricing (8bps) (7bps) 3bps 2.3
Wholesale deposits repricing - 1bp 2bps
2.2
Funding mix 3bps 2bps 1bp
Equity contribution (2bps) (3bps) 1bp 2.1
1
Impact on adoption of AASB 16 - (1bp) - 2.0
Dec 16 Jun 17 Dec 17 Jun 18 Dec 18 Jun 19 Dec 19 Jun-20
Total (8bps) - 2bps
1
On 1 uly 2 19 the rou a lied AA 1 eases which has resulted in interest ex ense associated with the rou ’s leases being recorded through NII
27Income
FY20 FY19 FY20 vs 2H20 vs 2H20 vs
($m) ($m) FY19 1H20 2H19
• Strong loan growth in 2H20 offset by margin compression
• COVID-19 pandemic reducing 2H20 income Net interest income $1,346.4 $1,308.0 2.9% (0.9%) 3.2%
• Fee income – reduction of $5.9m
Fee income $155.5 $163.8 (5.1%) (3.9%) (3.5%)
• Commissions – reduction of $0.7M
• FX income – reduction of $2.2M Commissions $56.6 $73.5 (23.0%) (6.2%) (24.3%)
• Commission income lower following the sale of Bendigo
Financial Planning in June 2019, impacting FY20 by $11.1m FX income $22.6 $22.4 0.9% (17.7%) (8.9%)
• Foreign Exchange income growth driven by new Consumer
product and increased engagement with Business customers, Trading book income $11.2 $12.2 (8.2%) 33.3% (40.2%)
however impacted in 2H20 due to significant reduction in
overseas travel Other $21.9 $19.6 11.7% (26.2%) (5.1%)
• Government Services income continues to contribute to
Other income $267.8 $291.5 (8.1%) (6.4%) (11.8%)
growth in Other income
• Other income fell in 2H20 vs 1H20 due to timing of franchise Homesafe
1
$15.7 $14.1 11.3% 21.1% 24.6%
and training fees associated with the Community Bank model
Total Income
$1,629.9 $1,613.6 1.0% (1.7%) 0.6%
(ex specific items)
Note: Other income breakdown is prepared on a cash basis and excludes Homesafe revaluation ($36.0m) and revaluation gains on economic hedges (-$3.2m). Bendigo Financial Planning
contributed $11.6m to commission in FY19 (1H19 = $6.2m, 2H19 = $5.4m), $0.5m in FY20 (1H20 = $0.48m, 2H20 = $0.03m)
1
Homesafe net realised income before tax
28Operating expenses
• Excluding accelerated investment in technology spend,
operating expenses were up 1.5% for FY20 FY20 FY19 FY20 vs 2H20 vs 2H20 vs
($m) ($m) FY19 1H20 2H19
• Increase in staff costs has enabled execution of strategy
• Higher costs due to COVID-19 Staff costs $567.1 $518.5 9.4% 7.3% 11.7%
• Direct cost impacts $1.9m
Occupancy, property, plant
• Higher staff costs and leave provisions $7.6m and equipment
$100.7 $101.9 (1.2%) (0.2%) (0.2%)
• Accelerated investment in technology of $52.4m in FY20 drove
increase in operating expenses, one-third relating to regulatory IT costs $70.9 $74.9 (5.3%) 12.9% (4.1%)
projects
Amortisation of software
$31.1 $33.8 (8.0%) (10.4%) (17.4%)
• Other expenses includes remediation totalling $7.4m relating to intangibles
products not operating in accordance with terms and conditions
Fees and commissions $20.3 $31.1 (34.7%) (2.9%) (27.5%)
and compliance with the Code of Banking Practice 2013
Communications, advertising
$67.4 $66.7 1.0% 3.6% 1.8%
and promotion
Cost to income - YoY
Other $164.0 $127.6 28.5% 33.0% 29.1%
62.7 Total OPEX $1,021.5 $954.5 7.0% 9.6% 8.9%
59.2
FY19 FY20
Note: In FY19, Bendigo Financial Planning contributed to staff costs ($12.9m), IT costs ($0.8m), fees and commissions ($1.3m) and other ($11.5m, $7.9m of which is remediation). Cost related to fund
ongoing wealth concierge function through FY20 is $0.7m
29Staff costs – investment
• Investment in staff to support execution of growth strategy and support organisational priorities:
• Residential lending growth - business development managers and processing staff to deliver above systems growth
• Risk and Compliance - ensuring risk capabilities continue to support future needs, including greater investment in Financial Crime
capabilities
• People and Culture - increased investment in organisational recruitment, change management and capability
• Technology and transformation - expanded leadership team to lead organisational change initiatives
• Agribusiness - supporting growth in income from Government Services and full year impact of onboarding of Elders staff in FY19
• Increased personal leave provisions and reduced leave taken impacts staff costs
• Other includes additional business days in FY20 and impact of Community Sector Banking acquisition
+9.4%
13.6 (23.4)
9.5
48.9 567.1
518.5
Staff costs - FY19 Investment in staff Leave provisions Other Salary savings from Total staff costs - FY20
redundancies
30Consumer division
• Strong growth in residential mortgages of $3.1bn, following
investment in Third Party distribution and processing capacity FY20 FY19 FY20 v 2H20 vs 2H20 vs
($m) ($m) FY19 1H20 2H19
• Post initial COVID-19 shock, strong volume recovery in both
residential lending and deposits Net interest income $868.8 $844.3 2.9% (0.2%) 3.1%
• $3.9bn growth in call deposits, allowing active management of
more expensive term deposit funding Other income $188.8 $212.8 (11.3%) (12.0%) (14.4%)
• Net interest income increase, despite margin compression Operating expenses $477.5 $489.2 (2.4%) 4.3% (5.3%)
• Other income continued to decline reflecting changing Credit expenses ($3.9) $18.7 (120.9%) 775.0% (126.9)
customer behaviour, competitive dynamics, COVID-19 impact
and sale of Bendigo Financial Planning
Tax $190.2 $174.4 9.1% 1.9% 17.8%
• Decline in operating expenses through active cost
Cash earnings before
management and the sale of Bendigo Financial Planning Homesafe
$393.8 $374.8 5.1% (10.4%) 7.9%
• Net branch network reduction of 17 branches however Homesafe net realised
$11.0 $9.9 11.1% 20.0% 25.0%
continued investment in experience stores and mobile income1
relationship managers
Cash earnings $404.8 $384.7 5.2% (9.7%) 8.3%
• Release of collective provision from lower credit risk profile of
mortgage lending (COVID-19 overlay is held centrally)
Note: P&L prepared on cash basis, excludes allocated costs. Bendigo Financial Planning contributed $11.6m to commission in FY19 (1H19 = $6.2m, 2H19 = $5.4m), $0.5m in FY20
(1H20 = $0.48m, 2H20 = $0.03m)
1 Homesafe net realised income after tax
31Business division
• Lower NII reflects a contraction in lending portfolio through 1H20, FY20 FY19 FY20 v 2H20 vs 2H20 vs
($m) ($m) FY19 1H20 2H19
a modest reduction in asset margins and lower contribution from
business deposit channels
Net interest income $288.1 $295.8 (2.6%) (3.2%) (2.4%)
• Business division asset portfolios grew in 2H20, representing the
first half of positive growth since FY17. This included a positive
contribution from the commercial property lending portfolio Other income $42.9 $45.3 (5.3%) (9.3%) (7.7%)
following the rebalancing of this portfolio to within targeted risk
appetite settings
Operating expenses $94.6 $88.7 6.7% 6.1% 15.4%
• Other income was impacted by COVID-19, which materially
impacted activity levels. Most significantly this resulted in lower
foreign exchange activity through reduced international travel Credit expenses1 $35.0 $32.5 7.7% (2.3%) 26.3%
• Higher operating expenses reflects staff costs associated with
investment in risk and support roles, plus the consolidation of the Tax $65.1 $69.8 (6.7%) (2.4%) (9.6%)
Community Sector Banking business
• Credit expenses increased due mainly to the write-off of long- Cash earnings $136.3 $150.1 (9.2%) (11.6%) (15.7%)
dated impaired assets.
Note: P&L prepared on cash basis, excludes allocated expenses
1 Credit expenses included Great Southern
32Agribusiness division
FY20 FY19 FY20 v 2H20 vs 2H20 vs
($m) ($m) FY19 1H20 2H19
• Growth in loan book combined with strong margin management
contributed to improvement in net interest income
Net interest income $155.4 $136.3 14.0% (0.3%) 13.5%
• Other income increase mainly due to higher revenue from
Government Services division
Other income $18.3 $15.2 20.4% 28.8% 39.2%
• Lower operating expenses reflect the full year benefits of new
distribution agreement with Elders, and business simplification
following the hand bac of Rural an ’s stand-alone ADI Operating expenses $62.9 $65.5 (4.0%) 6.2% (3.6%)
• Increased credit expenses reflect return to long-term average
after one-off collective provision benefits in FY19, and include Credit expenses $6.1 ($2.5) 344.0% (15.2%) 47.4%
moderate increase in specific provisions related to drought
Tax $34.1 $28.1 21.4% 9.2% 38.0%
Cash earnings $70.6 $60.4 16.9% (2.2%) 27.4%
Note: P&L prepared on cash basis, excludes allocated expenses
33Homesafe investment property portfolio
• Proceeds on contracts completed during 2H20 exceeded carrying
value by $1.9m Homesafe portfolio & funding balance ($m)
• Average annual return on completed contracts since inception is 734.5
779.8
9.8% p.a, pre funding costs
• Following strong property appreciation in 1H20, 2H20 was impacted 452.3 485.6
by lower growth in the Residex index and a change to the growth
outlook as a result of COVID-19
• Portfolio valuation reviewed and growth outlook changed to -4% year
1, +3% year 2 and +4% year 3+ Jun-08 Jun-10 Jun-12 Jun-14 Jun-16 Jun-18 Jun-20
• Portfolio distributed between Melbourne (61%) and Sydney (39%) Portfolio balance Funding balance
• Property values would need to fall by a further 38% before any impact
on regulatory capital
Realised - income vs funding costs ($m)
13.4 13.5
12.7 $11.7 $11.4 $23.1 $22.4
11.5
10.7 10.2 10.6 10.8
$1.9 $1.3 $3.2 $0.5
($16.4) $26.1 $9.7 ($47.0)
4.6 4.5 4.4 4.1
3.6 3.4 3.9
3.0
1H17 2H17 1H18 2H18 1H19 2H19 1H20 2H20 ($2.8) $38.8 $36.0 ($24.1)
Realised income Realised funding costs
34Bad and doubtful debts
2H20 1H20 2H19 1H19
• FY20 BDD charge excluding COVID-19 overlay was 8bps of gross ($m) ($m) ($m) ($m)
loans, with COVID-19 collective provision overlay contributing a
Consumer division ($3.5) ($0.4) $13.0 $5.7
further 18bps (total 26bps of GLA)
• COVID-19 collective provision overlay reviewed at 30 June 2020, Business division $16.3 $17.8 $10.4 $9.1
but total provision unchanged from 28 May 2020 ASX release
Agribusiness division $2.8 $3.3 $1.9 ($4.4)
• A number of large loans were resolved during 2H20 reducing
Great Southern $1.0 ($0.1) $3.3 $9.8
specific provisions and total impaired assets
Corporate (includes COVID-19 overlay) $128.7 $2.6 ($3.8) $5.3
Total $145.3 $23.2 $24.8 $25.5
Total impaired assets ($m)
Provisions for doubtful debts ($m)1 Includes
428.2 $148.3m
379.9 COVID-19
362.8 352.6 78.4
335.8 346.0
307.7
125.4 310.9 315.5
128.5 131.2
119.3
263.2 240.5
48.2 181.5 157.0 147.2
140.2
73.0 77.3 74.2 86.6
Jun-18 Dec-18 Jun-19 Dec-19 Jun-20
Jun-18 Dec-18 Jun-19 Dec-19 Jun-20
General Collective Specific
1 AASB9 was adopted from 1 July 2018 (prior periods are not required to be restated)
35Arrears
Arrears collection activities
1
temporarily suspended with Commercial loan arrears
Residential loan arrears resources redirected to
assist customers
$8.5b
1.6% 4.0%
1.2% 3.0%
$6.5b
2.0%
0.8%
1.0%
0.4%
0.0% $4.5b
0.0% Jun-18 Dec-18 Jun-19 Dec-19 Jun-20
Jun-18 Dec-18 Jun-19 Dec-19 Jun-20
Portfolio (RHS) Bus 90d+ Bus 90d+ (inc. arrangements)
Res 90d+ (inc. arrangements) Res 90d+
Consumer loan arrears2 Rise in arrears reflects
seasonality Agribusiness loan arrears
1.6%
3.0%
1.2%
0.8% 2.0%
0.4% 1.0%
0.0%
Jun-18 Dec-18 Jun-19 Dec-19 Jun-20 0.0%
CC 90d+ PL 90d+ Jun-18 Dec-18 Jun-19 Dec-19 Jun-20
PL 90d+ (inc. arrangements) CC 90d+ (inc. arrangements)
Agri 90d+ (inc. arrangements)
Note: Solid line in graphs reflects arrears including impaired over 90d+ and excludes arrangements while the dotted line reflects arrears including impaired assets and all arrangements
1 October 19 includes correction in arrears reporting
2 Consumer loan arrears reflects credit card portfolio and personal loan portfolio
36Funding mix
• Funding mix continues to be a strength, allowing flexibility to Funding profile (%)
fund asset growth and manage margin
5.4 5.9 5.2
• Despite RBA cash rate reductions, group call deposit portfolio 19.6 19.7 19.6
has increased ~$3.0b during 2H20, replacing higher cost term
deposits 37.2 34.7 31.6
Customer
• Retail term deposit average retention rate of ~90% through Deposits
FY20 reflecting continued strength in volatile environment 39.7 43.6 75.2%
37.8
• Wholesale domestic issuance continues to provide a reliable
source of funding, and will be used in the future to differentiate Jun-19 Dec-19 Jun-20
and lengthen E ’s maturity rofile Customer - call Customer - term deposits Wholesale Securitisation
• Average LCR through 2H20 of ~139%
Customer call deposit funding costs
• Average NSFR through 2H20 of ~116%
1 9%
Total deposits – 12 month growth 10% ≤ . 1%
28%
38% > 0.01% - ≤ .25%
11.8% 25%
Dec-19 Jun-20
41% > 0.25% - ≤ 1.5 %
5.5% 22%
> 1.50%
27%
BEN System
1 APRA Monthly Banking Statistics June 2020. Growth rate based on a 12-month period (30/06/19 – 30/06/20)
37Capital
• Balance Sheet Strength Total capital & CET1 - historical (%)
• 33bps increase in CET1 since June 2019 to 9.25%
13.14% 13.61%
• Target CET1 range of 9.0% – 9.5% remains and will be 12.21% 12.46% 12.85%
reviewed after APRA finalises its review of the capital adequacy
8.62% 8.92% 9.25%
framework 8.09% 8.27%
• Successfully completed a $250m institutional placement in February
2020 and $44.8m in a Share Purchase Plan in March 2020
• Internal stress testing completed sees capital ratios maintained Jun-16 Jun-17 Jun-18 Jun-19 Jun-20
above APRA's unquestionably strong minimums CET1 Total capital
• BEN is considering offering a new ASX listed Additional Tier 1
capital security in 1H21 alongside the potential repayment of its
Convertible Preference Shares 2 (CPS2) subject to market
conditions1
2
CET1 movement - 12 months (%)
1.03 (0.34)
(0.40)
(0.14) (0.07)
0.78
(0.38)
(0.15)
9.25
8.92
Jun-19 FY19 Dividend (net AASB16 Impact Capital Raise Earnings 1H20 Dividend (net COVID Provisioning RWA Other Jun-20
of DRP) of DRP) Overlay
1 Any offer or repayment remains subject to market conditions and all relevant approvals being obtained. Any offer of ASX-listed Additional Tier 1 capital securities by BEN will be made under a
prospectus. If an offer is made, eligible applicants wishing to apply will need to do so in accordance with the instructions set out in the prospectus
2
Unrealised Homesafe revaluation revenue has been excluded from increases in retained earnings 38COVID-19 impacts
Taso Corolis
Chief Risk Officer
39Action taken to support our customers and end of deferral
arrangements
Repayment deferrals through COVID-19
In response to customer needs we: ~8% reduction
from peak
• Doubled our staff numbers providing assistance to our consumer
customers 13,641 13,521
• Substantially increased the mobility and portability of staff through 12,840
12,493 31 July
targeted training
Residential $4.2b
• Built self-help tools for our customers
• Deployed alternative contact methods for customer contact Consumer $0.4b
• Contacted all our relationship managed business customers to Commercial $2.0b
provide assistance1 Total $6.6b
~1% increase
Currently, and in preparation for the end of the deferral period, we are: ~13% reduction from May
• Proactively contacting consumer customers via a combination of from peak
4,638 4,631 4,707
contact approaches (digital, web-based, calls) 4,144
• Undertaking further direct contact with business customers 3,427 3,608 3,469
3,124
• Increasing resourcing and building capacity to enable us to scale up
further if required
Residential Consumer Commercial
April May June July
1
Excluding our agribusiness customers as the impact has been relatively small withSupporting our customers through COVID-19 (as at 30 June)
Residential lending % of total deferrals - by state
Total accounts assisted 23,534
Total balance assisted $7.4b
Accounts active 21,621
18%
Balance active $6.9b 11% 7%
Residential & consumer support packages Commercial support packages 22%
1
(active) (active)
40%
Accounts 16,990 Accounts 4,631
2%
Loan value $4.9b Loan value $2.0b
Commercial lending % of total deferrals - by state1
% of total portfolio (#) ~5% % of total portfolio (#) ~8%
% of total portfolio ($) ~10% % of total portfolio ($) ~12%
% of consumer loans 18%
2 ~8%
($) 5% 11%
Residential support packages – product and payment split 12%
69% - OO 31% - Inv 52%
79% - P&I 21% - IO 2%
1
Commercial lending includes Agribusiness loans
2
Includes personal loans and credit cards
41COVID-19 in Victoria – detail (as at 30 June)
Accounts active 9,020
Balance active $3.0b
Metropolitan Victoria Regional Victoria
Residential & consumer support Residential & consumer support
Commercial support packages (active)
1
Commercial support packages (active)1
packages (active) packages (active)
Accounts 3,552 Accounts 887 Accounts 3,000 Accounts 1,581
Loan value $1.3b Loan value $0.6b Loan value $0.7b Loan value $0.4b
% of Victoria portfolio (#) ~2% % of Victoria portfolio (#) ~7% % of Victoria portfolio (#) ~2% % of Victoria portfolio (#) ~5%
% of Victoria portfolio ($) ~7% % of Victoria portfolio ($) ~3% % of Victoria portfolio ($) ~4% % of Victoria portfolio ($) ~5%
% of consumer loans ($)3 ~7% % of consumer loans ($)3 ~8%
2 2
Residential support packages - by LVR Residential support packages - product and Residential support packages - by LVR
Residential support packages - product and
payment split payment split
3% 2%
7% 8% 0%-40%
0%-40%
41% 39%
41%-60% 41%-60%
70% - OO 30% - Inv 23% 75%- OO 25% - Inv
25%
61%-80% 61%-80%
81%-90% 81%-90%
74% - P&I 26% - IO 26% 83% - P&I 17% - IO 26%
91%-100% 91%-100%
Note: Geographies based on the ABS Australian Statistical Geography Standard (ASGS 2016)
1 Commercial lending includes Agribusiness loans
2
LVR reflects current balance divided by valuation at date of origination
3
Includes personal loans and credit cards 421
Residential lending - COVID-19
% exposures by payments in advance
2 % exposures by payments in advance
(including offset balances) 2
Prepayment buffers have strengthened 33% >3 months (including offset balances) Victoria
Prepayment buffers in Victoria 35% >3 months
40
28% 29%
18% 20% 18% 18%
20
10% 10% 11% 10%
8% 8%
6% 5%
-
No buffer < 1 month < 3 months < 6 months 2 years No Buffer < 1 month < 3 months < 6 months 2 years
VIC Total
Mar-20 Apr-20 May-20 Jun-20
% exposures exited deferral by payments in Residential lending by security state
advance COVID-19 (% EAD) vs exit (% COVID-19 EAD)
Geographic distribution of customers exiting deferrals is relatively even
(including offset balances)2
Customers exited deferrals have been greatest in1
Residential lending - COVID-19
% exposure dynamic LVR Band - Victoria vs % exposures residential security type
total2
>80% with LMI:
58.7% VIC: 58.7% 86%
Total: 51.6%
46.1%
35.8% 37.8%
4.4% 14%
9.7% 1.1% 6.3%Supporting our customers through COVID-19 (as at 30 June)
Total commercial portfolio vs commercial support packages - by industry ($m)
6,337.1
3,333.9
1,715.2
844.4
640.1
479.6
390.4 353.2 339.9
234.7 235.3 228.4 194.3
132.1 120.1 109.0 107.0 142.3 137.0
58.0 65.8 75.7 58.0 50.8 84.7
26.4
Agriculture, Rental, hiring and Financial and Construction Health care and Retail trade Accommodation Other Services Manufacturing Professional, Transport, postal Wholesale trade Other1
forestry and real estate insurance social assistance and food services scientific and and warehousing
fishing services services technical services
Total portfolio Commercial support packages
1
Other includes eight categories: public administration and safety; administrative and support services; electricity, gas, water and waste services; mining; arts and recreation services; education and
training; information, media and telecommunications; other
451
Commercial lending - COVID-19
Length of customer relationship
Current LVR band Victoria vs total COVID-19 (% COVID-19 (% EAD)2
EAD) Significant weight to long term customer relationships
50.3% 51.5% Less than 1 year 5.0%
>100: 4.1%
Unsecured: 5.5%
1 to 2 years 8.8%
30.9% 32.4% 2 to 3 years 7.3%
3 to 5 years 19.5%
12.6% 5 to 10 years 29.7%
6.3% 6.5% 9.6%
Greater than 10
years 29.8%COVID-19 collective provision and GRCL adjustments
Total collective provisions and GRCL Total provision coverage ratio
($m) (Collective and GRCL)
1.02%
349.8
20.6 0.67%
0.59%
0.54%
0.38% 0.35%
$148.3m
127.7
234.3
221.4
Jun 2019 Dec 2019 Jun 2020
77.3 as % of Credit RWA as % of Gross loans
74.2
66.0
Total
Lending Coverage
As at 30 June 2020 Credit
Balances Ratio
Provisions
157.0 147.2 Residential lending $46,943.9 $149.5 0.32%
135.5
1
Commercial lending $15,043.0 $154.4 1.03%
Jun 2019 Dec 2019 Jun 2020 Consumer lending $3,334.8 $45.9 1.38%
Collective GRCL Collective - COVID-19 overlay GRCL - COVID-19 overlay Total $65,321.7 $349.8 0.54%
1
Commercial lending includes Agribusiness loans
47Summary
Marnie Baker
Managing Director
48Closing comments
• Expect market conditions to remain challenging
• Commitment to growth and transformation strategy remains
• Increased intensity on cost reduction program
• Flexibility around accelerated investment program spend to align with revenue growth
• Continue to target a sustainable cost to income ratio towards 50% in the medium term starting
with a return to positive JAWS in FY21
• Adapt to the environment while staying true to our purpose
• Remain committed to supporting our customers, communities & employees throughout
COVID-19
• Play our part in the economic recovery through provision of credit to the system
• Strong and resilient balance sheet remains a key priority
49Questions
50Appendix
51Appendix index
Section Page Number
Climate change strategy 53
Executive team

                 54
Awards 55
Physical presence 56
Changing customer preferences 57
Community Bank model 58
Up 59
Tic:Toc 60
COVID-19 economic outlook & scenario weightings 61-62
Residential portfolio 63-65
Residential portfolio – COVID-19 66
Deposit profile and credit card utilisation 67
Business division segments 68
Agribusiness portfolio 69
Provision coverage 70
Funding and liquidity 71
Capital 72
Great Southern 73
Statutory earnings reconciliation 74
52Climate Change strategy
Strategy and three-year Climate Change Action Plan commenced June 2020
Our Climate Action Focus Areas
“Bendigo and Adelaide Bank recognises climate change has far-
reaching risks for the environment, the economy, society, our Reduce our footprint: We will reduce the carbon and environmental
customers and their communities. We support the Paris Agreement footprint of our own operations
objectives and the required transition to a low carbon economy. We
are committed to playing our part in this transition. We will work to Support our customers: We will support our customers and
build climate mitigation and adaption into our business and work to communities by taking actions required to mitigate, adapt and respond to
climate change.
assist our customers and their communities to build climate
resilience into their futures.”
Understand and manage the risks: We will optimise our climate
change risk governance and risk management framework.
Building on our 2010 Statement of Commitment to the Environment, this policy
statement and action plan will be reviewed annually as we continue to evolve our
approach and as science, technology and policy develop further.
Be transparent: We will disclose our climate-related performance.
Our Climate Change Action Strategy will progress the actions we have already taken. For more than a decade, we have
instigated initiatives to reduce the an ’s foot rint and develo ed solutions that su ort our customers’ ambitions. This has
roduced results we’re roud of including
• Reducing our own carbon emissions by a third in the past five years.
• More than 113,500 trees have been planted with our partner Greenfleet to offset our travel emissions.
• Supporting our customers to reduce their own emissions from our first Green Home Loan in 2002 through to our award winning Gr een Personal Loan today.
• Supporting our communities by financing of community renewable projects such as Hepburn Wind which featured on A C’s Fight for Planet A in August 2020 and
Warburton Hydro.
53Executive team
54We are well placed
55Physical locations
56Changing customer preferences
Customer preferred card usage
100%
E-banking platform usage
90%
Up 9.1% through FY20
80%
with 18.7% more logons
70%
60%
50%
Historic transactions trends
40%
60
Millions
30% 50
40
20% 30
20
10%
10
0% 0
2015Q4 2016Q2 2016Q4 2017Q2 2017Q4 2018Q2 2018Q4 2019Q2 2019Q4 2020Q2 2015Q4 2016Q2 2016Q4 2017Q2 2017Q4 2018Q2 2018Q4 2019Q2 2019Q4 2020Q2
Magnetic Stripe Read Online - card-on-file Online - entered details Credit Debit
EMV Chip Contactless Apple/Google Pay
1 Change in person card usage against 2020Q1 reflects partial impact of COVID-19 pandemic on methods of transactions
57The Community Bank model
Community Bank footings ($bn)
• Community ban ing is based on a ‘ rofit with ur ose’
model, which means profits are returned directly to the
community which has generated them 21.0 22.2 23.2
20.0
18.3
• Over $245m in community contributions1 since inception,
enabling tangible economic and social benefits for the
communities and our business 14.8 16.0 16.7 17.0 17.7
• Significant matched funding leveraged by community
Jun-16 Jun-17 Jun-18 Jun-19 Jun-20
partners for major local infrastructure initiatives
Loans Deposits
• 321 Community Bank branches, of which over 20% are
the last financial institution in the town or suburb Total investment by theme
• Proven, reliable and cost effective distribution strategy
9.3%
• Community Bank branches are a significant source of
stable customer deposits for the broader Group
• Compelling and significant engagement across 56.4% 34.3%
communities with 75,000+ Community Bank
shareholders and 1,950+ directors
• One of the largest social enterprise movements globally
Donations Grants Sponsorships
1 Includes total sponsorships, donations and grants
2 Community Bank footing includes Private Franchises (4 branches in total)
58Australia’s first and largest mobile-only digital bank
designed and delivered in partnership with Ferocia
Through a design and technology-led banking approach, Up reconnects people with their
finances, taking them from a place where money is a cause of stress and anxiety to a happier
place where they feel empowered and in control of their money.
Leading the neobank movement Engaged customers driving growth Financial literacy for the next generation
800 70
4.9 Highest rated banking app in Australia Accounts, '000s (LHS) 50% of customers aged 16 to 25
700 60
App Store and Google Play, Jun-2020 Transactions, millions (RHS)
600 50 Over $500m in current deposits
500 +245% year on year growth
40
#1 Neobank (DBM) 400
+ Everyday & Savings Bank of the Year (Mozo) 30
+ Best Everyday & Savings Account (Rate City) 300 Customers have over 330,000 savings goals
20
200
100 10 Planned payments for 85k+ upcoming bills
Fast growing, now 250,000+ customers with over 130,000 merchants identified by Up
+140% year-on-year growth, over 90% new-to-bank Jun-18 Dec-18 Jun-19 Dec-19 Jun-20
Relentless pace of innovation Over 45% of active customers deposit $1k+
Many unique features released during 1H CY20 per month
over consecutive months
Active customers averaged 26 purchases
(in Jun-20)
40%+ of growth from Hook-Up-A-Mate
’s in-app customer referral program
5959Tic:Toc – approvals & settlements v portfolio
$120.0 $900.0
Millions
Millions
Tic:Toc Home Loans
Strong portfolio growth, reflecting product, experience and $80.0 $600.0
acquisition optimisation and the shift in customer
behaviour to digital.
• More than $1.22bn in approved value (125% increase $40.0 $300.0
YOY)
• ~$850m in settled value (128% increase YOY), with an
awaiting settlement pipeline of over $110m $- $-
Jun-17 Dec-17 Jun-18 Dec-18 Jun-19 Dec-19 Jun-20
Approval (LHS) Settlement (LHS) Portfolio (RHS)
Enterprise solutions solving for:
Tic:Toc Enterprise Credit
Driving shareholder value through market penetration Customer Cost quality & Leading
process technologies
of technology, and capitalising on the Open Banking experience out assurance
opportunity.
• Tic Toc’s first aa roduct AI Validate launched
• Home loan contract • Managed a ~$40m uplift in • ASIC Commissioner • PaaS, SaaS & API
• illion reseller agreement signed delivered within 58 mins approval volume in June 20 Hughes mentions Tic:Toc • Enabling for Open
• 1st SaaS customers, signed from customer starting to ~$100m with no change as an example of how Banking and OCR
application in operational staff (15) technology can enable
• 2nd Major PaaS signed better adherence to • Data provider agnostic
• 66% customers choose • Automation levels enable
RG209 • Enabling for CCR, KYC
digital financial validation loan fulfillment with as little
asCOVID-19 economic outlook
Unemployment (%) House prices and commercial property prices
1
16.0% (%)
14.0% 5.0%
12.0%
0.0%
10.0%
8.0%
-5.0%
6.0%
4.0% -10.0%
Dec-19 Jun-20 Dec-20 Jun-21 Dec-21 Jun-22 Dec-22
Base scenario Significant deterioration -15.0%
-20.0%
Gross Domestic Product (%)
5.0% -25.0%
0.0%
-30.0%
-5.0%
-35.0%
Dec-19 Jun-20 Dec-20 Jun-21 Dec-21 Jun-22 Dec-22
-10.0%
Base scenario - House prices
-15.0% Base scenario - Commercial property prices
Dec-19 Jun-20 Dec-20 Jun-21 Dec-21 Jun-22 Dec-22
Significant deterioration - House prices
Base scenario Significant deterioration Significant deterioration - Commercial property prices
1
House prices and commercial property prices are cumulative from Dec-19
61COVID-19 scenario weightings & sector overlays
Economic outlook - scenario weights $75.2m
Business and consumer portfolio overlays $52.5m More exposed industries - % of GLA3
0.05%
0.08%
Scenario weightings
0.11%
June 2020 5% 30% 50% 15% 0%
0.21%
Information media and
Dec 2019 1% 22% 53% 22% 1% telecommunications
Education and training
Significant deterioration Mild deterioration Base scenario
0.54% Arts and recreation
Mild improvement Significant improvement services
Wholesale trade
1
Collective provision - scenarios outcomes ($m)
Accommodation and food
services
Retail trade
355.6 270.6
258.1 52.5
199.6 218.1 218.1
0.60%
100% base Probability 100% mild 100% significant Probability
scenario weighted deterioration deterioration weighted -
collective provision
Scenario - ECL (ex COVID-19 overlays) COVID-19 Overlays
1
Excludes GRCL
2
Includes business and consumer portfolio overlays
3
Informed by external industry data
62Residential lending portfolio
Retail - portfolio ($b)1
Exposure by state
23.5
23.1
22.8
22.4
22.3
21.7
21.2
15%
Jun-17 Dec-17 Jun-18 Dec-18 Jun-19 Dec-19 Jun-20
9% 10%
1
TPB - portfolio ($b)
19.9
26%
18.0
16.8
38%
16.3
16.1
15.6 15.8
Jun-17 Dec-17 Jun-18 Dec-18 Jun-19 Dec-19 Jun-20
2%
1 Loan portfolio constructed from internal data and includes line of credit products. Excludes Delphi, Alliance Bank and Portfolio Funding
63Residential lending portfolio – total exposure
Retail lending - purpose (%) Retail lending - payment type (%)
19.4% 18.4% 17.3% 15.9% 15.1%
34.5% 32.7% 32.8% 33.0% 32.8%
68.1% 69.8% 71.4% 73.1% 74.6%
65.5% 67.3% 67.2% 67.0% 67.2%
12.5% 11.8% 11.3% 11.0% 10.2%
Jun-17 Dec-18 Jun-19 Dec-19 Jun-20 Jun-18 Dec-18 Jun-19 Dec-19 Jun-20
Owner Occupied Residential Investment Line of Credit Principal and Interest Interest Only
TPB lending - purpose (%) TPB lending - payment type (%)
29.2% 25.6% 23.1%
40.2% 36.7% 32.4%
42.3% 42.7% 42.8% 41.6%
64.3% 67.9% 72.0% 75.0%
58.4% 59.8% 59.5%
57.7% 57.3% 57.2%
3.8% 3.2% 2.9% 2.4% 2.0%
Jun-18 Dec-18 Jun-19 Dec-19 Jun-20 Jun-18 Dec-18 Jun-19 Dec-19 Jun-20
Owner Occupied Residential Investment Line of Credit Principal and Interest Interest Only
Note: Excludes Delphi, Alliance Bank and Portfolio Funding
64Residential lending portfolio key metrics
1
Home Loans 90+ days past due - by state Residential portfolio and settlement metrics
3
Jun-20 Dec-19
3.0%
Retail mortgages 54% 56%
Third Party mortgages 46% 44%
2.0%
Lo Doc 1% 1%
1.0% Owner occupied 64% 63%
Owner occupied P&I 90% 89%
0.0% Owner occupied I/O 10% 11%
VIC NSW/ACT QLD WA TAS SA/NT Portfolio
Investment 36% 37%
Jun-18 Dec-18 Jun-19 Dec-19 Jun-20
Investment P&I 54% 52%
2 Investment I/O 46% 48%
Residential loan-to-value profile Mortgages with LMI 19% 20%
82% of ortfolio with VR ≤ %
Average LVR (at origination) 57% 57%
40.0% Average loan balance $250k $243k
90+ days past due - exc arrangements 0.4% 0.4%
Impaired loans 0.10% 0.11%
20.0%
Specific provisions 0.03% 0.03%
Loss rate 0.01% 0.01%
0.0%
0% - 60% 60%-80% 80%-90% 90%+ Variable 74% 77%
Jun-18 Dec-18 Jun-19 Dec-19 Jun-20 Fixed 26% 23%
1 Keystart included from Jun-17, excludes Delphi Bank. Arrears includes impaired over 90d+ and excludes arrangements
2 Breakdown of LVRs by residential mortgages by origination
3 Loan data represented by purpose. Includes Business and Agribusiness divisions. Excludes Delphi Bank & Keystart data. Arrears includes impaired over 90d+ and excludes arrangements
65You can also read