The Research Monitor March Quarter 2018 - Shaw and Partners
←
→
Page content transcription
If your browser does not render page correctly, please read the page content below

The Research Monitor
March Quarter 2018

With the compliments of your adviser

 Content
 December Quarter 2017 Performance                             Page 3
 Meet the Research Team                                        Page 4
 Large Cap Model Portfolio                                     Page 6
 Hybrid Income Model Portfolio                                 Page 8
 Our Preferred Stocks 		                                       Page 10
     Apiam Animal Health (AHX)
     Axsesstoday (AXL)
     BWX (BWX)
     Fortescue Metals Group (FMG)
     IOOF Holdings (IFL)
     Lendlease Group (LLC)
     Money3 Corp (MNY)
     Navigator Global Investments (NGI)
     P2P Transport (P2P)
     Woodside Petroleum (WPL)

 Shaw and Partners
 Shaw and Partners is one of Australia’s preeminent investment and wealth management firms.

 With a national presence and $14 billion of assets under advice, Shaw and Partners offers the intimacy of a boutique
 investment firm with the resources and scale of a major financial group. We are privately owned and client focused,
 having helped our clients manage and grow their financial assets for more than 30 years. Our emphasis on integrity
 and stringent compliance standards has enabled us to achieve very high levels of client satisfaction, while unlocking
 opportunities of significant value.

 Backed by fresh thinking, robust research and some of the nation’s best investment and wealth experts, our business
 is well positioned to meet the needs of our clients. Shaw and Partners offers access to an extensive team of private
 client advisers, institutional sales and trading specialists, market leading research analysts and strategic corporate
 advisers. By working closely with our clients, we have forged long-term relationships. Whether you are a private
 investor, high net worth individual, charity, institution or corporate client, our focus is simple: listen to you then act
 according to your objectives.

 We welcome you to Shaw and Partners. Your partners in building and preserving wealth.

 2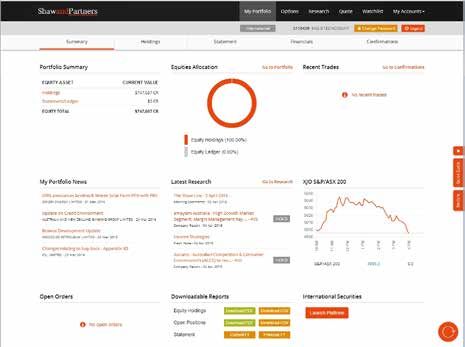
December Quarter 2017
Performance
The Australian Share Market, as measured by the S&P/ASX 300 Index, rose by 6.9%
on a price basis and by 7.7% on an accumulation basis during the December quarter,
ending a pattern of low returns.

Looking beneath the index level, however, there was                                   (RMD) and Cochlear (COH) each up 12+%. The Food and
much movement with the best performing sector –                                       Beverage sector was also up strongly (15.5%) thanks to
Household and Personal Products – outperforming the                                   a2 Milk Company (A2M) up 25.8% and Treasury Wine
worst performing sector – Banks - by 28.6%.                                           Estates (TWE) up 16.6%. The big underperformer –
                                                                                      Banks – saw three of the big four post share price falls
Although Household and Personal Products was the                                      for the quarter with ANZ down 2.9% (ex $0.78 dividend),
best performing sector, it only contains three stocks –                               NAB down 6.1% (ex $0.99 dividend during the quarter)
Blackmores (BKL) (up 43.4%), BWX (BWX) (up 31.6%)                                     and WBC down 1.8% (ex $0.94). Of the big four, only
and Asaleo Care (AHY) (down 2.9%) – and only makes                                    CBA (up 6.8%) rose.
up 0.21% of the index. Amongst the larger sectors, it was
the case of Energy (up 18.3%) and Materials (up 13.0%)                                Global markets performed well in the December quarter,
against the Banks (up only 1.9%). Energy/Materials make                               and the Australian dollar was essentially flat over the
up 23% of the Index and Banks make up 26% so this                                     period. NASDAQ index was up 6.3% as technology
was the key to performance in the quarter.                                            stocks continued their recent strong gains, the broader
                                                                                      S&P500 was up 6.1%, European stocks fell 0.9%,
A number of sectors rebounded after a lacklustre                                      Japanese stocks rose 8.4% and the World index was up
September quarter and some of the standout sectors                                    5.0%. Fixed income markets were slightly better as some
and stocks included Healthcare Equipment and Services                                 bond yields drifted lower, with the Bloomberg AusBond
(up 11.5%) thanks to strong performances from Resmed                                  Composite (0+Y) Index up 1.4%.

                                                                                        Real Estate
                                                                                         124.05bn                 Transportation          Pharmaceuti-       Insurance
                                                                                           7.8%                      70.10bn             cals, Biotech &      64.00bn
                                                                                                                      2.3%                Life Sciences        9.5%
                                                                                                                                             67.16bn
                                                                                                                                               5.7%
                                 Banks
                                427.85bn
                                                                                   Food & Staples
                                  1.9%
                                                                                  Retailing 89.01bn
                                                                                         8.3%
                                                                                                                    Consumer         Telecommuni-            Health Care
                                                                                                                     Services        cation Services         Equipment &
                                                                                                                     53.53bn             50.52bn               Services
                                                                                                                      11.5%               6.2%                 50.19bn
                                                                                                                                                                11.5%
                                                                                Diversified Financials
                                                                                      88.70bn
                                                                                         9.1%
                                                                                                                                                Utilities        Retailing
                                                                                                                    Commercial &
                                                                                                                                                33.60bn          15.37bn
                                Materials                                                                        Professional Services                            6.2%
                                                                                                                                                 3.3%
                                294.48bn                                                                               39.12bn
                                 13.0%                                                                                   9.9%
                                                                                                                                                               Capital Goods
                                                                                   Energy 86.10bn                                                                13.16bn
                                                                                       18.3%                          Software &             Food Beverage        10.8%
                                                                                                                       Services                & Tobacco
                                                                                                                       34.18bn                  31.50bn           Media
                                                                                                                        16.7%                    15.5%            8.28bn
                                                                                                                                                                  10.5%

Heat map legend: Size of box: market cap of sector. Colour of box: Quarterly performance (green positive, red negative).
Source: Shaw and Partners
                                                                                                                                                                               3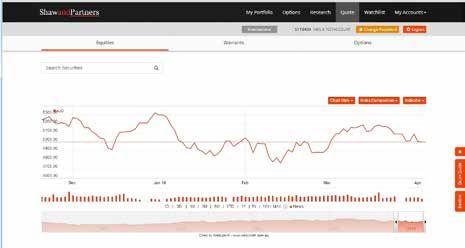
The Research Team
At Shaw and Partners, we don’t simply repackage publicly available information.
Our analysts visit key companies and spend time with management, competitors,
suppliers and customers of businesses to understand the company at a grassroots
level, from which they can generate unique insights and unearth commercial
opportunities that are otherwise missed by the broader market.

          Martin Crabb                                     Danny Younis
          Chief Investment Officer                         Senior Analyst, Technology, Developers &
                                                           Contractors, Retailers
          Martin joined Shaw and Partners in April 2011.
          Prior to joining Shaw and Partners, Martin       Danny joined Shaw and Partners in April
          was an Executive Director at Macquarie           2010 and covers the Industrials sector with
          Group where he worked for over 20 years          specific focus on Technology, Contractors,
          in roles spanning Institutional Stockbroking,    Mining Services and Retailers. Danny has
          Wealth Management, Research and Portfolio        had over 15 years of experience in financial
          Management. Martin holds a Bachelor of           markets. He commenced his career with CCZ
          Arts in Economics and Mathematics from the       Statton Equities and previously worked with
          University of Melbourne, with postgraduate       Aegis Equities, Westpac, Commonwealth
          studies in Applied Finance.                      Bank and StoneBridge Group where he was
                                                           Head of Research. Danny holds a Bachelor
                                                           of Science from the University of Sydney
                                                           and has completed FINSIA’s Graduate
                                                           Diploma of Applied Finance and Investment
                                                           (GDipAppFin).

          Darren Vincent                                   Peter Zuk
          Senior Analyst, Commercial Services, Life        Senior Analyst, Real Estate
          Sciences, Travel & Leisure
                                                           Peter joined Shaw and Partners in
          Darren joined Shaw and Partners in               October 2015 as a Senior Analyst. Peter
          September 2012 as a Small Company
                                                           has over 17 years of real estate industry
          specialist. Darren has worked in equity
                                                           experience that includes roles within
          markets for over 20 years, having previously
                                                           financial markets, direct industry and
          worked at Credit Suisse and also with BNP
          Paribas and ANZ Stockbroking. During his         advisory. Previously, Peter worked as an
          career Darren has covered a wide variety         equities analyst at Goldman Sachs where
          of small industrial companies and has been       he covered the Real Estate sector. Prior
          recognised by his clients for his work,          to this, he held roles at Goodman Group
          winning the 2010 East Coles Small Company        and KPMG where he focused on REITs,
          Analyst of the Year. Darren holds a Bachelor     developers and contractors. Peter has a
          of Economics from the Australian National        Masters of Commerce Degree from the
          University.                                      University of New South Wales and is
                                                           also a Chartered Accountant.

4
Peter O’Connor Stuart Baker
Senior Analyst, Metals and Mining Senior Analyst, Oil and Gas
Peter joined Shaw and Partners in January Stuart joined Shaw and Partners in February
2015 as a Senior Analyst. Peter is an 2017 and brings 38 years of experience in
experienced equities analyst specialising in the oil industry and financial markets. Stuart
Metals and Mining sectors. Peter was most worked as a Petroleum Engineer for oil-field
recently Managing Director, Head of Asian service company Schlumberger throughout
Metals & Mining Team, Co-Head of Global South East Asia for several years, followed by
team / Equities Research at Merrill Lynch/ 28 years in stockbroking as a rated analyst
Bank of America. Prior to this, Peter held for Bankers Trust, Macquarie Equities and
positions as Head of Australian Metals and most recently, Morgan Stanley. Stuart holds
Mining at Deutsche Bank, Head of Global a Bachelor of Engineering (Electrical) and
Metals and Mining at Credit Suisse and MBA (Finance) from University of Melbourne
Equities Research, Metals and Mining at & Graduate School of Management, is
Macquarie Bank. Peter also held operational a Member of the Society of Petroleum
roles with Rio Tinto and BHP Billiton for Engineers and Member of the Australian
over 10 years. Peter has a Bachelor of Institute of Directors.
Engineering (Mining) from the University of
New South Wales (First Class Honours and
the University Medal).
Matthew Johnston Jonathon Higgins
Analyst Analyst
Matthew joined Shaw in August 2015 as Jonathon joined Shaw and Partners in
an Associate Analyst in the Research team. July 2017 as an Analyst in the Small-Cap
Prior to Shaw, Matthew spent over 4 years’ at team. Jonathon previously worked as an
State Street Australia Limited. Most recently, equities research analyst at Bell Potter
he was part of the Investment Analytics team Securities for 2 years in both a research and
carrying out performance and attribution research dealing role, covering industrial and
analysis for Asset managers across multiple technology focussed companies. Jonathon
asset classes. Matthew holds a Bachelor of holds a Bachelor of Science (Civil Systems)
Commerce from the University of Sydney from the University of Melbourne and a
with majors in Finance and Economics. Master of Commerce (Finance) from RMIT
University.
5Large Cap Model Portfolio
Our Australian Large Cap Model Portfolio Model Portfolio @ 31 December 2017
outperformed its S&P/ASX100 benchmark by 1.1%
in December, gaining 2.79% versus 1.71% for the BHP BHP Billiton 10.20%
market. Over the year, we returned 14.8% against WBC Westpac Banking Corp 8.60%
an index return of 11.0% - outperformance of 3.8% CBA Commonwealth Bank of Aust 8.50%
picking up on 2016’s 0.8% outperformance. ANZ ANZ Banking Group 7.30%
December’s outperformance can be attributed to being MQG Macquarie Group 7.00%
overweight the Materials and Energy sectors. These NAB National Australia Bank 5.40%
two sectors comprise one third of our model portfolio OSH Oil Search 4.70%
versus around one quarter of the index. Both sectors
RIO Rio Tinto 4.60%
returned in excess of 6% for the month versus 1.7%
SUN Suncorp Group 3.40%
for the broad market. Our other two large overweight
sectors – Diversified Financials and Banks – did rather WPL Woodside Petroleum 3.30%
poorer underperforming the index in December. Being SGP Stockland 3.20%
underweight utilities and transport also helped as these MFG Magellan Financial Group 3.20%
sectors performed poorly.
WOW Woolworths 3.10%
We see no need to make changes to our model portfolio FMG Fortescue Metals Group 3.00%
at this point, having recently increased our holding in IFL IOOF Holdings 2.90%
ANZ Banking Group (ANZ). We upgraded ANZ to a BUY FLT Flight Centre Travel Group 2.70%
recommendation and increased the weight by 2%. We
CYB Clydesdale Bank 2.40%
funded this by taking profits in CYBG PLC (CYB), which
has performed strongly and is moving up to our $6.30 OZL OZ Minerals 2.30%
Price Target. LLC Lendlease Group 2.30%
ILU Iluka Resources 2.20%
From a sector perspective, we remain heavily overweight
Diversified Financials (+9.8% versus the benchmark), CGF Challenger 2.20%
Materials (+8.4%), Banks (+6.9%) and Energy (+3.1%). VCX Vicinity Centres 2.00%
Our largest underweight positions on a sector basis are BOQ Bank of Queensland 2.00%
Transport (-4.3%) and Pharmaceuticals (-4.1%). AWC Alumina 1.90%
NCM Newcrest Mining 1.60%
Total 100.0%
Accumulation Performance to 31 December 2017
Period Portfolio ASX300 ASX100 Relative
Month 2.8% 1.9% 1.7% 1.1%
Quarter 6.6% 7.7% 7.1% -0.5%
Year 14.8% 11.9% 11.0% 3.8%
Year to Date 14.8% 11.9% 11.0% 3.8%
Fin Year to Date 9.9% 8.6% 7.5% 2.4%
Inception 90.6% 77.1% 81.6% 9.0%
* Inception date is 20 July 2011
6Recommendation Portfolio Attribution
It is becoming increasingly difficult to remain bullish about December was a good month. Our strategy of positioning
equity markets given the significant run up we have seen the portfolio for a return of “the reflation trade” proved
globally in 2017. We remain neutral in a balanced portfolio prescient and our best performing stocks all hailed from
setting but this is because the alternatives (bonds) are the Materials sector. Materials and Energy were the
worse. 2018 will be a game of two halves – the first we stars, followed by the bouncing Telco sector. If investors
are kicking with a strong breeze and so must all-out avoided the Utilities and Transport sectors, as we did,
attack. In investment terms we must dial up beta to they also fared well.
capture the last gasp of the reflation trade. Second half
will be kicking into the stiff wind blown up by central bank
policy normalisation, rising fears of inflation and recession
and rising interest rates.
Portfolio Performance (Accumulation Basis)
Portfolio Fifty Leaders ASX/S&P300 Accumulation
2.00
1.80
1.60
1.40
1.20
1.00
0.80
Oct 11
Oct 12
Oct 13
Oct 14
Oct 15
Oct 16
Oct 17
Jul 11
Jul 12
Jul 13
Jul 14
Jul 15
Jul 16
Jul 17
Apr 12
Apr 13
Apr 14
Apr 15
Apr 16
Apr 17
Jan 12
Jan 13
Jan 14
Jan 15
Jan 16
Jan 17
Source: Shaw and Partners
7Hybrid Income Model Portfolio
The Income Strategies team consists of specialised strategists dedicated to
interpreting the debt and preference share markets. With a focus on structuring
and managing listed and hybrid portfolios and blending with equities, the
team aims to maximise income, whilst simultaneously minimising the risk of
drawdown/permanent loss of capital, providing clients with thoughtful analysis
and investment opportunities.
Investment Strategy
The Shaw ASX Hybrid Income Portfolio aims to provide
investors with exposure to a highly transparent portfolio
of ASX listed debt and preference securities that offer
Cameron Duncan diversification benefits to both Australian Equities and
Co-Head, Income Strategies cash/term deposit investor’s allocations.
There is a growing universe of listed assets spanning
Cameron has 30 years experience across financial Senior Debt, Subordinated Debt, Convertible Preference
markets, including over 16 years at Macquarie Group in Shares, Convertible Notes and Income Securities (debt
and equity). While these “Hybrid” securities each have
listed debt and hybrid advisory, syndication, proprietary
their own characteristics, research and subsequent
trading and portfolio risk management. Cameron has
implementation and monitoring allows for strategies to
a Bachelor of Economics degree from the University of
extract risk adjusted return from this sector that aims to
Sydney and has completed the Diploma of Financial enhance a core portfolio of Australian Equities and cash.
Planning & RG146.
Investment Objectives
The objective of the Shaw Hybrid Income Portfolio is to
provide a sustainable level of income whilst seeking to
preserve capital. The target total portfolio return (gross) of
the portfolio is 3% above the RBA cash rate. This return
Steve Anagnos will be generated from a combination of cash (interest
Co-Head, Income Strategies payments and dividends), franking credits and capital
growth (realised and unrealised) from an active portfolio
strategy.
Steve has 25 years experience across financial markets
and investment management in a range of Senior roles Risk tolerance: The portfolio aims to limit the risk of
capital loss through security diversification and active
at Citigroup, Bank of America Merrill Lynch, CBA and
portfolio management. It is suitable for investors that have
Strategic Capital Management. Steve’s focus has been
a 3 year + investment horizon that can tolerate secondary
in designing and implementing portfolio strategies using
market pricing and liquidity risks through the life of the
listed debt, hybrids and equity derivatives. Steve has a securities, up to the respective first call/maturity date of
Bachelor of Economics degree and Master of Applied each security.
Finance degree from Macquarie University.
8Portfolio Holdings – Top 5 Portfolio Highlights
ASX Code Issuer Security Type Positive new hybrid listing performances underpin
WBCPG Westpac Bank Capital Note IV margins. The Total portfolio return has exceeded
its return objectives based on a period of 1 month, 3
CBAPD Comm bank PERLS VII
months, 6 months, 12 months and since inception.
NABPC Nat Aust Bank Capital Note For the month the total portfolio return was 1.18%,
WBCPF Westpac Bank Capital Note III which was well above its objective of 0.40%. The total
portfolio return for the quarter was 2.13%, higher than
ANZPG ANZ Bank Capital Note IV
its return objective, 7.6% for the 12 month period and
8.29% pa since inception (Sep 2015).
Portfolio Characteristics December is a significant dividend month. The Total
Expected Yield to Call/Maturity (including franking): 4.7% Income Return (Gross) was 0.95% for the month and
1.14% for the quarter, whilst the commensurate income
Expected Gross Running Yield (including franking) 5.3%
return since inception (Sep 2015) is +5.67% p.a. A
Expected Cash Running Yield (not including franking) 3.8% total of thirteen securities (CBAPE, WBCPG, NABPD,
Expected Years to Maturity 4.9 IAGPD and ANZPG being the largest payments) traded
ex distribution this month.
Number of Securities 22
Floating Rate exposure 100% The main contributors to performance during the
Fixed Rate Exposure 0%
month were MBLHB (+3.2%), MQGPB (+2.8%),
and CGFPB (+2.1%). There were no detractors to
performance during the month with NABPB (+0.3%)
Markets Returns being the lowest returning security in the portfolio.
Return 1 Month 3 Month 1 Year During the month we reduced our weighting to MQGPB
and NABPB and increased the portfolios’ exposure to
ASX200 Accumulation 1.81% 7.63% 11.78%
WBCPG. Our cash holding rose slightly to 3.3% of the
RBA Cash Rate 0.13% 0.38% 1.51% portfolio.
The portfolio continues to enjoy favourable income
returns in a period where large new issues are heavily
bid for and supply is scarce. We continue to see
re-allocation from Equity based portfolios looking for
a lower risk alternative.
Portfolio Performance
Return 1 Month 3 Month 6 month 1 year 2 year Inception
Income Return (Gross) 0.95% 1.14% 2.73% 5.32% 5.44% 5.67%
Capital Return 0.23% 0.99% 1.17% 2.28% 3.14% 2.62%
Total Portfolio Return (Gross) 1.18% 2.13% 3.90% 7.60% 8.58% 8.29%
Portfolio Return Objective 0.40% 1.10% 2.30% 4.60% 4.70% 4.80%
Excess Return v Objective 0.78% 1.03% 1.60% 3.00% 3.88% 3.49%
9Our Preferred Stocks
Apiam Animal Health (AHX) Lendlease Group (LLC)
Apiam Animal Health (AHX) operates as a veterinary LendLease Group (LLC) designs, develops, and
practice and products supplier. The Company practices manages property and infrastructure assets. The
across the pig, dairy, feedlot, sheep, equine, and Company constructs apartments, commercial buildings,
companion animal sectors. Apiam Animal Health has government offices, retirement living, and educational
headquarters in Australia. facilities. LendLease serves customers worldwide.
Axsesstoday (AXL) Money3 Corp (MNY)
Axsesstoday (AXL) provides finance services to small Money3 Corp (MNY) provides consumer lending services
to medium sized enterprises (SMEs) for equipment. It in Melbourne and Geelong Australia. The Company offers
operates through the following segments: Hospitality, loans, check cashing, and money gram services.
Transport, and Other Equipment. The Hospitality segment
includes coffee machines, display units, cooking, Navigator Global Investments (NGI)
refrigeration and dishwashing equipment. Navigator Global Investments (NGI) provides investment
management services. The Company provides hedge
BWX (BWX) fund solutions to retail, wholesale, and institutional
BWX (BWX) manufacture body, hair and skin care investors. Navigator Global Investments serves clients
products. The Company produces and distributes worldwide.
moisturizers, oils, lotions, scrubs, creams and other
related products. P2P Transport (P2P)
P2P Transport (P2P) as a fleet management and
Fortescue Metals Group (FMG) transportation company. The Company focuses on
Fortescue Metals Group (FMG) is an iron ore production point-to-point passenger transportation services. P2P
and sea-borne trading company, which engages in the Transport serves clients in Australia.
mining of iron ore and the operation of an integrated
mine, rail, and port supply chain. Its projects include Woodside Petroleum (WPL)
Chichester Hub, Solomon Hub, Herb Elliott Port, and Rail Woodside Petroleum (WPL) explores for and produces
Expansion. oil and gas from offshore and onshore facilities located in
Western Australia and Northern Territory. The Company
IOOF Holdings (IFL) operates numerous oil and gas fields and pipelines
IOOF Holdings (IFL) is a financial services company throughout Australia, United States and Mauritania and
operating in Australia. The Company’s services include its products include liquefied natural gas, domestic gas,
personal superannuation, allocated pension services, condensate, crude oil and liquefied petroleum gas.
employee superannuation retirement services and
investment services.
10Apiam Animal Health (AHX) Axsesstoday (AXL)
Recommendation BUY Recommendation BUY
Risk MEDIUM Risk HIGH
Share Price (as at 19 January 2018) $0.89 Share Price (as at 19 January 2018) $1.83
Target Price $1.20 Target Price $2.11
Analyst Darren Vincent Analyst Jonathon Higgins
Share Price Chart Share Price Chart
120 150
AHX-AU ASX 200 AXL ASX 200
110 140
100
130
90
120
80
110
70
60 100
50 90
Jan-17 Mar-17 May-17 Jul-17 Sep-17 Nov-17 Jan-18 Jan-17 Mar-17 May-17 Jul-17 Sep-17 Nov-17 Jan-18
Source: FactSet, Shaw and Partners Source: FactSet, Shaw and Partners
1 mth 3 mth 12 mth 1 mth 3 mth 12 mth
Relative Performance* (1.8%) 9.6% (23.6%) Relative Performance* 20.3% 11.5% 31.4%
* Relative Performance is compared to the S&P/ASX 200 Index * Relative Performance is compared to the S&P/ASX 200 Index
Strong Markets and Progress Against Strategic Initiatives Accessing Exponentially Growing Australian Leasing
§ At its November AGM AHX confirmed that key drivers for the Fin-Tech
production animal sector are positive for FY2018. In addition § AXL provides equipment leasing solutions across the
we note that Dairy producers are now getting good milk segments of hospitality, transport and other sectors. Leases
prices which has seen recovery through 2H17 and 1Q18, the are originated across merchant checkout, brokers and directly,
pig industry has returned to normal procurement patterns, with the company offering a white label and Axsesstoday
feedlot cattle prices remain high as expected, but volumes branded product. AXL is integrated in 450+ merchants POS,
are understood to be up on pcp. primarily targets SME’s of prime credit quality, offers leases up
§ Progress against strategic initiatives is coming through now. to 5 years in length and $500k in size although on average
AHX has invested significant resources in putting in place a leases areBWX (BWX) Fortescue Metals Group (FMG)
Recommendation BUY Recommendation BUY
Risk MEDIUM Risk HIGH
Share Price (as at 19 January 2018) $7.74 Share Price (as at 19 January 2018) $5.12
Target Price $7.61 Target Price $6.40
Analyst Jonathon Higgins Analyst Peter O’Connor
Share Price Chart Share Price Chart
210 130
BWX ASX 200 FMG ASX 200
190 120
110
170
100
150
90
130
80
110 70
90 60
Jan-17 Mar-17 May-17 Jul-17 Sep-17 Nov-17 Jan-18 Jan-17 Mar-17 May-17 Jul-17 Sep-17 Nov-17 Jan-18
Source: FactSet, Shaw and Partners Source: FactSet, Shaw and Partners
1 mth 3 mth 12 mth 1 mth 3 mth 12 mth
Relative Performance* 3.9% 10.1% 72.0% Relative Performance* 5.6% 3.7% (23.6%)
* Relative Performance is compared to the S&P/ASX 200 Index * Relative Performance is compared to the S&P/ASX 200 Index
Number 1 With Domestic and International Irons in The The “Cheapest” (P/NPV basis) Name in our Coverage
Fire Delivering Scale and Distribution § The FMG journey over the past two years has been
§ BWX is a vertically integrated body, hair and skin care extraordinary to say the least with the share price tracking
company headquartered in Australia. BWX primary brands higher with mining cost reductions, cashflow generation,
include the popular Sukin available in Australia and overseas balance sheet deleveraging and ultimately the whims of the
as well as recent brand additions including Andalou Naturals iron ore market and of course the iron ore price. These key
and Mineral Fusion which operate primarily in North America. drivers are expected to continue over the next several years.
§ An investment in BWX delivers exposure to the ‘natural’ § Quality differential priced in – The price differential received by
skincare category both domestically and globally, a category FMG was a tough headwind in late DQ2017. In our view the
that is growing double digits and provides high gross margin discount issue is more “cyclical than structural” and we think
exposure both domestically and internationally. that it has largely run its course. Moreover the share price
§ The company has a number of drivers over the next 12 is currently imputing a long term price discount well beyond
months that could continue to drive performance and these reasonable expectations. Hence we consider that the current
include: 1) Domestic Sukin sales performance exceeding headwind is now adequately priced into FMG’s share price.
expectations, particularly in the grocery segment with § Capital management opportunities. FMG’s cash generation
recent Coles entry; 2) Integration of Andalou Naturals and and deleveraging potential, even at lower prices is sufficient
Mineral Fusion progressing to plan, achieving growth in to see the company move to net cash over the next few
these businesses and possible synergies beyond currently years and to dividend a significant amount of income to
assumed; 3) Performance of Sukin across multiple overseas shareholders (Fully franked).
markets, with multiple jurisdictions, distribution agreements
and growth.
§ Currently valued at a discount to Australian listed FMCG
peers with what we consider to be a more transparent
earnings profile, we continue to see BWX as providing USD
exposure, access to positive category growth and multiple
growth levers.
Forecasts Forecasts
YE 30 Jun (AUD) 2017 (A) 2018 (E) 2019 (E) YE Jun (USD) 2016 (A) 2017 (E) 2018 (E)
Earnings cps 19.1 24.7 34.5 Earnings cps 27.2 67.3 38.9
Dividends cps 6.7 8.0 14.0 Dividends cps (AUD) 14.8 44.5 32.6
PE x 30.8 31.3 22.4 PE x 9.6 6.1 10.5
Yield % 1.1 1.0 1.8 Yield % 4.1 8.2 3.9
Franking % 100 100 100 Franking % 6.2 100 100
12IOOF Holdings (IFL) Lendlease Group (LLC)
Recommendation BUY Recommendation BUY
Risk MEDIUM Risk MEDIUM
Share Price (as at 19 January 2018) $11.10 Share Price (as at 19 January 2018) $15.53
Target Price $13.00 Target Price $18.17
Analyst Martin Crabb Analyst Peter Zuk
Share Price Chart Share Price Chart
140 140
IFL ASX 200 LLC ASX 200
130 130
120
120
110
110
100
90 100
80 90
Jan-17 Mar-17 May-17 Jul-17 Sep-17 Nov-17 Jan-18 Jan-17 Mar-17 May-17 Jul-17 Sep-17 Nov-17 Jan-18
Source: FactSet, Shaw and Partners Source: FactSet, Shaw and Partners
1 mth 3 mth 12 mth 1 mth 3 mth 12 mth
Relative Performance* 2.0% (7.8%) 14.5% Relative Performance* (3.0%) (7.1%) 6.3%
* Relative Performance is compared to the S&P/ASX 200 Index * Relative Performance is compared to the S&P/ASX 200 Index
ANZ Wealth: A Materially Accretive Acquisition Look Beyond Sentiment
§ Incorporation of the impeding ANZ Wealth acquisition sees § We see recently announced engineering and construction
near term earnings diluted by share issuance but the market wins as a positive for the group – including the ~$6m
is missing the potential for serious synergy benefits from the Melbourne Metro project. In addition, LLC has secured a
ANZ acquisition and the stock has underperformed. We see ~$1.7b urban renewal project in Tottenham UK and has also
this as a buying opportunity. received planning approval for its final commercial tower at
§ We incorporate the ANZ Wealth acquisition which probably Melbourne Quarter.
won’t complete until the end of 2018 but has been “paid § We suggest LLC’s recent sell-off has been on the back of
for” by shareholders now. We are sticking with management negative sentiment surrounding (1) the previously announced
guidance of $130m in separation and integration costs over impairment at three engineering projects and (2) general
three years and $65m of pre-tax synergies from 2021. We concern over a slowdown in Australian residential markets
reckon they can pull out more. – with particularly focus on the apparent decline in foreign
§ IFL have been able to hold their adviser market share and buyers. On the first point, we expect greater clarity at the
have been growing their adviser footprint steadily via organic upcoming 1H18 result in February, and on the second point,
and acquisitive means. ANZ was bleeding advisers and this we remain unconcerned about settlement risk from foreign
is one of the fears the market has about this deal. IFL has buyers of LLC’s residential projects.
shown it has kept most acquired advisers and added more. § Looking beyond sentiment, from a capital position, LLC is in
§ This acquisition optimises the capital structure of the group very good shape. It has a robust development workbook and
and lowers the WACC, subsequently raising our DCF continues to grow its annuity income from both investments
valuation to $14.54. A sum-of-the-parts valuation of $11.43 and funds under management.
supports a 12 month target price of $13.00. We see IFL § We remain comfortable in our earnings outlook for FY18 and
earning in excess of $1.00 per share once ANZ Wealth is fully suggest FY19 will be an even better year due to the number
integrated and costs are minimised. of apartment projects due to complete and settle that year.
Forecasts Forecasts
YE 30 Jun (AUD) 2017 (A) 2018 (E) 2019 (E) YE 30 Jun (AUD) 2017 (A) 2018 (E) 2019 (E)
Earnings cps 56.5 53.5 65.9 Earnings cps 130.1 131.5 145.1
Dividends cps 53.0 52.0 60.0 Dividends cps 66.0 66.2 72.6
PE x 17.3 20.7 16.8 PE x 12.8 11.8 10.7
Yield % 5.4 4.7 5.4 Yield % 4.0 4.3 4.7
Franking % 100 100 100 Franking % 0 0 0
13Money3 Corp (MNY) Navigator Global Investments (NGI)
Recommendation BUY Recommendation BUY
Risk HIGH Risk HIGH
Share Price (as at 19 January 2018) $1.74 Share Price (as at 19 January 2018) $3.78
Target Price $2.27 Target Price $3.95
Analyst Jonathon Higgins Analyst Martin Crabb
Share Price Chart Share Price Chart
115 170
110 MNY ASX 200 160 NGI ASX 200
105 150
100 140
95 130
90 120
85 110
80 100
75 90
70 80
Jan-17 Mar-17 May-17 Jul-17 Sep-17 Nov-17 Jan-18 Jan-17 Mar-17 May-17 Jul-17 Sep-17 Nov-17 Jan-18
Source: FactSet, Shaw and Partners Source: FactSet, Shaw and Partners
1 mth 3 mth 12 mth 1 mth 3 mth 12 mth
Relative Performance* 9.5% 7.2% (2.2%) Relative Performance* 20.0% 24.1% 58.1%
* Relative Performance is compared to the S&P/ASX 200 Index * Relative Performance is compared to the S&P/ASX 200 Index
All The Headwinds Now Tailwinds Strong FUM Growth and Lower US Tax Provide a Boost
§ Money3 (MNY) is primarily a provider of secured automotive § We review our earnings and valuation for NGI following
loans, as well as other products such as longer term unsecured release of December FUM ($US10.46bn from $US9.97bn in
credit and shorter term unsecured credit. The company has September) and the reduction in the US Federal tax rate from
progressively decreased its reliance on unsecured credit 2018. Momentum is with the business at the moment and a
lending and has advised that it will cease lending within this strong pipeline of new business augers well for further inflows
space by the 1H19. Secured automotive now accounts for into 2018. Maintain BUY recommendation.
~80% of the total loanbook of the company. § Assets under management grew by 4.91% over the
§ MNY is a lending company that is organically growing its December quarter thanks to ~1% investment returns and
automotive lending by ~20% a year and makes NPAT of over $US330m of net flows, mostly ($US300m) into the lower
$30m, whilst being reasonably priced at an attractive sub margin customised solution business. In the past six months,
market PER. NGI has attracted $US660m of inflow and $US330m of
§ We expect MNY to organically grow its NPAT ~$45m by 2020 investment performance.
within the current funding envelope for the business and see § 2018 is shaping to be a tricky investment environment as
the current market share of the business ~4% doubling within first half melt-up will be replaced with inflationary fears and a
this time period. bond bear market. Market neutral products may well become
§ Catalysts for the stock within the near term include: 1) vogue for asset managers and NGI’s enviable long term track
Divestment or sale of unsecured lending division within the record sees it well placed to attract flows. Its recent build-up
next 12 months, leading to possible re-rating or funding of institutional sales capability, especially in ‘new’ markets
expansion; 2) Expansion and delivery of organic automotive such as the Middle East and Japan are set to deliver this year.
growth, delivering a more attractive returns profile and § The reduction in US Federal tax rates from 35% to 21% is
increasing investor confidence around growth in earnings; a double edged sword for NGI. On one hand, longer term
3) Further debt and dry powder structure improvements, earnings will be boosted by ~20%. In the short term however,
including possible securitisation; 4) Possible opportunistic the value of US tax losses become worthless and so the
and accretive loanbook acquisition opportunities in a cottage point at which the company starts actually paying tax is
type industry. drawn closer. We calculate a discounted cashflow valuation
of $A3.51 and add $A57m of surplus cash to derive a $A3.95
price target.
Forecasts Forecasts
YE 30 Jun (AUD) 2017 (A) 2018 (E) 2019 (E) YE 30 Jun (USD) 2017 (A) 2018 (E) 2019 (E)
Earnings cps 17.2 18.7 21.3 Earnings cps 17.7 21.6 27.4
Dividends cps 5.7 6.0 7.0 Dividends cps (AUD) 18.6 22.6 27.0
PE x 7.4 9.3 8.1 PE x 10.4 14.0 11.1
Yield % 4.4 3.5 4.0 Yield % 7.6 5.8 7.1
Franking % 100 100 100 Franking % 0 0 0
14P2P Transport (P2P) Woodside Petroleum (WPL)
Recommendation BUY Recommendation BUY
Risk MEDIUM Risk HIGH
Share Price (as at 19 January 2018) $1.33 Share Price (as at 19 January 2018) $33.35
Target Price $1.68 Target Price $35.00
Analyst Darren Vincent Analyst Stuart Baker
Share Price Chart Share Price Chart
110 110
P2P-AU ASX 200 WPL ASX 200
108
105
106
104 100
102
100 95
98
90
96
94 85
Dec-17 Dec-17 Dec-17 Dec-17 Jan-18 Jan-18 Jan-18 Jan-17 Mar-17 May-17 Jul-17 Sep-17 Nov-17 Jan-18
Source: FactSet, Shaw and Partners Source: FactSet, Shaw and Partners
1 mth 3 mth 12 mth 1 mth 3 mth 12 mth
Relative Performance* 3.4% (1.9%) (5.5%) Relative Performance* 4.9% 7.5% 12.1%
* Relative Performance is compared to the S&P/ASX 200 Index * Relative Performance is compared to the S&P/ASX 200 Index
Initiation of Coverage Under-Appreciated and Undervalued
§ Shaw and Partners recently completed P2P’s IPO and initiated § We have revised our oil prices higher. The changes are
coverage with a BUY rating and a $1.68 twelve month target significant in 2018 and then diminishing, reflecting the current
price. P2P the largest and most efficient fleet operator in shape of the forward oil curve, which in the past 3 months has
Australia is listing to further capitalise on a very profitable changed in profile from steep contango to backwardation.
model. P2P is the largest vertically integrated point-to-point § With increased domestic ownership following the Shell sell-
(ptp) fleet operator (taxis, UBER cars, hire cars) in Australia. It down, we think there will be more pressure on the Board
listed on the ASX in December raising $30.0m to continue its to pay-out the very substantial franking account which
vertical and horizontal growth. approximates US$1.9B, or US$2.2/share. The chances of
§ Unassailable cost advantages make P2P disruptive and likely a buy-back, special dividend or some other form of capital
to take significant market share. P2P has begun consolidating management have gone up, although we would not expect
the Australian industry which is fragmented (most owners any move to do so until the 2017 results are revealed in
having less than ten cars and only a handful have ~100), it had February 2018.
720 on listing (going to a forecast 1084 by year end) giving it § WPL are in the enviable position of being able to contemplate
an east coast market share of ~6%, first mover advantage and higher shareholder returns, without compromising
it is the only group we are aware of consolidating the industry. re-investment for growth. Production growth from Wheatstone,
P2Ps ROI on additional cars is exceptional at ~50% and is followed by Greater Enfield in 2019, coupled with higher oil
forecast to move higher. High returns from operating fleets prices amplifies the free cash flow from operations. The
are only, as shown overseas, possible with scale. On listing money has to find a home. The balance sheet is already
every additional car P2P puts on the road has a ~24 month strong so there is no need to divert cash into fixing it. If
pay back and with improved scale and a number of industry excess cash flow is banked, then gearing would fall to 15%
changes is forecast to increase to ~12 months. by year end 2020 and net debt to US$2.9B. This is low for a
§ P2P is an industry consolidation opportunity that presents company with EV of more than A$40B.
both acquisition upside and significant organic growth. Trading
at 7.25x FY18 EBITDA and 5.8x CY18 EBITDA, P2P is trading
at a 33% discount to AMA, 28% discount to G8 and 49%
discount to PSQ. We believe it has better growth prospects
than these companies, a relatively low risk profile and a very
strong board and management team. BUY.
Forecasts Forecasts
YE 30 Jun (AUD) 2017 (A) 2018 (E) 2019 (E) YE 31 Dec (USD) 2016 (A) 2017 (E) 2018 (E)
Earnings cps 0.1 8.1 16.1 Earnings cps 68.5 120.3 147.2
Dividends cps 0.0 0.0 8.1 Dividends cps 111.6 125.5 149.3
PE x 16.3 8.3 PE x 32.9 22.2 18.1
Yield % 0.0 0.0 6.1 Yield % 3.7 3.6 4.4
Franking % 100 100 100 Franking % 100 100 100
15Recommendation Definitions Rating Classification Buy Expected to outperform the overall market Hold Expected to perform in line with the overall market Sell Expected to underperform the overall market Not Rated Shaw has issued a factual note on the company but does not have a recommendation High Higher risk than the overall market – investors should be aware this stock may be speculative Medium Risk broadly in line with the overall market Low Lower risk than the overall market. Disclaimer Shaw and Partners Limited ABN 24 003 221 583 (“Shaw”) is a participant of ASX Limited, Chi-X Australia Pty Limited and holder of Australian Financial Services licence number 236048. ANALYST CERTIFICATION The Research Analyst who prepared this report hereby certifies that the views expressed in this document accurately reflect the analyst’s personal views about the Company and its financial products. The Research Analyst has not been, is not, and will not be receiving direct or indirect compensation for expressing the specific recommendations or views in this report. As at the date of this report, the Research Analyst does have an interest in the financial products of NGI. DISCLAIMER This report is published by Shaw to its clients by way of general, as opposed to personal, advice. This means it has been prepared for multiple distribution without consideration of your investment objectives, financial situation and needs (“personal circumstances”). Accordingly, the advice given is not a recommendation that a particular course of action is suitable for you and the advice is therefore not to be acted on as investment advice. You must assess whether or not the advice is appropriate for your personal circumstances before making any investment decisions. You can either make this assessment yourself, or if you require a personal recommendation, you can seek the assistance of your Shaw client advisor. This report is provided to you on the condition that it not be copied, either in whole or in part, distributed to or disclosed to any other person. If you are not the intended recipient, you should destroy the report and advise Shaw that you have done so. This report is published by Shaw in good faith based on the facts known to it at the time of its preparation and does not purport to contain all relevant information with respect to the financial products to which it relates. Although the report is based on information obtained from sources believed to be reliable, Shaw does not make any representation or warranty that it is accurate, complete or up to date and Shaw accepts no obligation to correct or update the information or opinions in it. If you rely on this report, you do so at your own risk. Any projections are estimates only and may not be realised in the future. Except to the extent that liability under any law cannot be excluded, Shaw disclaims liability for all loss or damage arising as a result of any opinion, advice, recommendation, representation or information expressly or impliedly published in or in relation to this report notwithstanding any error or omission including negligence. This publication has been prepared in accordance with Shaw’s Research Policy. A copy of the Policy can be found at www.shawandpartners.com.au. DISCLOSURE Shaw will charge commission in relation to client transactions in financial products and Shaw client advisors will receive a share of that commission. Shaw, its authorised representatives, its associates and their respective officers and employees may have earned previously, or may in the future earn, fees and commission from dealing in the Company’s financial products. Shaw acted for CYB and P2P in a corporate capacity within the past 12 months for which it received a fee. RISK STATEMENT Where a company is designated as ‘High’ risk, this means that the analyst has determined that the risk profile for this company is significantly higher than for the market as a whole, and so may not suit all investors. Clients should make an assessment as to whether this stock and its potential price volatility is compatible with their financial objectives. Clients should discuss this stock with their Shaw adviser before making any investment decision. 16
Register for Online Access
Online Portfolio Login
As a Shaw and Partners client, you are provided with free, secure online access
to view your portfolio anytime, anywhere.
Wide range of information included
Transaction history
Access to Shaw’s research library
Details of your CHESS holdings and
derivatives positions
Cash balances in your cash
management account
Access to confirmations and statements
records of each trade you have made
through Shaw
20 minute delayed ASX prices, quotes,
announcements, company profiles and
historical prices, and
‘Watch lists’ along with a charting
package to compare ASX listed stocks.
To register for online access please speak to your adviser, alternatively visit
http://www.shawandpartners.com.au/#/online-registration
17How the Shaw Managed
Accounts work
Shaw Managed Accounts (SMA) are a sophisticated investment and
reporting platform incorporating advanced features to assist in the
management of your overall investment strategy and portfolio.
Shaw Managed Accounts are established and offered The Model Portfolios are managed in a disciplined and
within the registered managed investment scheme consistent manner; overseen by a dedicated team of
known as the Separately Managed Accounts. Each investment professionals with many years of experience
investor has a separate “account” to which their in securities markets.
investments are allocated.
With Shaw Managed Accounts, not only are you the
Your account can be constructed by using a range of beneficial owner of the portfolio (and shares), you will
available investment strategies (referred to as Model also enjoy the ownership benefits (such as dividends
Portfolios) that you can select from the investment menu and franking credits) and have the ability to see the exact
together, with your Shaw and Partners adviser. make up and market value of the portfolio at any time,
via our online service.
Once you decide which Model Portfolios are best
suited to your investment needs and objectives, Shaw
and Partners will purchase securities to be included in
your account so that it reflects the Model Portfolio, or a
combination of Model Portfolios.
Investment goals (return, risk tolerance,
time horizon) and financial situation
Investor Shaw Adviser
Investment strategy, asset allocation
Shaw platform
Portfolio management
and performance
reporting
Shaw Direct Equity SMA Investment
Portfolio Service Model Portfolios professionals
in specie transfer Individual portfolio
of securities
18SMA Investment Options
At Shaw and Partners, we understand that your investment decisions may
vary depending on your stage of life and attitude towards risk.
Shaw and Partners offers 10 portfolio strategies designed to meet your
investment needs and objectives.
Portfolio Strategy Objective / Indicative Minimum
Benchmark Index number of suggested
securities investment
timeframe
Asset Class Portfolios
Shaw Debt Securities Income Portfolio RBA Cash rate + 1.5% 15 – 25 3+ years
Shaw Hybrid Income Portfolio RBA Cash rate + 3% 10 – 25 3+ years
(inclusive of franking credits)
Shaw Australian Equity (Large Cap) S&P/ASX 100 15 – 25 3+ years
Income Portfolio Accumulation Index
Shaw Australian Equity (Large Cap) S&P/ASX 100 15 – 25 3+ years
Core Portfolio Accumulation Index
Shaw Australian Equity (Large Cap) S&P/ASX 100 15 – 25 3+ years
Growth Portfolio Accumulation Index
Shaw Australian Equity (Small and Mid-Cap) S&P/ASX Small Ordinaries 15 – 25 3+ years
Growth Portfolio Accumulation Index
Shaw International Equity Portfolio MSCI World Index 15 – 25 3+ years
(ex–Australia unhedged)
Goal Based Portfolios
Shaw Income Goal Portfolio RBA Cash rate + 3% 15 – 25 3 – 5 years
(Gross Income and Total Return)
Shaw Balanced Portfolio RBA Cash rate + 4% 15 – 25 3 – 5 years
(Gross Income and Total Return)
Shaw Growth Goal Portfolio RBA Cash rate + 5% 15 – 25 3 – 5 years
Speak to your Adviser for more information about Shaw Managed Accounts
and to obtain a copy of the Product Disclosure Statement.
19Sydney | Head Office Melbourne Brisbane
Level 15, 60 Castlereagh Street Level 20, 90 Collins Street Level 28, 111 Eagle Street
Sydney NSW 2000 Melbourne VIC 3000 Brisbane QLD 4000
Telephone: +61 2 9238 1238 Telephone: +61 3 9268 1000 Telephone: +61 7 3036 2500
Toll Free: 1800 636 625 Toll Free: 1800 150 009 Toll Free: 1800 463 972
Adelaide Perth Canberra
Level 21, 25 Grenfell Street Level 14, 197 St Georges Terrace Level 1, 18 National Circuit
Adelaide SA 5000 Perth WA 6000 Barton ACT 2600
Telephone: +61 8 7109 6000 Telephone: +61 8 6188 7643 Telephone: +61 2 6113 5300
Toll Free: 1800 636 625 Toll Free: 1800 636 625 Toll Free: 1800 636 625
Holder of Australian Financial Services Licence Number 236048 | ABN 24 003 221 583 | Participant of ASX Limited, Chi-X Australia Pty Limited
20You can also read