Rabobank Investor presentation FY2018 results - 17 April 2019

Page created by Melanie Woods
 
CONTINUE READING
Rabobank Investor presentation FY2018 results - 17 April 2019
Rabobank
Investor presentation FY2018 results

17 April 2019
Rabobank Investor presentation FY2018 results - 17 April 2019
Disclaimer

This presentation (the “Presentation”) is prepared by Coöperatieve Rabobank U.A. (“Rabobank”) incorporated under the laws of the Netherlands. The liability of its members is excluded. Rabobank is
among others regulated by De Nederlandsche Bank N.V. and by the Netherlands Authority for the Financial Markets, as well as the European Central Bank. This Presentation is solely for information
purposes and on the basis of the acceptance of this disclaimer. Neither the Presentation nor any of its contents, in whole or in part, directly or indirectly, may be used for any other purpose without the
prior written consent of Rabobank. This Presentation is only directed at Eligible Counterparties and Professional Clients, as defined in the Markets in Financial Instruments Directive 2014/65/EU
(“MiFID”) (the “Recipient”). It is not directed at Retail Clients (as defined in MiFID).
The content of this Presentation reflects prevailing market conditions and Rabobank’s judgment as on the date of this Presentation, all of which may be subject to change. The information and opinions
contained in this Presentation have been compiled or arrived at from sources believed to be reliable, but no representation or warranty, express or implied is made as to their accuracy, completeness or
correctness. The information contained in this Presentation is published for the assistance of the Recipient, but is not to be relied upon as authoritative or taken in substitution for the exercise of
judgment by any Recipient nor will any information in this Presentation (including, but not limited to, Statistical Information (as defined below) and forward- looking statements) be subject to updating.
Rabobank has further relied upon and assumed, without independent verification, the accuracy and completeness of all information made available to it. To the extent permitted by law, Rabobank
excludes any liability howsoever arising from the contents of this Presentation or for the consequences of any actions taken in reliance on this Presentation or the content herein. Each Recipient is
advised to seek independent professional advice as to the suitability of any products and to their tax, accounting, legal or regulatory implications.
Members of the Rabobank Group trade on their own account and may from time to time hold or act in securities issued by a client, or may act as advisers, brokers or bankers to a client or any of its
affiliates.
This Presentation contains certain tables and other statistical analyses (the "Statistical Information"). Numerous assumptions have been used in preparing the Statistical Information, which may or may
not be reflected in this Presentation or may or may not be suitable for the circumstances of any particular Recipient. As such, no assurance can be given as to the Statistical Information's accuracy,
appropriateness or completeness in any particular context, or as to whether the Statistical Information and/or the assumptions upon which they are based reflect present market conditions or future
market performance. The Statistical Information should not be construed as either projections or predictions.
This Presentation may include "forward-looking statements". Such statements contain the words "anticipate", "believe", “could”, “intend", "estimate", "expect", "will", "may", "project", "plan“, the
negative of such terms and words of similar meaning. All statements included in this Presentation other than statements of historical facts, are forward-looking statements. Such forward-looking
statements involve known and unknown risks, uncertainties and other important factors that could cause actual results, performance or achievements to be materially different from future results,
performance or achievements expressed or implied by such forward-looking statements. Such forward-looking statements are based on numerous assumptions regarding present and future business
strategies and the relevant future business environment. The information and opinions contained in this Presentation are wholly indicative, for discussion purposes only and are subject to change
without notice at any time. No rights may be derived from any potential offers, transactions, commercial ideas contained in this Presentation. This Presentation does not constitute an offer,
commitment or invitation and does not constitute investment recommendation or investment advice and is not intended for the use by persons as an offer of securities subject to the Netherlands
Financial Supervision Act. This Presentation shall not form the basis of or be relied upon in connection with any contract or commitment whatsoever.
© Rabobank, Croeselaan 18, 3521 CB Utrecht, The Netherlands, www.rabobank.com/ir, Chamber of Commerce number 30046259.
Investing
Rabobank and the other parts of Rabobank Group that are designated as investment firms are registered as such with the Netherlands Authority for the Financial Markets. The aforementioned
investment firms are licensed by the Netherlands Authority for the Financial Markets under the Financial Supervision Act. If you invest funds that you have borrowed, you run the risk of incurring a debt
as well as losing the invested amounts.
This Presentation does not constitute an offering document. The information herein is neither an advertisement nor does it comprise a prospectus for the relevant EU legislations (as amended from
time to time). The information herein has not been reviewed or approved by any rating agency, government entity, regulatory body or listing authority and does not constitute listing particulars in
compliance with the regulations or rules of any stock exchange.
Nothing in this Presentation should be construed as legal, tax, accounting, regulatory or investment advice and the Recipient is advised to consult its own independent professional advisers in relation
to investment in one of the products mentioned. The information contained herein does not purport to be complete and your decision to invest in one of the products mentioned should solely be based
on the applicable prospectus or information memorandum including the risk factors, costs, terms and conditions and underlying values. The applicable prospectus or information memorandum is
available with Rabobank or on www.rabobank.com/ir.
The value of your investment can fluctuate. Past performance offers no guarantee for future results.

Investor Relations
Rabobank Investor presentation FY2018 results - 17 April 2019
Topics

    I       Update on strategy                  4

    II      FY2018 results                      10

   III      Capital & funding                   17

            Appendices

            I        Strategy                   23

            II       Results & loan portfolio   38

            III      Capital & funding          53

            IV       Other                      60

Investor Relations                                   3
Rabobank Investor presentation FY2018 results - 17 April 2019
Update on Strategy
Rabobank Investor presentation FY2018 results - 17 April 2019
Excellent customer focus
Highlights FY2018

                                             Growing a better world together

              Banking for the Netherlands                                                 Banking for Food

       Excellent customer                    Meaningful                           Rock-solid                         Empowered
              focus                          cooperative                            bank                             employees

                      Customer satisfaction continues to improve
                       • Upward trend in customer satisfaction continued in 2018
                       • Strongest reputation score of all large Dutch banks in RepTrak
                       • Supported by leading market shares and solid increase in private sector loan portfolio. Lending to F&A increased by 5%

                      Strong progress in innovation and data-driven digital banking
                       • Participation in commodity trade & finance blockchain platform Komgo
                       • Launch of Rabobank Developer Portal with APIs and platform capabilities for external developers
                       • Voice-enabled banking available via Google Assistant (account balance and spending alert)

                      Start of next wave of domestic transformation
                       • In December 2018 Rabobank implemented its new operating model to further improve commercial effectiveness
                         while at the same time safeguarding local presence
                       • Phased implementation of full agile organization
                       • Introduction of Simplify@scale as a further driver for simplification of client journeys, products and systems

Investor Relations                                                                                                                        5
Rabobank Investor presentation FY2018 results - 17 April 2019
Meaningful cooperative
Highlights FY2018

                                              Growing a better world together

              Banking for the Netherlands                                                   Banking for Food

       Excellent customer                      Meaningful                           Rock-solid                         Empowered
              focus                            cooperative                            bank                             employees

                      Sustainability integrated in our core business
                        • Enhanced focus on sustainability of business clients via appetite statements, client photo and client engagement
                        • Sustainalytics placed Rabobank at the top of the global ESG Risk Rating for major banks
                        • Partner Deltaplan Biodiversity, a coalition to restore biodiversity in the Netherlands

                      Rabobank shows leadership in sustainability
                        • First to launch ESG Leader CP/CD program under which Rabobank can issue instruments labelled as ESG investment
                        • Launched € 1bn AGRI3 Fund to boost sustainable agriculture in partnership with UN Environment
                        • Pension fund ABP commitment to invest € 500mn in green mortgages issued by Rabobank’s new label Vista

                      Concrete and socially responsible contribution
                        • Rabobank invests in local communities with cooperative dividend, knowledge, networks and volunteering by
                          employees
                        • Local Rabobanks allocate € 42mn of their net profit in local community initiatives on a not for profit basis in the
                          Netherlands

Investor Relations                                                                                                                          6
Rabobank Investor presentation FY2018 results - 17 April 2019
Rock-solid bank
Highlights FY2018

                                             Growing a better world together

                Banking for the Netherlands                                               Banking for Food

       Excellent customer                    Meaningful                            Rock-solid                       Empowered
              focus                          cooperative                             bank                           employees

                      Strong results

  +12%                 • 2018 net profit of € 3.0bn (+12%) supported by lower cost level and ongoing favorable economic environment
                       • Underlying profit before tax down by 6%; when adjusted for the increased level of impairment charges compared to
    (€ 3.0bn)            exceptionally low level in 2017, underlying profit slightly up
                       • Rabobank remains one of the highest rated commercial banks worldwide

                      Further strengthening capital and MREL position
CET1 ratio:            • CET1 capital increased, mainly due to retained earnings and despite negative impact of full adoption IFRS9

  16.0%                • Well positioned to meet future Basel IV and MREL requirements
                       • Inaugural Non-Preferred Senior transactions well received by investors

                      Continued strategic focus
                       • Balance sheet optimization continued in 2018, creating further growth opportunities
                       • Over 10,000 FTE reductions since 2015; staff reduction program well underway
                       • Realizing C/I target by 2020 unlikely due to investments in digitization & innovation and low interest rate environment
                       • Full commitment to further reduce cost base and Rabobank expects to meet C/I target in the midterm

Investor Relations                                                                                                                      7
Rabobank Investor presentation FY2018 results - 17 April 2019
Empowered employees
Highlights FY2018

                                              Growing a better world together

              Banking for the Netherlands                                                   Banking for Food

       Excellent customer                      Meaningful                           Rock-solid                         Empowered
              focus                            cooperative                            bank                             employees

                      Fit for future
                        • Promoting growth in craftsmanship, vitality and adaptability to ensure future fit employees
                        • Annual development budget stimulates employees’ personal and professional development
                        • Improved results of quarterly engagement scans show that employees like working at Rabobank

                      Diversity strong and improving
                        • Women well-represented in senior management positions (40% in Managing Board and 31% in first level below
                          Managing Board) and 44% in Supervisory Board
                        • Strong cultural diversity in young talent pool with 37% of the participants having a multicultural or international
                          background

                      #1 Employer in the Netherlands
                        • Readers of Intermediair (management magazine aimed at graduates and professionals) voted Rabobank as:
                          •   Most favorite employer to work for in the Netherlands
                          •   Fourth most attractive employer in the IT sector

Investor Relations                                                                                                                          8
Rabobank Investor presentation FY2018 results - 17 April 2019
Valuable progress on our financial targets

Ambitions 2020                                                              Results 2018 (2017)

       FL CET1 ratio             MREL             Cost/income ratio                FL CET1 ratio          MREL buffer          Cost/income ratio
                              requirement
         > 14%                 30.96%                     53-54%                      16.0%                28.25%                     65.9%
                                                                                     (15.5%)               (26.8%)                    (71.3%)

                Wholesale funding         Profitability                                     Wholesale funding         Profitability
                                             ROIC                                                                        ROIC
                   ~ € 150bn                 > 8%                                                € 153bn                 7.4%
                                                                                                (€ 160bn)               (6.9%)

Main developments
•   CET1 ratio further increased and well above target
•   With a MREL buffer of 28.25%, versus a 30.96% requirement, the additional MREL issuance is very manageable
•   Rabobank intends to maintain a best-in-class Tier 2 layer / total capital ratio protecting NPS holders. Total capital ratio of 26.6% at Dec 2018
    and will be trending towards ~24% in the coming years (subject to RWA developments)
•   Further progress in enhancing efficiency. C/I ratio down 5.4%-pnt, mainly due to ongoing headcount reduction
•   Acceleration of our investments in digitization and innovation as well as continued low interest rate environment will make realization of the
    C/I ambition in 2020 unlikely
•   Wholesale funding further reduced and at a level Rabobank feels comfortable with

Investor Relations                                                                                                                              9
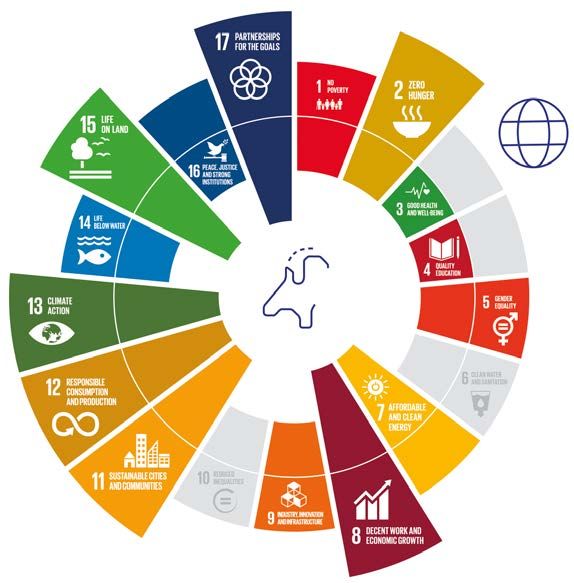
Rabobank Investor presentation FY2018 results - 17 April 2019
FY2018 Results
Solid growth net profit

Net profit (€ mn)
                                                                                 +12%

                                                                                             3,004
                                                                      2,674
                         2,214                                                               1.306
                                               2,024
                                                                      1.158
                          692
                                                1.027

                         1.522                                        1.516                  1.698
                                                                                                                   H2
                                                997
                                                                                                                   H1
                         2015                   2016                   2017                  2018

Main developments
• Strong increase in net profit despite low interest rate environment due to:
  • Lower operating expenses
  • Reduced impact of exceptional items
  • Third consecutive year of low impairment charges
• Business segments Domestic Retail Banking (+7%) and Wholesale, Rural & Retail (+21%) realized the strongest improvement
• At comparable FX rates net profit was 15% up

Investor Relations                                                                                                          11
Gross performance slightly improved

Underlying profit before tax (€ mn)
                                                                                            -6%
                                                        4,465
                                                                                                                      4,193
                                 3,979                                           380                    108
                                                          833                                                          287
          3,486
                                 1.261
           617

                                                         3.632                                                        3.906
          2.869                  2.718
                                                                                                                              Exceptional items
                                                                                                                              Operating profit before tax
          2015*                  2016*                   2017              ∆ Impairment              ∆ Gross          2018
                                                                              charges              performance
Exceptional items
 in € mn                                      2017      2018
 Fair value items                              -313      -115
 Derivatives Framework                          -51       -52
 Provision RNA                                 -310         0
 Restructuring costs                          -159       -120
 Total effect                                  -833      -287

* For a like-for-like comparison Athlon is included in the exceptional items up to, and including, its sale in 2016
Investor Relations                                                                                                                             12
Stable top-line development

Underlying income (€ mn)
                                                                                          1.39%                       1.41%
                              1.33%                         1.30%

                             13,014                        12,805
                                                                                         12,001                       12,020
                                                                                          1.556                       1.645
                                                                                          1.915                       1.931
                                                                                                                                        NIM 12m-rolling average
                                            12,470                        12,177                        12,314                 12,135   Other results
                                                                                                                                        Net fee & commission income
                                                                                          8.843                       8.559
                                                                                                                                        Net interest income
                                                                                                                                        Exceptional items*

                                                                                           -313                        -115
                              2015                          2016                          2017                        2018
Main developments
• Total income flat as downward trend in net interest income was offset by lower negative results on fair value items
• Rise in Other results positively impacted by the gain on sale of non-core activities, resulting from our balance sheet optimization strategy
• Underlying total income decreased by 1% due to lower net interest income
• At comparable FX rates total income was 2% up

* For a like-for-like comparison Athlon is included in the exceptional items up to, and including, its sale in 2016
Investor Relations                                                                                                                                      13
Good progress in reducing underlying costs

Underlying costs (€ mn)

                                                            8,594
                              8,145                                                       8,054
                                                                                           520                        7,446
                                                                                                                       172

                                                                                          3.062                       2.996

                                             7,588                         7,405                         7,534                7,274
                                                                                                                                      Exceptional items*
                                                                                          4.472                       4.278           Other opex
                                                                                                                                      Staff costs

                               2015                          2016                          2017                       2018

Main developments
• Staff costs continue downward trend mainly due to the major transformation of our domestic retail business
• Lower exceptional items, as the impact of legacy files and restructuring provisions is diminishing
• Underlying operating expenses declined by 3% due to reduced headcount and pension guarantee payments
• Underlying C/I ratio improved to 63.9% (from 65.3% in 2017)
• At comparable FX rates total operating expenses were 6% down

* For a like-for-like comparison Athlon is included in the exceptional items up to, and including, its sale in 2016
Investor Relations                                                                                                                                  14
Credit demand picking up again

Private sector loan portfolio, deposits and LtD (in € bn)
                   1.22                                1.21                               1.19                                  1.21
             425                                 411                                408                                   416

             119          348                                 341                                343                                   342
                                                 111                                109                                   120

             110                                 107                                106                                   106
                                                                                                                                             International Lending
                                                                                                                                             Other Domestic lending
             196                                 193                                193                                   190                Domestic Mortgages
                                                                                                                                             Deposits

           Dec 16                              Dec 17                            Jan 18*                             Dec 18

Main developments
• Domestic residential mortgage portfolio slightly down as new production was more than offset by early repayments and whole loan sales
• WRR loan exposure growth concentrated in F&A
• Leasing showed healthy growth in financial lease portfolio
• Real Estate exposure wound down, following the transfer of core CRE loans to DRB and WRR and the sale of FGH Bank’s non-core portfolio
• Total deposits increased by € 2.3bn, adjusted for run-off RaboDirect in Ireland

* Due to the adoption of IFRS 9 at 1 Jan. 2018 the loan portfolio declined by € 2.9bn and deposits increased by € 2.5bn
Investor Relations                                                                                                                                      15
Impairment charges remain low, albeit slowly
trending upward

Impairment charges (in € mn and in bps of average lending)
                           24 bps
                            1.033

                                                         7 bps
                                                                                                                  5 bps
                                                         310
                                                                                                                   190
                                                                                     -5 bps

                                                                                      -190

                            2015                         2016                        2017                         2018

Main developments
• Third consecutive year of low impairment charges
• Well performing Dutch economy led to net releases in Domestic Retail segment
• Elevated level of impairment charges at WRR Wholesale in H2 2018
• Leasing: stable impairment charges for third year in a row
• Impairment charges expected to slowly revert to the through-the-cycle level of 20 – 25 bps of the average loan portfolio

Investor Relations                                                                                                           16
Capital & Funding
CET1 ratio well above target and capital requirements

CET1 ratio development (fully loaded)
                                                                                   0.9%                                 16.0%
                                              15.5%
                            13.5%                                -0,1%                                -0,3%

          12.0%

        Dec 2015           Dec 2016          Dec 2017            IFRS 9         Profit minus          Other            Dec 2018
                                                                                distributions

Main developments
• CET1 ratio strengthened by 51 bps, driven by retained earnings and despite -14 bps IFRS9 impact
• Rabobank is solidly positioned for the manageable impact of Basel IV
• Rabobank is committed to its > 14% CET1 target and continues to further strengthen its CET1 base in anticipation of Basel IV

Investor Relations                                                                                                                18
Strong capital position provides significant buffer for
(Non) Preferred Senior holders

Total capital development (transitional)

                                                                              26.2%                       26.6%
                                                 25%
                     23.9%                                                                                                    T2
                                                                              7.4%                         7.1%
                                                 7.4%                                                                          AT1
                     6.8%
                                                                              3.0%                         3.5%               CET1
                     2.9%                        3.6%

                                                                             15.8%                        16.0%
                     13.5%                      14.0%

                  Dec 2015                     Dec 2016                     Dec 2017                     Dec 2018

Main developments
• Introduction of NPS gradually diminishes the role of Tier 2 as key instrument to meet MREL requirements
• Rabobank intends to maintain a best-in-class Tier 2 layer / total capital ratio protecting NPS holders
• Total capital ratio of 26.6% at Dec 2018 and will be trending downwards towards ~24% in the coming years (subject to RWA developments)

Investor Relations                                                                                                                   19
Rabobank solidly positioned for MREL requirement

MREL requirement (in % of RWA)

                                                                                  30.96%                                             PS
                                                           4.06%
                                  11.65%                                                        28.25%
                                                                                                                                     NPS
                                                                   8% TLOF                                                           MREL eligible
          15.25%                                                                                                                     capital

            LAA                     RCA                CBR including            Total MREL    MREL buffer*       MREL eligible
                                                        adjustments             requirement                     instruments**

Main developments
•   In 2018 Rabobank received a binding MREL requirement of 30.96% (~€ 65bn – FYE2016), based on BRRD I and the 2017 SRB MREL Policy
    framework
•   Future MREL requirement expected to reflect the 2018 SRB Policy (including removal of Basel I Floor) and eventually the BRRD2 framework
•   With MREL eligible instruments of >30.96%**, Rabobank already meets its MREL requirement
•   Rabobank intends to meet its MREL requirement with a combination of Own Funds and NPS only
•   With a MREL buffer of 28.25%, the additional MREL issuance is very manageable
•   NPS allows Rabobank to further strengthen and optimize its MREL buffer

* MREL buffer: Own Funds including amortized Tier 2 with a maturity > 1 year and NPS
** Under BRRD I Preferred Senior (PS) is MREL eligible and included in calculations
Investor Relations                                                                                                                    20
Limited MREL issuance in light of redemption profile

Role of NPS in MREL buffer (in € bn)                                          2019-2021 Preferred Senior maturity profile* (in € bn)

                  PONV                                Resolution

            Own funds: € 53.3bn                     2.1
                                    14.2
                                             15.6
                      6.9                                                                                                              17,7
     32.1                                                                                  17,1
                                                                                                                 15,2
                                                               13.7

     CET1             AT1           Tier 2          NPS    Preferred Senior                2019                  2020                  2021

MREL strategy                                                                 Issuance plans
• Rabobank’s substantial Own Funds (€ 53.3bn) provide a significant           • Rabobank successfully introduced NPS in 2018
  buffer for NPS investors                                                    • Senior unsecured redemptions (€ 50.0bn for the period 2019 -
• Introduction of NPS gradually diminishes the role of Tier 2 as key            2021) allow for further gradual refinancing into NPS to address
  instrument to meet MREL requirements                                          MREL needs
• Rabobank intends to maintain a best-in-class Tier 2 layer / total           • Based on current RWAs, the MREL shortfall (excluding senior
  capital ratio protecting NPS holders                                          unsecured) is limited
• Total capital ratio of 26.6% at Dec 2018 and will be trending               • Rabobank expects NPS issuance of € 3-5bn per annum, subject to
  downwards towards ~24% in the coming years (subject to RWA                    regulatory and peer group developments and taking into account
  developments)                                                                 expected Basel IV impact

* Including issuance under the 1y MTN program
Investor Relations                                                                                                                        21
Funding strategy: optimization and diversification

Overview annual issuances per product type (in € bn)                      Currency diversification

20
                                                                 NPS                             6%                              EUR
                                                                                            4%
                                                                 TLTRO                                                           USD
                                                                                       6%
15                                                                                                                               GBP
                                                                 Covered
                                                                                                                                 AUD
                                                                 Green           11%
                                                                                                                                 JPY
10                                                               Senior                                         53%              Other

    5
                                                                                     20%

0
        2015          2016          2017          2018

Funding strategy: global market approach
• Diversified wholesale funding mix achieved by tapping different markets, maturities, currencies and products
• Rabobank’s funding target for 2019 is € 10 – 12bn including € 3 – 5bn NPS (subject to balance sheet developments)
• Continued commitment towards strategic and liquid benchmark curve
• In line with Rabobank’s reduced wholesale funding requirement, it is likely that Rabobank remains a net negative issuer (also including NPS
  issuance)

Investor Relations                                                                                                                       22
Appendix I - Strategy
Excellent customer   Meaningful    Rock-solid   Empowered
           focus         cooperative     bank       employees

Next wave in transformation domestic operating model

                                                                                               14 regions of
                                                                                              6-7 Rabobanks

Operating model further optimized
• In December 2018 Rabobank successfully implemented its new operating model to further improve commercial effectiveness while at the
  same time safeguarding local presence
• 250 Market teams ensure customer intimacy through face-to-face contact, operating out of 90 banks supported by 14 regional specialist
  teams
• Rabobank started the phased implementation of a full agile organization
• As a further driver for simplification of client journeys, products and systems Rabobank launched Simplify@scale

Investor Relations                                                                                                                  24
Excellent customer   Meaningful         Rock-solid    Empowered
           focus         cooperative          bank        employees

Ongoing increase in client appreciation

Net Promotor Score (domestic market)

                                   NPS private banking customers                                                    61
                                   NPS retail customers                                                             57
                                   NPS business customers                                                           53

                           37
                           33

                           21
                            Dec 15                             Dec 16           Dec 17                         Dec 18

Excellent customer focus
• Committed to staying close to our customers, both digitally as well as via our branch network
• Improved customer service and digital convenience of our products boosted customer satisfaction
• For the third consecutive year this resulted in higher NPS scores
• Rabobank was named the "most client-friendly bank of the Netherlands" in April 2018 (CustomerFirst Awards)
• Strongest reputation among large Dutch banks (RepTrak)

Investor Relations                                                                                                       25
Excellent customer     Meaningful         Rock-solid   Empowered
        focus           cooperative          bank       employees

Our digital transformation is driven by three ambitions

        1             Data-driven digital banking

  “To increase the digital adoption of our clients, further development of our Open Banking capabilities
                                 and the leverage of data and analytics”

        2             Innovation in and beyond banking

         “To innovate for and with our clients, highly engaged in (inter)national start-up and innovation
                                                  communities”

        3             Agile organization and technology

                                      “To implement a fully agile organization and modern IT landscape”

Investor Relations                                                                                        26
Excellent customer   Meaningful    Rock-solid   Empowered
        focus         cooperative     bank       employees

Data-driven digital banking
Highlights FY2018

             Adoption of digital
              is accelerating                               Further expansion on
                                                             Open Banking capabilities             Leverage data and
                                                                                                    analytics to improve service

 • 11% increase in our active mobile                • Launch of the Open Banking              • Personalization of webpages
      banking customers, leading to just                 Developer Portal                       based on customer insights
      under 4mn active customers
                                                    • Preparation for PSD2 launch in          • Data driven dashboard to improve
 • > 70% digital banking customers                       H2 2019                                client advice at branches
 • 7-fold increase in use of Rabobank               • World’s first bank-account              • Pilot categorization of
      Payment Request                                    integration with Google Assistant,     transactions to improve client’s
                                                         by using AI and voice technologies     insight into spending behaviour

Investor Relations                                                                                                            27
Excellent customer   Meaningful    Rock-solid   Empowered
        focus         cooperative     bank       employees

Innovation in and beyond banking
Highlights FY2018

                                                             Highly engaged in start-up
             We continue to deliver
              innovations for our clients                   and innovation communities &
                                                             ecosystems
                                                                                                   Expansion of Rabo Frontier
                                                                                                    Ventures Fund to € 150mn

 • Rabobank innovation SurePay                      • Actively involved in > 60               • Investment in JoinData, a data
      (IBAN NameCheck) available for all                 incubators and accelerators in the     platform to share, re-use and
      big Dutch banks, resulting in less                 Netherlands                            combine agri data
      payment fraud and misdirection
                                                    • Actively involved with 44% of all       • Participation in commodity trade
 • Launch of We.Trade, a blockchain                      start-ups in the Netherlands           & finance blockchain platform
      based solution for international                                                          Komgo
                                                    • Expansion of FoodBytes!, our food
      trade transactions
                                                         & agtech innovation platform         • Investment in ProducePay, an
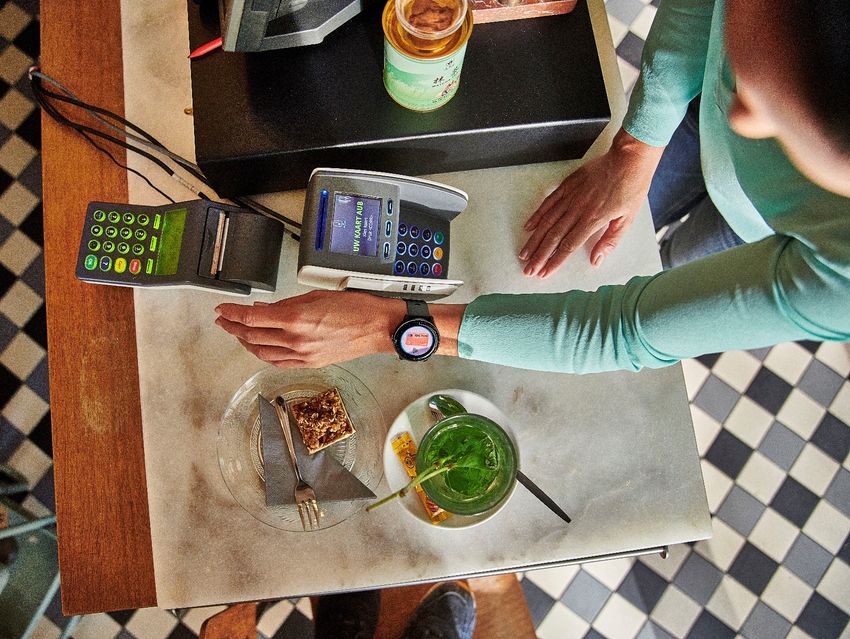
 • Garmin Pay smartwatch payments                        supporting > 1,800 start-ups           international and real-time insights
                                                                                                and trading platform

Investor Relations                                                                                                              28
Excellent customer   Meaningful    Rock-solid   Empowered
        focus         cooperative     bank       employees

Agile organization and technology
Highlights FY2018

             Phased implementation of
              full agile model                              Modernizing and
                                                             rationalizing IT landscape          Close collaboration with
                                                                                                  tech start-ups

 • Scaling up the agile model for the               • Implementation of a new digital       • Integration of mobile
      Domestic Retail Banking                            core banking platform for our        identification in the Banking App
      organization from                                  wholesale franchises
                                                                                            • Implementation of > 100 robots in
      ~ 500 FTE to > 3,000 FTE
                                                    • Implementation of Pega and              production
 • Digital programs started for the                      Google Analytics 360 in order to
                                                                                            • Launch of video chat for > 2,000
      wholesale and rural franchises                     boost digital marketing & sales
                                                                                              advisors, one of the largest in the
                                                         capabilities
 • Professionalization of our global                                                          Netherlands
      innovation approach                           • Use of public Cloud increased by
                                                         50%

Investor Relations                                                                                                           29
Excellent customer   Meaningful     Rock-solid    Empowered
        focus         cooperative      bank        employees

Sustainability is in our DNA

              Sustainably Successful Together                        Sustainability within Rabobank

 •    Contributing to welfare and prosperity in                •   Sustainability Policy Framework
      the Netherlands and to feeding the world                 •   Implementation of policy in our credit
      sustainably                                                  approval process
 •    Strengthening our customers and their                    •   Sustainability embedded in portfolio,
      communities to achieve these objectives                      business and through partnerships
                                                               •   Sustainability is integrated in MB KPIs
                                                               •   Implementation of the UN Sustainable
                                                                   Development Goals (SDGs)

             Dedicated to address climate
              change challenges                                       Leading ESG ratings

 •    Rabobank participates in two working                     •   ESG Risk Rating
      groups (‘klimaattafels’) of Dutch National                   Score: 9.5/100
      Climate Agreement:                                           Negligible ESG Risk
      •     Agriculture & Land Use                                 Position 1/294
      •     Built Environment                                  •   ESG Rating
                                                                   Score: 89/100
 •    We are actively involved in climate impact                   Industry ESG Leader
      measurement methodologies                                    Position: 2/338 (March 2019)

Investor Relations                                                                                         30
Excellent customer   Meaningful    Rock-solid   Empowered
        focus         cooperative     bank       employees

We invest in the local and global community
Sustainability within Rabobank

             Increasing sustainability of
              our mortage portfolio                         Rabobank is a
                                                             sustainability leader            Partnerships & SDGs

 • Green Mortgage and Green                         • € 46bn in Sustainable Finance      • Rabobank and UN Environment
      Construction Depot as incentive                    and Rabobank is a leading         partnership (AGRI3 Fund) to boost
      for clients to invest in energy-                   renewable energy projects         sustainable land use
      saving measures for their homes                    financier
                                                                                         • Rabobank’s mission fits naturally
 • Partnership to support clients’                  • Rabobank was first to launch an      within the UN Sustainable
      transition to local sustainable                    ESG Leader CP/CD program          Development Goals (SDGs)
      energy providers                                   (€ 5bn)
                                                                                         • In cooperation with WWF and
 • Energy label of mortgage portfolio               • Rabobank mandated for several        Friesland Campina, Rabobank
      improved                                           Sustainable Revolving Credit      developed a Biodiversity Monitor
                                                         Facilities                        and participates in Deltaplan
 • Pension fund ABP to invest
                                                                                           Biodiversity
      €500mn in green mortgages issued              • Introduction of Circular Economy
      by Rabo label Vista                                financing guidelines

Investor Relations                                                                                                       31
Excellent customer   Meaningful    Rock-solid          Empowered
           focus         cooperative     bank              employees

Sustainability integrated in credit approval process
Sustainability within Rabobank

Client engagement process
                                                                       1
                                                                             Sustainability
                                                                               analysis

                                       4            Follow-up:                                 2 A (potential) client
                                                    Action plan                               is rated in a Client Photo

                                                                       3
                                                                           Client engagement
Main developments
• Bi-annually Sustainability Policy Framework update (including Exclusion List)
• Active client engagement aimed at improvements in their businesses
• Assessment of sustainability performance of potential and current business clients integrated in credit approval and monitoring processes:
  • Sustainability performance of clients with an exposure > € 1mn is measured in a Client Photo, ranking from A-D
  • 24% of Wholesale clients and 5% of Local Rabobank clients received highest rating
• Top spot in Sustainalytics’ global sustainability ranking shows that our strategy of integrating sustainability in credit processes is successful

Investor Relations                                                                                                                            32
Excellent customer   Meaningful    Rock-solid     Empowered
           focus         cooperative     bank         employees

Our mission fits with UN Sustainable Development Goals
Sustainability within Rabobank

•     Our mission ‘feeding the world sustainably and
      promoting welfare and prosperity in NL’ fits naturally
      within the UN Sustainable Development Goals (UN SDGs)
•     Rabobank integrates sustainability into day-to-day work by
      providing financial solutions, advice and by connecting
      clients
•     Sustainability is used for internal steering and target setting
•     Reported on in separate theme report

Investor Relations                                                      33
Excellent customer   Meaningful             Rock-solid      Empowered
           focus         cooperative              bank          employees

Staff reduction program well underway

FTE development Rabobank Group

                                                       -6,500
                                       52,000

                                                                               -1,750
                                                                      45,500                     -1,900
                                                                                        43,750

                                                                                                             41,850

                                       Dec 15                         Dec 16            Dec 17               Dec 18

Main developments
• We remain committed to our staff reduction program of 12,000 FTE
• Since announcement in 2015 reduction of well above 10,000 FTE realized
• Reduction mainly (to be) realized in the domestic retail business
• (temporary) Staff increases to handle legacy files, implement new regulations and as a result of business growth

Investor Relations                                                                                                    34
Excellent customer   Meaningful    Rock-solid   Empowered
        focus         cooperative     bank       employees

Creating room for further growth of the bank
Active portfolio management contributes to a rock-solid balance sheet

             Funding diversification
                                                                   Balance sheet flexibility

 • Decreasing funding costs via collateralized               • Creating room for new origination by allowing
      lending                                                   investor participation
 • € 8bn raised through Covered Bond program                 • More than € 6bn of mortgage portfolios sold
      since launch in May 2017                                  since March 2016
 • € 2bn of DLL ABS issued since November 2017               • € 5bn of capital relief transactions structured
                                                                with external investors since November 2017

             Balance sheet optimization                           Strengthening capital base

 • Reduction of non-core activities (e.g. disposals          • Rabobank is well positioned to absorb the
      of Athlon, Bouwfonds, FGH Bank etc.)                     fully loaded impact of Basel IV
 • Making room for new strategic initiatives                 • € 2.25bn, $ 1.25bn and JPY 72bn of NPS
                                                               (MREL eligible) bonds issued since 2018

Investor Relations                                                                                          35
Excellent customer   Meaningful           Rock-solid              Empowered
        focus         cooperative            bank                  employees

Optimization of Rabobank’s balance sheet is on track
Creating room for further growth of the core operations of the bank

Non-exhaustive selection of balance sheet initiatives
                                              2016 - 2017                                                             2018                                                 YTD 2019


Funding
                            Inaugural
                             € 500mn
                           Green Bond
                                              Launch of € 25bn
                                               Covered Bond
                                                 program
                                                                         $ 500mn asset
                                                                        backed securities
                                                                                             $ 824mn asset
                                                                                            backed securities
                                                                                                                 € 1.25bn FORDless
                                                                                                                     STORM and
                                                                                                                   € 550mn Green
                                                                                                                                       $ 1.0bn asset
                                                                                                                                     backed securities
                                                                                                                                                          $ 500mn asset
                                                                                                                                                         backed securities

                                                                                                                    STORM 2018
diversification


Balance sheet
                            € 1.0bn
                           mortgage
                          portfolio sale
                                               € 3.0bn capital
                                              relief transaction
                                                                            € 600mn
                                                                           mortgage
                                                                          portfolio sale
                                                                                             € 2.0bn capital
                                                                                            relief transaction
                                                                                                                     € 780mn
                                                                                                                    mortgage
                                                                                                                   portfolio sale
                                                                                                                                         € 1.0bn
                                                                                                                                      subscription of
                                                                                                                                           APG
                                                                                                                                                             € 740mn
                                                                                                                                                            mortgage
                                                                                                                                                           portfolio sale

flexibility


Balance sheet
                         € 1.1bn sale of
                        Athlon Car Lease
                                                    Sale of
                                                  remaining
                                                 Robeco stake
                                                                           Sale of Van
                                                                         Lanschot stake
                                                                                                 Sale of
                                                                                            substantial parts
                                                                                             of Bouwfonds
                                                                                                                    Sale of BPD
                                                                                                                     Marignan
                                                                                                                                      Sale of € 1.3bn
                                                                                                                                      CRE portfolio
                                                                                                                                                          $ 2.1bn sale of
                                                                                                                                                            Rabobank
                                                                                                                                                             National
                                                                                                                                                                                      € 800mn sale of
                                                                                                                                                                                     former ACC loan
                                                                                                                                                                                         portfolio
                                                                                                                                                           Association
optimization
                                                                                                                                                             National Association


Strengthening
                          € 1.25bn perp
                          AT1 securities
                              (coco)
                                                    $ 1.5bn
                                                 10-year Tier 2
                                                     notes
                                                                             € 1.5bn
                                                                           Rabobank
                                                                           Certificates
                                                                                            € 1.0bn perp AT1
                                                                                                 Capital
                                                                                                Securities
                                                                                                                 Inaugural € 1.0bn
                                                                                                                       NPS
                                                                                                                  (MREL eligible)
                                                                                                                                       $ 1.0bn NPS
                                                                                                                                      (MREL eligible)
                                                                                                                                                           € 1.25bn NPS
                                                                                                                                                          (MREL eligible)
                                                                                                                                                                                          ¥ 63.5bn NPS
                                                                                                                                                                                         (MREL eligible)

capital base

 Investor Relations                                                                                                                                                                 36
Excellent customer     Meaningful    Rock-solid      Empowered
           focus           cooperative     bank          employees

Well positioned to absorb impact of Basel IV

Estimated RWA impact of Basel IV                                              Key tools to mitigate Basel IV impact

                         30-35%
                                                                                        Optimization
                                                                                                              Asset
                                                                                         of product
                                                          < 30%                                            distribution
                                                                                        and portfolio
                                                                                                           possibilities
                                                                                             mix

                                                                                                      Data
                                                                                                                           Repricing
                                                                                                  improvement

       RWA impact before mitigation             RWA impact after mitigation

Basel IV RWA impact below 30%
•     Strong capital position provides a good starting point to absorb the fully loaded impact of Basel IV
      • Estimated RWA inflation unchanged compared to previous disclosures, as our risk profile has not materially changed
      • Identified mitigating actions could limit ultimate Basel IV RWA impact to below 30%
      • Actual impact can change due to TRIM, the implementation of the proposals into European law, continued portfolio optimization and
         further refinement of impact assessments

Investor Relations                                                                                                                     37
Appendix II – P&L and loan portfolio
Credit ratings remained strong in 2018

           #1 in the Netherlands                                                        #3 in Europe                                                       #12 Globally

Based on the average rating score assigned by Fitch, Moody’s and S&P (January 2019) of the world’s 60 largest commercial banks (the Banker, July 2018), plus major Dutch banks

  Rating                   Long term            Short term
                                                                            Outlook                       PS                      NPS                        T2                  AT1
  Agency                     rating               rating

                                A+                   A-1                   Positive                      A+                       A-                      BBB+                    -

                               Aa3                   P-1                    Stable                       Aa3                      A3                       Baa1                  Baa3

                               AA-                   F1+                    Stable                      AA-                      AA-                         A                   BBB-

                                AA               R-1(high)                  Stable                       AA                        -                         -                    -

Investor Relations                                                                                                                                                                    39
Profit & Loss account

Profit & Loss account

 In € mn                        2017     2018    Change

 Net interest income            8,843    8,559      -3%

 Net fee & commission income    1,915    1,931         1%

 Other results                  1,243    1,530     23%

 Total income                  12,001   12,020      0%

 Operating expenses             8,054    7,446     -8%

 Regulatory levies               505      478       -5%

 Impairment charges              -190     190           -

 Operating profit before tax    3,632   3,906       8%

 Tax                             958      902      -6%

 Net profit                    2,674    3,004      12%

Investor Relations                                40
Resilient net interest income

Net interest income (in € mn) and net interest margin (in % of average balance sheet total)
                                                                            1.39%                    1.41%
                        1.33%                     1.30%

                                                                                                                            Net interest income
                         9.139                    8.835                     8.843                     8.559                 NIM 12m-rolling average

                         2015                      2016                     2017                      2018

Main developments
• Net interest income (NII) down 3% as impact of low interest rate environment was partly offset by robust margins from repricing effects and
  new business
  • DRB: NII stable, as positive impact from higher margins on lending and increased volume of payment accounts was offset by a high
     volume of early interest rate revisions in our mortgage book and lower margins on savings and payment accounts
  • WRR: NII up 1%, with resilient underlying commercial margins
  • Leasing: NII down 2% due to somewhat lower margins on new business
  • Real Estate: NII negligible due to the transfer of FGH Bank’s core portfolio to DRB and WRR and the sale of its non-core portfolio
• NIM mainly improved due to a lower average balance sheet total, which outpaced the decrease of NII

Investor Relations                                                                                                                      41
Underlying performance by business segment (I)

Domestic Retail Banking (DRB)                                          Wholesale, Rural & Retail (WRR)
                  +8%
                                                                                          -20%
                            2,868                                               1.307
       2,658
                             121                                                308                  1.050
        103
                                                                                                       7

       2.555                2.747
                                                                                999                  1.043

        2017                2018                                                2017                 2018
     Exceptional items       Operating profit before tax                     Exceptional items        Operating profit before tax

Main developments DRB                                                  Main developments WRR
• Total income increased by 1%, fully driven by higher non-interest    •   Corrected for the appreciation of the euro, total income increased
  income                                                                   by 1% and operating expenses decreased by 14%
• Digitization and centralization of services are driving operating    •   At comparable FX rates NII was up 7%, more or less in line with loan
  expenses down (-5%)                                                      portfolio growth
• Impairment releases contributed to operating profit (€ 150mn), but   •   Profit improvement offset by € 205mn higher impairment charges,
  to a lesser extent than in 2017 (€ 259mn)                                which are still well below long term average
• Loan portfolio slightly down due to continued early mortgage         •   Underlying operating profit before tax decreased by 20% as 2017
  repayments and whole loan sales                                          result was understated due to RNA provisioning
                                                                       •   Growth loan portfolio mainly in Food & Agri sector

Investor Relations                                                                                                                     42
Underlying performance by business segment (II)

Leasing                                                                Real Estate
(in € mn)          +15%                                                                     -3%

                              505                                               398                     386
            438                7                                                 29                      8

            439               498                                               369                     378

             -1
                                                                                2017                   2018
            2017             2018
      Exceptional items       Operating profit before tax                   Exceptional items       Operating profit before tax

Main developments Leasing                                              Main developments Real Estate
•   Total income up 6%, driven by reversal of an impairment taken in   • Real Estate segment comprises BPD, Bouwfonds IM (BIM) and
    2017                                                                 (until mid-2018) FGH Bank
•   Slightly higher operating expenses due to business growth          • Downscaling of activities at FGH Bank and BIM affected
•   Impairment charges remained stable and well below long-term          performance, but this was compensated by strong results at BPD
    average                                                            • Segment benefited from book profits on both sale of FGH Bank’s
•   Total lease portfolio grew by 9%                                     non-core portfolio and sale of BPD Marignan
•   Outlook positive for Leasing due to the shift to a ‘pay for use’   • Impairment charges contributed to operating profit, but to a much
    economy                                                              lesser extent than in 2017

Investor Relations                                                                                                                  43
Further decrease in stock of non-performing loans

NPL development*
(in € mn and in % of total loans & advances)
                         3.6%                 3.4%                 3.5%                   3.8%                       3.5%
                        19.763                                                           20,215
                                             18.873               18.315                                           18.436
                                                                                          1.900      1.779

                        Dec 15               Dec 16               Dec 17                 Jan 18   Decrease NPL      Dec 18
Main developments                                                                                     stock

• € 1.9bn one-off increase in NPL stock at 1 January 2018 as a result of prudent early adoption of EBA ‘Definition of Default’ for our residential
  mortgages and SME Retail portfolios
• NPL stock on a downward trend as a result of the favorable economic environment and the sale of non-core CRE exposure
• NPL stock further affected by:
  • Prudent write-off policy
  • Helping clients with ample prospects getting through tough times
  • Non-core CRE portfolio (ACC Ireland): excluding this portfolio NPL ratio would be 3.2%
• Relatively sizeable well collateralized portfolios, which are generally characterized by high cure and recovery rates
* NPL includes both Stage 3 Loans & Advances and NPL in Financial Assets at Fair Value
Investor Relations                                                                                                                          44
Credit quality loan portfolio further improved

Impairment allowances                                                     Impairment allowances
(Group, stages 1, 2 & 3, € mn)                                            (Business segments, stages 1, 2 & 3, € mn)
          5.594
                                                         Stage 1                              268 7                                 DRB

                         4,517                           Stage 2                                                                    WRR (incl Other)
                                        3,873            Stage 3                                                                    Leasing
                                                         Total                                                                      Real Estate

                                                                                  1,330       € 3,873mn
                                                                                                                2,267

          Dec 17         Jan 18        Dec 18

Main developments
• Declining levels of NPL and impairment allowances, and low impairment charges evidence of continuing improvement of credit quality of our
  loan portfolio
• One-off decrease in impairment allowances of € 1.1bn as a result of adoption of IFRS 9 on 1 January 2018
• NPL coverage ratio (excluding Stage 1 & 2 allowances) decreased to 22% from 24% (1 Jan 2018). NPL coverage ratio affected by:
  • sale and write-offs of highly provisioned loans (including non-core CRE)
  • relatively sizeable portfolios in NPL stock, which are well collateralized and generally characterized by high cure rates and high recovery rates
  • positive economic outlook, which enables higher expected collateral values
  • tradition of collateralized lending, favored by effective Dutch legal system

Investor Relations                                                                                                                         45
Diversified loan portfolio with focus on the Netherlands

Domestic private sector loan portfoli0         International private sector loan portfolio

                        6% 1%

                                                               24%
                13%

                                                                                        44%
       7%
                         € 296bn                                      € 120bn

           9%                            64%

                                                                32%

     Mortgages        Other SME                    Wholesale
     F&A Retail       Wholesale                    Rural & Retail
     CRE              Leasing                      Leasing

Investor Relations                                                                            46
Well diversified international loan portfolio

International Wholesale loan portfolio               International Rural & Retail loan portfolio

                                                                             1%

                                             29,2%
          32,0%

                                                            44%                                44%
                         € 53bn                                            € 38bn

          0.4%

                                             15,7%
                 14,6%

                                8,1%                                          11%

     North America       Asia                            North America
     South America       Africa                          South America
     AU & NZ             Europe (excl. NL)               AU & NZ
                                                         Asia

Investor Relations                                                                                   47
Consistently strong-performing domestic residential
mortgage portfolio (I)

Portfolio by type of mortgage                                              Portfolio by contractual fixed interest rate period
                                                  Interest only                                                      >10 Years
               7%                                                                             4%
                                                  Partial interest only               1% 4%                          6-10 Years
                           25%                    Redeeming                      8%                                  4-5 Years
     20%                                                                                               31%
                                                  Savings                                                            2-3 Years
                                                  Other                                                              Fixed
Consistently strong-performing domestic residential
mortgage portfolio (II)

                                                                                                                                            Change Dec 17 – Dec
 in € mn                                                                Dec 2017                  Jan 2018*                   Dec 2018
                                                                                                                                                             18

 Loans                                                                    193,110                    193,110                      190,008                  -2%

 Non-performing loans                                                       1,112                      2,912                        2,057                 -29%

  −    in % of loans                                                       0.58%                       1.51%                       1.08%            -0.43%-pnt

 Allowance                                                                    169                         333                        209                  -37%

  −    in % of non-performing loans                                          15%                         11%                         10%               -1%-pnt

                                                                                                                                                       Change
                                                                             2017                                                   2018
                                                                                                                                                    2017 –2018

 Net additions                                                                  12                                                    -29              -€ 41mn

 In basis points                                                            1 bps                                                  -2 bps                -3 bps

* NPL and allowances increased at 1 Jan. 2018 due to the implementation of a new definition of default. See also previous slide

Investor Relations                                                                                                                                       49
Loan-to-value mortgage portfolio decreased further

LTV domestic residential mortgage portfolio
Loan-to-value                                       NHG Guaranteed                                   Other                                 Total
0%-50%                                                             3.0%                              28.3%                                 31.3%
50%-60%                                                            2.0%                              11.0%                                 13.1%
60%-70%                                                            3.0%                              11.3%                                 14.3%
70%-80%                                                            4.1%                              10.5%                                14.6%
80%-90%                                                            3.9%                               9.2%                                 13.0%
90%-100%                                                           2.4%                                5.3%                                 7.7%
100%-110%                                                          0.6%                               2.2%                                  2.8%
110%-120%                                                          0.2%                               0.9%                                  1.1%
>120%                                                              0.2%                               1.9%                                  2.1%
                                                               19.4%                                 80.6%                               100.0%

LTV is not the sole determinant of loan quality
• Average LTV portfolio Dec 2018: 64% (Dec 2017: 69%)                     • To cover premature death risk, the majority of borrowers have taken
• Prudent underwriting standards, including a loan expenses-to-             out life insurance, pledged to the bank
  income ratio and active risk monitoring are the most important          • Some borrowers have taken out insurance to cover unemployment
  factors determining the risks in the mortgage portfolio                 • LTV > 100% does not mean that loan is non-performing. As long as
• LTV figures do not take into account free savings accounts,               borrower is able to meet debt service, collateral value is less relevant
  securities and other assets of borrowers                                • Share of mortgages with an LTV > 100%: 6% at Dec 2018

Investor Relations                                                                                                                        50
Commercial real estate lending: lower exposure,
improving asset quality

Development domestic commercial real estate lending                 Breakdown of domestic CRE loan portfolio
(in € bn)
     28                                                                                                            Offices & mixed use
                                                                                16%
                      24               23                                                      26%
                                                                                                                   Residential
                                                       21                                                          Retail outlets
                                                                          4%
                                                                                                                   Industrial

                                                                         13%          € 21bn                       Land
                                                                                                                   Other

                                                                                               25%
                                                                               16%

    Dec 15           Dec 16          Dec 17           Dec 18

Main developments
• CRE financing includes the aggregate exposure of our DRB, WRR and Real Estate business segments to domestic CRE
• CRE exposure being actively managed down (2018: -7%; 2017: -4%; 2016: -15%)
• Improving real estate market is reflected in decreasing LTVs, NPL level and impairment allowances
• LTV of domestic lessors of real estate (i.e. buy-to-let) loan portfolio further improved, mainly due to the further
  reduction of non-core exposure and improved market conditions
• In 2018 FGH Bank sold the final part of its non-core loan portfolio to RNHB (deal size: € 1.3bn)
• FGH Bank merged with Coöperatieve Rabobank U.A. on 30 June 2018

Investor Relations                                                                                                                  51
Well diversified business lending
By subsectors, geography and links in the chain

Group F&A portfolio                                                   Group non-F&A portfolio

                                          Animal protein                                      11%               Lessors of real estate
           16%             19%            Grains & oilseeds                    25%                              Finance & insurance (except banks)
                                          Dairy                                                      12%        Trade
    11%                                   Fruit & vegetables                                                    Professional services
             € 103bn                      Farm inputs                     4%             € 118bn                Manufacturing
    3%                                                                                                   10%
                                 22%      Food retail & foodservice       4%                                    Activities related to real estate
    3%
      5%                                  Beverages                            6%                               Transport and warehousing
                                                                                                    8%
                                          Sugar                                     5%                          Health care
           11%       10%                                                                      8%
                                                                                         8%
                                          Other                                                                 Construction
                                                                                                                Retail non-food
                                                                                                                Other
F&A portfolio                                                         Non-F&A portfolio

• € 103.1bn (+2%), 25% of total Group loan portfolio, of which:       • € 118.0bn (+5%), 28% of total Group loan portfolio, of which:
  • Domestic retail SMEs: € 26.1bn                                      • Domestic retail SMEs: € 57.7bn
  • WRR: € 66.5bn                                                       • WRR: € 40.4bn
  • Leasing: € 10.5bn                                                   • Leasing: € 19.9bn
• Domestic primary F&A market share around 85%                        • Mainly SME lending

Investor Relations                                                                                                                       52
Appendix III – Capital & funding
Strong capital buffer over SREP requirements

2019 SREP requirement (in %)
                                                                                       16.0%
                                                                                                                     >14%
                          11.75%

              SRB           3%

              CCB          2.5%
              P2R          1.75%

               P1          4.5%

                       Fully phased in                                           CET1 ratio Dec 2018               Target 2020
                     requirement 2019

CET1 requirement
•    Following the 2018 SREP Rabobank has to meet a fully loaded CET1 requirement and MDA trigger of 11.75% as of 1 March 2019
•    The undisclosed Pillar 2 Guidance (P2G) is not directly binding and not relevant for the MDA trigger

Targets
 •   Rabobank is committed to its > 14% CET1 target
 •   Current (fully loaded) CET1 ratio of 16.0% implies a substantial buffer of 4.25%-points (€ 8.52bn) over 2019 minimum CET1 requirements
 •   Rabobank’s Distributable Items amounted to € 27.3bn at Dec 2018

Investor Relations                                                                                                                    54
CRD IV qualifying capital and MREL buffer

in € bn                                     Dec 2017   Jan 2018   Dec 2018

Common Equity Tier 1 capital                    31.3       30.5          32.1

Tier 1 capital                                  37.2       36.7          39.1

Total capital                                   51.9       51.6          53.3

Risk-weighted assets                           198.3      198.2      200.5

Common Equity Tier 1-ratio (transitional)     15.8%      15.4%      16.0%

Common Equity Tier 1-ratio (fully loaded)     15.5%      15.4%      16.0%

Tier 1-ratio                                  18.8%      18.5%      19.5%

Total capital ratio                           26.2%      26.0%      26.6%

MREL buffer                                   26.8%      26.6%     28.25%

Equity Capital ratio                          17.3%      17.0%      17.7%

Leverage ratio (transitional)                  6.0%       6.0%       6.4%

Leverage ratio (fully loaded)                  5.4%       5.4%       5.9%

Investor Relations                                                  55
CET1 capital: Rabobank Certificates

Breakdown CET1 capital

    in € mn                                                           Dec 2017                       Jan 2018                     Dec 2018
    Retained earnings                                                     26,777                       26,302                        28,062
    Expected distributions                                                   -54                          -54                           -46
    Rabobank Certificates                                                  7,440                        7,440                         7,445
    Non-controlling interests                                                26                            26                              0
    Reserves                                                              -1,440                         -911                          -798
    Deductions                                                            -2,050                       -2,317                        -2,553
    Transitional Guidance                                                   525                            24                              12
    CET1 Capital                                                          31,263                       30,510                        32,122

Rabobank Certificates                                                 Distributions
• Rabobank Certificates are the most deeply subordinated capital of   •   Distributions on Rabobank Certificates are fully discretionary
  Rabobank and qualify as CET1 capital                                •   As per the current payment policy, Rabobank intends to pay a
• In January 2017 Rabobank issued 60mn new Rabobank Certificates          quarterly distribution which is the higher of:
  with a nominal value of € 25 each                                       • € 0.40625 (6.5% on annual basis)
• The total outstanding number of Rabobank Certificates is                • the 3-month average on an annual basis of the effective return
  297.9mn, representing € 7.4bn of CET1 capital                              on the most recent 10 year Dutch state loan +150 bps calculated
• Rabobank Certificates are listed on Euronext Amsterdam                     based on a nominal value of € 25.00 divided by 4

Investor Relations                                                                                                                    56
Overview of Additional Tier 1 instruments

Additional Tier 1 Capital (Public)
                                                                 1st call                                                                        1st call
                      Nominal           Coupon    Issue date                                      Nominal     Coupon           Issue date
                                                                   date                                                                            date

CRD IV Compliant AT1                                                        Grandfathered AT1

Capital Securities    EUR 1bn           4.625%    Sep 2018     Dec 2025                                       applicable 5-yr
                                                                            Capital Securities NZD 280mn                        May 2009    Jun 2019
                                                                                                              swap rate + 3.75%

Capital Securities    EUR 1.5bn         5.50%     Jan 2015     Jun 2020     Capital Securities USD 2.9bn      11%              Jun 2009     Jun 2019

Capital Securities    EUR 1.25bn        6.63%     April 2016   Jun 2021     TPS IV           GBP 350mn        5.56%            Oct 2004     Dec 2019

                                                                            Capital Securities GBP 250mn      6.91%            Jun 2008     Jun 2038

CRD IV compliant instruments                                                Grandfathered instruments
• At Dec 2018 € 3.75bn of CRD IV compliant instruments outstanding          • At Dec 2018, all grandfathered instruments (€ 3.4bn) qualified as AT
• The temporary write down capital securities have a dual trigger of 7%       1 capital
  CET1 ratio on Rabobank Group and 5.125% CET1 ratio on Issuer level*       • During 2018 Rabobank redeemed the CHF 5.5% Capital Securities,
• Dutch government abolished article 29a of Corporate Income Tax              and ILS 323mn of Capital Securities at their first call dates
  Code as of 1 January 2019, resulting in the coupon on the 5.5% and
  6.625% Capital Securities no longer being tax deductible
• Rabobank does not intend to exercise a Tax Call in respect of these
  instruments
• The abolishment of tax deductibility does not trigger any change in
  the role of AT1 instruments in our capital strategy

* Dec 2018: actual CET1 on Issuer level = 16.0%
Investor Relations                                                                                                                          57
Tier 2 instruments totaling € 16.5bn

Tier 2 instruments
Tier 2 issues    Coupon            Issue date       Maturity         Call date   Tier 2 issues   Coupon       Issue date   Maturity     Call date
EUR 1bn         5.88%              May 2009         May 2019                     GBP 1bn         4.63%        May 2014     May 2029
EUR 1bn         3.75%              Nov 2010         Nov 2020                     JPY 50.8bn      1.42%        Dec 2014     Dec 2024
EUR 1bn         4.13%              Sept 2012        Sept 2022                                    3m BBSW* +
                                                                                 AUD 475mn                    July 2015    July 2025    July 2020
GBP 500mn       5.25%              Sept 2012        Sept 2027                                    2.5%

USD 1.5bn       3.95%              Nov 2012         Nov 2022                     AUD 225mn       5.00%        July 2015    July 2025    July 2020

EUR 1bn         3.88%              July 2013        July 2023                    USD 1.5bn       4.38%        Aug 2015     Aug 2025

USD 1.75bn      4.63%              Nov 2013         Dec 2023                     USD 1.25bn      5.25%        Aug 2015     Aug 2045

USD 1.25bn      5.75%              Nov 2013         Dec 2043                     USD 1.5bn       3.75%        July 2016    July 2026

EUR 2bn         2.50%              May 2014         May 2026         May 2021    USD 500mn       4.00%        March 2017   April 2029   April 2024

Tier 2
• All Tier 2 instruments are CRD IV compliant
• Qualifying Tier 2 represents 7.1%-point of the total capital ratio (including transitional adjustments)
• € 2,218mn of Tier 2 is subject to amortization. € 1,295mn of the amortized Tier 2’s have a remaining maturity > 1 yr and therefore fully qualify
  for MREL
• Rabobank intends to maintain a best-in-class Tier 2 layer protecting NPS holders
• Total capital ratio of 26.6% at Dec 2018 and will be trending downwards towards ~24% in the coming years (subject to RWA developments)

* Bank Bill Swap Benchmark Rate (Australian Financial Markets Association)

Investor Relations                                                                                                                         58
Rabobank liquidity strategy

 Cash remains a major component of HQLA                                         Maturity profile short term debt (in € bn)
                1%                                                              15
                 2%
        17%
                                               Cash and CB reserves
                                               Other level 1                    10
                                               Level 2a
                                               Level 2b                         5

                           80%                                                   -

 Liquidity strategy
 • LCR (135%) and NSFR (119%) well above 100%                               • Rabobank aims to have an optimal blend of different funding sources
 • Rabobank manages Group’s liquidity positions according to                  for effective management of its liquidity position
   internally defined risk framework and external regulatory                • Rabobank maintains smooth funding maturity profile to avoid
   requirements                                                               refinancing concentrations
 • Liquidity buffer strategy aims at high quality assets, with level 1      • With solid track-record of issuance across different currencies and
   assets making up 97% of HQLA                                               locations, Rabobank continues to work on its funding products
 • Strong liquidity buffer of € 121bn (Dec 2017: € 116bn)                     diversification
 • € 5bn increase in liquidity buffer is largely explained by increase in
   CB receivables

Investor Relations
Appendix IV - Other
Growing a Better World Together – Banking for Food
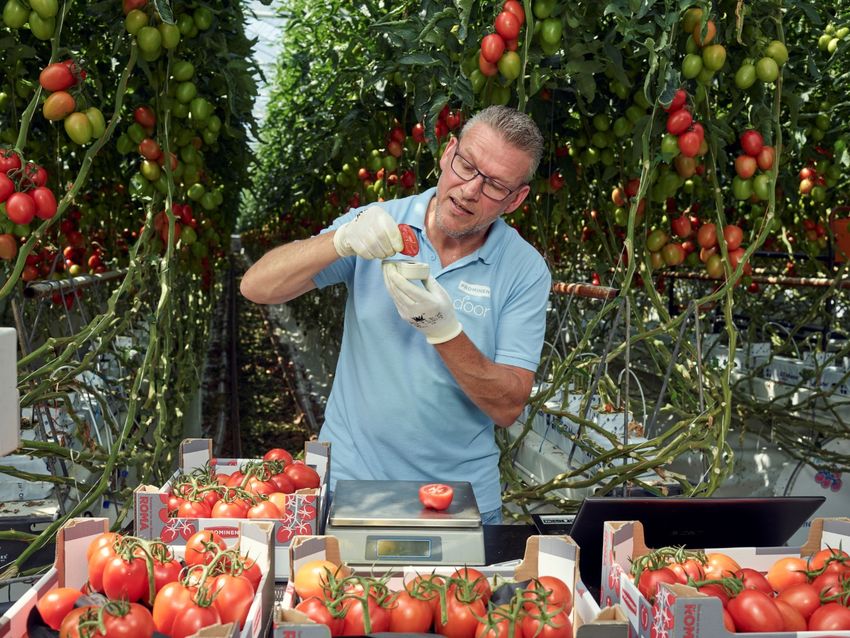
The world’s leading Food & Agri Bank

       Expertise in F&A sector
                                                     Commitment to mission

 • >115 years financing agriculture             • Cooperative structure enables long-term
                                                  relationships
 • 90 analysts at Rabo Research Food & Agri
                                                • Rated as the most sustainable bank by
 • Active in more than 10 sub sectors
                                                  Sustainalytics
 • Expertise network existing of more than
                                                • Rabobank supports the entire global food
    40,000 clients
                                                  chain from farm to fork

       Strong F&A presence                          Power of coalitions

 • About half of world’s top 300 F&A            • Rabobank collaborates with clients,
    companies are clients of Rabobank             employees, partners, governments,
                                                  knowledge institutions, NGO’s and even
 • 17 of the top 20 global dairy farms
                                                  competitors
 • 18 of the top 25 global beverage producers
                                                • Organizing F&A Next and FoodBytes! to
 • Loans to Food & Agri sector: € 103bn           stimulate innovation and formation of
                                                  partnerships

Investor Relations                                                                        61
B4F – Contributing to solve the world’s food issues
Full commitment to the UN SDGs by focussing on four major issues

        EARTH                                                      WASTE
        Restore the quality of existing agricultural               Reducing food waste throughout the entire
        land worldwide                                             food supply chain

 • The introduction of Soilscanner in Kenya -               • Asset Based Finance and Structured Finance
    tripling harvest and improving the quality of             & Advisory introduced new revenue
    the soil                                                  models to stimulate innovation
 • The launch of Agri3 Fund to contribute to                • Introduction of Circular Economy (CE)
    sustainable land use practices at scale                   Challenge to stimulate entrepreneurs to
                                                              think beyond the boundaries of their
                                                              organization and search for partnerships

        STABILITY                                                  NUTRITION
        Encourage and promote a more stable and                    Ensure a healthy and balanced diet for
        resilient F&A sector                                       everyone

 • Global Farmers Master Classes are                        • Diverzio supports health corporations to
    organized by Rabobank to inform farmers                   make their meals better: more healthy and
    on the latest trends and prepare them for                 sustainable
    the future
                                                            • Rabobank invests in Protix, a product of
 • Rabobank supports and enables farmer                       Rabobank FoodBytes! Protix produces
    aggregation and financing to create a                     insect based animal feed
    stable food chain

Investor Relations                                                                                      62
You can also read