FY2019 Results Andrew Harding - Managing Director & CEO Pam Bains - CFO & Group Executive Strategy - Aurizon

Page created by Luis Johnson
 
CONTINUE READING
FY2019 Results Andrew Harding - Managing Director & CEO Pam Bains - CFO & Group Executive Strategy - Aurizon
FY2019 Results
Andrew Harding – Managing Director & CEO
Pam Bains – CFO & Group Executive Strategy

                                             12 August 2019
FY2019 Results Andrew Harding - Managing Director & CEO Pam Bains - CFO & Group Executive Strategy - Aurizon
FY2019 RESULTS

Disclaimer

 NO RELIANCE ON THIS DOCUMENT                                                                       NO OFFER OF SECURITIES
 This document was prepared by Aurizon Holdings Limited (ACN 146 335 622) (referred to              Nothing in this presentation should be construed as a recommendation of or an offer to sell or a
 as “Aurizon” which includes its related bodies corporate (including Aurizon Operations             solicitation of or subscription or invitation of an offer to buy or sell securities in Aurizon in any
 Limited). Whilst Aurizon has endeavoured to ensure the accuracy of the information                 jurisdiction (including in the United States), nor shall it or any part of it form the basis of or be
 contained in this document at the date of publication, it may contain information that has not     relied on in connection with any contract or commitment whatsoever. This document is not a
 been independently verified. Aurizon makes no representation or warranty as to the                 prospectus and it has not been reviewed or authorized by any regulatory authority in any
 accuracy, completeness or reliability of any of the information contained in this document.        jurisdiction. This document does not constitute an advertisement, invitation or document which
 Aurizon owes you no duty, whether in contract or tort or under statute or otherwise, with          contains an invitation to the public in any jurisdiction to enter into or offer to enter into an
 respect to or in connection with this document, or any part thereof, including any implied         agreement to acquire, dispose of, subscribe for or underwrite securities in Aurizon.
 representations or otherwise that may arise from this document. Any reliance is entirely at
 your own risk.                                                                                     FORWARD-LOOKING STATEMENTS
                                                                                                    This document may include forward-looking statements which are not historical facts. Forward-
 DOCUMENT IS A SUMMARY ONLY                                                                         looking statements are based on the current beliefs, assumptions, expectations, estimates and
 This document contains information in a summary form only and does not purport to be               projections of Aurizon. These statements are not guarantees or predictions of future performance,
 complete and is qualified in its entirety by, and should be read in conjunction with, all of the   and involve both known and unknown risks, uncertainties and other factors, many of which are
 information which Aurizon files with the Australian Securities Exchange. Any information or        beyond Aurizon’s control. As a result, actual results or developments may differ materially from
 opinions expressed in this document are subject to change without notice. Aurizon is not           those expressed in the forward-looking statements contained in this document. Aurizon is not
 under any obligation to update or keep current the information contained within this               under any obligation to update these forward-looking statements to reflect events or
 document. Information contained in this document may have changed since its date of                circumstances that arise after publication. Past performance is not an indication of future
 publication.                                                                                       performance.

 NO INVESTMENT ADVICE                                                                               NO LIABILITY
 This document is not intended to be, and should not be considered to be, investment advice         To the maximum extent permitted by law in each relevant jurisdiction, Aurizon and its directors,
 by Aurizon nor a recommendation to invest in Aurizon. The information provided in this             officers, employees, agents, contractors, advisers and any other person associated with the
 document has been prepared for general informational purposes only without taking into             preparation of this document, each expressly disclaims any liability, including without limitation
 account the recipient’s investment objectives, financial circumstances, taxation position or       any liability arising from fault or negligence, for any errors or misstatements in, or omissions from,
 particular needs. Each recipient to whom this document is made available must make its             this document or any direct, indirect or consequential loss howsoever arising from the use or
 own independent assessment of Aurizon after making such investigations and taking such             reliance upon the whole or any part of this document or otherwise arising in connection with it.
 advice as it deems necessary. If the recipient is in any doubts about any of the information
 contained in this document, the recipient should obtain independent professional advice.

                                                                                                                                                                                                             2
FY2019 RESULTS

Agenda

 1       Safety

 2       Integration Review

 3       FY2019 Performance Overview

 4       FY2019 Financial Performance

 5       Outlook & Key Takeaways

 6       Q&A

                                        3
FY2019 RESULTS

Safety performance
The result reinforces the importance of our Seamless Safety initiative to reset the safety
culture

                                                                    TOTAL RECORDABLE INJURY FREQUENCY RATE (TRIFR)1

                                                                                                                  +10%
               Incidents per million person-hours worked

                                                                                                                         11.07
                                                                             9.88                         10.02

                                                            8.43

                                                                                           7.12

                                                           FY2015           FY2016        FY2017         FY2018          FY2019

1.   TRIFR includes employees and contractors                                                                                     4
FY2019 RESULTS

        Integration review

        Andrew Harding
        Managing Director & CEO
FY2019 RESULTS   INTEGRATION REVIEW

Integration review
In June 2018 Aurizon announced it would review the benefits of remaining vertically integrated.
The review of the integrated structure was assessed through five relevant core criteria

                                 SYNERGIES /           GROWTH               CAPITAL
 STAKEHOLDERS                                                                                      VALUATION
                                DIS-SYNERGIES          OPTIONS            STRUCTURE

Views and impact on           Operational synergies     Growth            Optimal capital         Potential for
     customers,               / dis-synergies under   opportunities   structure and potential    maximisation of
   shareholders,                each structure and                        benefits under        shareholder value
     employees,                costs of undertaking                         integration /          under each
    government,                     separation                               separation             structure
   regulators and
    communities

                                                                                                                    6
FY2019 RESULTS   INTEGRATION REVIEW

Stakeholders
Majority of stakeholders either have no preference or prefer Aurizon to
remain vertically integrated                                                                                STAKEHOLDERS

                                              INSIGHT FROM CUSTOMERS

                    › Majority of customers are either ambivalent or prefer Aurizon to remain integrated

                                      OTHER STAKEHOLDER CONSIDERATIONS

  SHAREHOLDERS                   GOVERNMENT              COMMUNITIES               REGULATORS                    EMPLOYEES

             No red flags for or against              No consensus on best                    Other issues more
                   either option                            structure                      important than separation

                           Regulatory outcomes, capital structure & transformation viewed as higher priorities

                                                                                                                             7
FY2019 RESULTS   INTEGRATION REVIEW

Synergies / dis-synergies
A separated structure would result in loss of operational synergies and also                                 SYNERGIES /
incur costs of duplication                                                                                  DIS-SYNERGIES

DIS-SYNERGIES AND RISKS FROM SEPARATION ARE REAL
                                      Enables easier implementation of operational improvements as
                                      objectives are aligned:
                                      › Precision Railroading
     OPERATIONAL                      › Train Guard
    IMPROVEMENTS                      › Wayside condition monitoring
                                      › Other operating improvements e.g. overlength trains
                                                                                                                     Approx.
                                                                                                                    10 – 15%
                                                                                                                     of EBIT
                                      Small cost impacts from loss of scale through duplication of:
                                      › Finance
  DUPLICATION OF                      › IT & systems
COMMON FUNCTIONS                      › Engineering

                                      › Benefits of integration are acknowledged internationally
                                      › Global rail market shows vertical integration is most common structure
   INTEGRATION IS
                                        (>90% of global freight tkms)
INTERNATIONAL BEST
      PRACTICE                        › Australia is one of the few partially separated markets

                                                                                                                               8
FY2019 RESULTS       INTEGRATION REVIEW

Growth options & Valuation
Growth options are present in either structure, but execution
                                                                               GROWTH
remains uncertain                                                              OPTIONS
                                                                                                    VALUATION

                 GROWTH OPPORTUNITIES                                           VALUATION

                                                           › Current share price implies discount to fair value has
                                                             narrowed
                 1
                        Separation unlocks a small         › Market conditions, operating performance and UT5
                          number of below rail               commercial deal have contributed to recent strong
                       opportunities, but execution          share price
                            remains difficult
                                                           › Ongoing value drivers are mostly in Aurizon’s control,
                                                             and are either known or in advanced planning stages
                                                             and not assisted by separation:

                                                                1. Capital management
                 2                                              2. Network efficiencies
                       Integration enables broader
                      opportunities (greenfield, new            3. Above Rail contracting
                     basins, offshore expansions) but
                       execution is also uncertain              4. Operational efficiency improvements

                                                                5. Bulk turnaround

                                                                                                                      9
FY2019 RESULTS    INTEGRATION REVIEW

Capital structure
More efficient capital structure can be implemented regardless of                                                     CAPITAL
integration                                                                                                         STRUCTURE

                             OUTCOMES OF LEGAL AND CAPITAL STRUCTURE REVIEW

      1                                                      CURRENT LEGAL STRUCTURE
                                                                                                                     BBB+/Baa1

          Current capital structure is not optimised, with               Holdings
                                                                                                                     Group credit rating
                                                                                                                     includes Network

           debt capacity limited compared with peers                                                                 as a subsidiary of
                                                                                                                     Operations

                                                                       Operations

      2                                                                                     Standalone
                                                                         Network            funding

           Implementation of the review will establish
                                                                                            structure –
                                                                                            BBB+/Baa1

            independent legal entities for Above Rail
             (Operations) and Below Rail (Network)

      3                                                      PROPOSED LEGAL STRUCTURE
           This gives Aurizon access to the majority of
            capital structure benefits possible through                                Holdings
              separation, while remaining vertically
                             integrated
                                                                   Operations                  Network

                                                               Standalone funding           Standalone funding
                                                               structure – targeting        structure – targeting
                                                               BBB+/Baa1                    BBB+/Baa1

                                                                                                                                           10
FY2019 RESULTS    INTEGRATION REVIEW

Conclusion
The review concluded that the benefits of remaining vertically integrated outweigh separation
at this time

             CRITERIA                                 INTEGRATION                                        SEPARATION
                                                        BENEFITS                                          BENEFITS
                                        • Customer preference (by contracted                 • Provides choice of pure-play exposure
                 STAKEHOLDERS                 volume) is weighted towards remaining             for investors
                                              integrated

                                            • Better execution of operational
                                       
                  SYNERGIES /                 improvements
                 DIS-SYNERGIES              • Reduced corporate overhead duplication,
                                              albeit minimal

                                           • Focus on ongoing business improvement
                   GROWTH                                                                     • Potential short term opportunity for growth
                                            • Strategically invest in core business
                   OPTIONS
                                            • Presents long term opportunity for growth

                                                                                             
                    CAPITAL
                  STRUCTURE                • Aurizon will amend its capital structure independent of vertical integration

                                                                                             
                  VALUATION
                                           • Current share price implies discount to fair value has narrowed

                                                                                                                                              11
FY2019 RESULTS

        Performance overview

        Andrew Harding
        Managing Director & CEO
FY2019 RESULTS     PERFORMANCE OVERVIEW

FY2019 highlights
Non Network EBIT (ex redundancy) $450m above top end of guidance, includes $20m
doubtful debt recovery

      GROUP EBIT                          STATUTORY NPAT        ROIC        FREE CASHFLOW

        $829m                               $473m             9.7%            $735m
           down 12%                           down 15%        down 1.2ppt         up 10%

        NETWORK                                                                CAPITAL
                                          COAL VOLUMES     FINAL DIVIDEND
        VOLUMES                                                              MANAGEMENT

                                                                                   Up to

      232.7mt                              214.3mt          12.4cps           $300m
                 up 1%                         up 1%           down 5%       on market buy back
                                                                                 in FY2020

                                                                                                  13
FY2019 RESULTS   PERFORMANCE OVERVIEW

Achievements to date
Execution of the strategy over the last two years has generated long term value for Aurizon
shareholders

                                                     Achieved
                               Execute                                   Ongoing              De-risked         Optimising
     Restructured                                  fundamental
                                Freight                                 operational           near term        the legal and
     to Business                                    regulatory
                               Review                                    efficiency          Above Rail           capital
      Unit model                                      reform
                               findings                                improvement          contract book        structure
                                                   through UT5

     Increased       • Closure & divestment Commercial deal          Improved efficiency    Extending coal      More efficient
  accountability and   of Intermodal        provides long term        and reduced cost      contract book    balance sheet and
   customer focus                          certainty, incentives            base                              funding structure
                     • Bulk turnaround in
                       line with plan      and improved   return

                                        Delivered through an integrated structure

                                               Improved shareholder returns
                                          ›   Maintained 100% payout ratio for four years
                                          ›   Future capital management opportunities
                                                                                                                                  14
FY2019 RESULTS            PERFORMANCE OVERVIEW

Coal update
Through a focus on reliability, performance and providing customers with tailored, flexible
operating solutions, Coal has secured key contract extensions

CONTRACT UPDATE                                                                                                        CUSTOMER VALUE PROPOSITION
› Jellinbah – contract extension for Jellinbah East &                                                                  › Delivery performance leader
  Lake Vermont mines                                                                                                     o Strategic investments in asset performance and utilisation
                                                                                                                           underpinning reliability and efficiency
› Glencore – a range of contract extensions and                                                                          o Precision railroading operations
  additional volumes, most notably in the Newlands                                                                     › Engaged and responsive workforce
  corridor
                                                                                                                         o Improved workforce productivity through rostering, scheduling
                                                                                                                           and communication systems
› Commenced railings during the year for MACH Energy                                                                     o Improved utilisation through reconfigured crew deployment
  (Jan 19) and Baralaba Coal (Aug 18)                                                                                      models
                                                                                                                       › Right commercial value
                                                                                                                         o Market competitive, putting pressure on rates
  COAL CONTRACT PORTFOLIO EXPIRY PROFILE1
                                                                                                                         o Flexible and tailored offerings to meet customer needs
                                                                                                                         o Leveraging delivery performance and fleet to share risk

                             0 - 3 years                                                 0 - 3 years

                         17%                                                         13%

                                                                                          15%
                                                                                                   >3 - 7 years        OPERATIONAL EFFICIENCIES
                             15% >3 - 7 years
            68%                                                                                                        › Operational efficiencies to mitigate pricing pressure
                                                                         72%
> 7 years
                                                           > 7 years
                                                                                                                       › Precision Railroading – scheduling trials completed in
                                                                                                                         Moura have delivered operational benefits. Trial to be
              30 June 2018                                                     30 June 2019                              extended to all systems in FY2020

                                                                                                                       › EA approved in employee ballot. Wage uplifts of
1.   Calculated using current contracted tonnes, adjusted for the Glencore contract extensions and additional volume     between 2% to 2.5%
     signed after 30 June 2019                                                                                                                                                             15
FY2019 RESULTS             PERFORMANCE OVERVIEW

Bulk update
Bulk continues to improve its market positioning. Target Bulk markets remain positive driven
by demand for key commodities

CONTRACT UPDATE                                                                                                                 BULK CONTRACT PORTFOLIO EXPIRY PROFILE1

› Glencore Freighter                                                                                                                                        0 - 3 years                 > 7 years
                                                                                                                                                     29%
  New service on commercial terms                                                                                    > 7 years
                                                                                                                                   38%
                                                                                                                                                                                                      30%
                                                                                                                                                                                                                        41%
                                                                                                                                                                                                                                 0 - 3 years
  Mixed freighter and concentrates
  3 year contract expiring August 2021
                                                                                                                                                33%                                                        29%
› Mt Gibson                                                                                                                                        >3 - 7 years                               >3 - 7 years
  Short term spot agreement commenced May 2019
                                                                                                                                      30 June 2018                                                      30 June 2019
› Linfox
  Linehaul (hook and pull) commercial agreement in QLD
  10 year contract (5+5 year option) commenced
  February 2019                                                                                                             OPERATIONAL EFFICIENCY IMPROVEMENTS

› Kalgoorlie Freighter                                                                                                        › Flexible deployment of existing fleet to take advantage
  Improved utilisation with increased volumes largely from                                                                      of near term opportunities
  existing customers
                                                                                                                              › Improvements in on time performance through
› Graincorp                                                                                                                     disciplined train operations
  Queensland contract ceases November 2019
                                                                                                                              › Work continues on QLD EA

1.   Based on estimated GTKs as a number of hauls in the Bulk portfolio are hook & pull and accordingly have no corresponding tonnes and NTKs. Includes iron ore contracts. For the purposes of the chart, Linfox is classified as a five year
     contract                                                                                                                                                                                                                                    16
FY2019 RESULTS             PERFORMANCE OVERVIEW

Network update
Through constructive engagement with our customers, Network has submitted a customer DAAU
that delivers significant regulatory reform and a range of benefits for both Network and customers

                                BENEFITS FROM THE DAAU                                                                                              NETWORK OPERATING COSTS ($M)2
                                                                                                                                                                                               718
       LONG TERM                                        • 10 year undertaking term (FY2018 to                                                                                                                       Compressible
       CERTAINTY                                          FY2027)                                                                                Operating & Corporate costs                   138
                                                                                                                                                                                                                    costs – retained
                                                                                                                                                                                                                    by Network

                                                                                                                                                              Maintenance costs                150
         IMPROVED                                       • Return of 6.3%1 - better reflects the                                                                                                                     Compressible costs
                                                          risks of owning and operating the                                                                                                                         - pass through to
          RETURN                                          CQCN                                                                                                      Energy & Fuel              109                  customers

       EFFICIENCY                                       • Operating cost efficiencies to be
        BENEFITS                                          retained by Network                                                                                         Depreciation             307                 Non-compressible
                                                                                                                                                                                                                   in the short term

         NETWORK                                        • Independent review to be undertaken                                                                                  Other
                                                                                                                                                                                                14
                                                          to confirm capacity. Mechanisms in
         CAPACITY                                         place to remedy any deficits                                                                                                     FY2019

                                                                                                                                                       › Under the customer DAAU Network is
                                                        • Customers have influence on                                                                    focused on operational efficiencies for:
     TRANSPARENCY                                         maintenance and capital strategies
                                                          and the ability to agree budgets                                                                  › Maintenance costs - pass through to
                                                                                                                                                              customers
                                                        • Incorporates performance and rebate                                                               › Operating and corporate costs -
     PERFORMANCE                                          mechanisms to incentivise Network
                                                                                                                                                              retained by Network for the term of the
                                                          performance
                                                                                                                                                              DAAU
1.   6.3% WACC from Report Date. Reset of Risk Free Rate and Debt Risk Premium at July 2023
2.   Maintenance costs exclude ballast undercutting costs which are capitalised for accounting purposes. Maintenance costs also include some depreciation relating to plant used in maintenance and capital activities
                                                                                                                                                                                                                                         17
FY2019 RESULTS             PERFORMANCE OVERVIEW

Other matters
Below is a summary update on other matters

                                              › On 15 May 2019 the Federal Court of Australia rejected ACCC’s allegations that the sale
    SALE OF                                     agreement between Aurizon and Pacific National (PN) for ART contravened competition law
  ACACIA RIDGE
 TERMINAL (ART)                               › On 27 June 2019 ACCC lodged an appeal. On 18 July 2019 Aurizon and PN filed notices of
                                                cross appeal. Court date to be set

                                              › On 27 June 2019 the Supreme Court of Queensland confirmed Network’s ability to charge
                                                above regulatory fees disputed by customers under their WIRP Deeds. On 25 July 2019
                                                customers lodged an appeal
    WIGGINS
  ISLAND RAIL                                 › Customers initiated other disputes in relation to the WIRP fee, which were subject to expert
PROJECT (WIRP)                                  determination - determination issued in June 2019 and found WIRP fee should be partially
                                                reduced. Network is determining options for appeal of this outcome

                                              › No revenue relating to the WIRP fee has been recognised to date

                                              › Aurizon executed a sale agreement for RGB with Loram for a value of $186m ($166m cash and
 SALE OF RAIL                                   $20m assumption of debt)
  GRINDING
                                              › Contract includes a number of conditions precedent, expected to close 1HFY2020
BUSINESS (RGB)
                                              › RGB contributed ~$15m EBIT1 in FY2019

1.   Excludes corporate support costs and earnings from the discontinued Arc contract
                                                                                                                                               18
FY2019 RESULTS

        FY2019 Financial Performance

        Pam Bains
        CFO & Group Executive Strategy
FY2019 RESULTS   FINANCIAL PERFORMANCE

Key financial highlights1
Results reflect reduced earnings in Network from the UT5 Final Decision, including the
acceleration of the total FY2018 true up into FY2019

 $m                                      FY2019     FY2018     Variance     › Revenue reflects the UT5FD, including
                                                                              the acceleration of the total FY2018 true
 Revenue                                    2,908      3,113        (7%)      up, in FY2019. Revenue is also impacted
                                                                              by lower volumes in Bulk with the Cliffs
 Operating Costs                          (1,536)    (1,646)         7%       cessation

 Depreciation & Amortisation                (543)      (526)        (3%)    › Operating costs benefited from reduced
                                                                              access costs
 EBIT – underlying                           829        941       (12%)
                                                                            › Free cash flow benefited from the
 EBIT – statutory2                           829        966       (14%)       termination payment from Cliffs
 Operating Ratio (%)                       71.5%      69.8%      (1.7ppt)   › Dividend based on 100% payout ratio of
                                                                              underlying continuing NPAT
 NPAT – underlying                           473        542       (13%)

 NPAT – statutory2                           473        560       (15%)

 EPS (cps) – underlying                      23.8       26.9      (12%)

 EPS (cps) – statutory2                      23.8       27.8      (14%)

 ROIC (%)                                   9.7%      10.9%      (1.2ppt)

 Final dividend per share                    12.4       13.1        (5%)
                                                                             1.   Continuing operations
 Free Cash Flow                              735        669         10%      2.   Significant items in FY2018 of $26m and includes Cliffs contract termination $35m,
                                                                                  Bulk East impairment ($32m) and redundancy benefit $23m.

                                                                                                                                                                       20
FY2019 RESULTS              FINANCIAL PERFORMANCE

Coal
EBIT result in line with expectations with increased spend for maintenance and reliability
initiatives

     $m                                          FY2019                      FY2018                       Variance
                                                                                                                         Revenue
     Above rail                                           1,236                      1,208                      2%
                                                                                                                         › Volumes – up 1%, CQCN flat impacted by PIA
     Track access                                            488                         598                  (18%)        and weather, NSW & SEQ up 4% with new
     Other                                                        1                           7               (86%)        contracts and strong demand

     Revenue                                              1,725                      1,813                     (5%)      › Revenue quality improvement includes lower
                                                                                                                           contract utilisation and CPI escalation
     Access costs                                         (472)                       (609)                    22%
                                                                                                                         Costs
     Operating costs                                      (643)                       (592)                    (9%)
                                                                                                                         › Higher costs impacted by maintenance $23m,
     Depreciation                                         (195)                       (183)                    (7%)        costs supporting growth $6m, CPI impacts $7m
     EBIT                                                    415                         429                   (3%)      › Depreciation increase due to additional consists
                                                                                                                           and overhaul activity
     Tonnes (m)                                           214.3                      212.4                      1%
     NTKs (bn)                                              50.5                       50.4                          -
                                                                                                   COAL EBIT PERFORMANCE
                                                                                                                6
                                                                                    18                                           35
              429                                 9
                                                                                                                                                   12               415

          FY2018                             Volume                        Net Revenue                         Other       Operating Costs1    Depreciation       FY2019
                                                                             Quality1
1.        Revenue quality is net of fuel price and access which have been excluded from operating costs                                                                       21
FY2019 RESULTS             FINANCIAL PERFORMANCE

Bulk
Result includes the impact of the Cliffs cessation in FY2018

                                                                                              Net impact Cliffs cessation – reflects the impact of the
     $m                                        FY2019            FY2018       Variance
                                                                                              cessation of Cliffs in June 2018
     Revenue                                              502        618         (19%)        Revenue

     Access costs                                        (104)      (162)         36%         › Excluding impact of Cliffs, revenue higher with new
                                                                                                growth volumes offset in part by lower grain and the
     Operating costs                                     (333)      (371)         10%           impact from North Queensland flooding in 2HFY2019
                                                                                              Costs
     Impairment costs                                     (11)       (10)        (10%)
                                                                                              › Higher operating costs from growth volumes and cost
     Depreciation                                         (17)       (25)         32%           escalation offset in part by ongoing benefits from the
                                                                                                turnaround program
     EBIT                                                  37            50      (26%)
                                                                                              › Net depreciation includes impairment costs
     Tonnes (m)                                          44.6       54.7         (18%)

     NTKs (bn)                                             8.5      13.4         (37%)

             50                                                            BULK EBIT PERFORMANCE

                                                                                         14               10                                 37
                                                                                                                             1
                                                38
                                                                    22

          FY2018                        Net impact                Volume        Revenue Quality 1   Operating Costs   Net Depreciation    FY2019
                                      Cliffs cessation
1.     Revenue quality is net of fuel price and access                                                                                                   22
FY2019 RESULTS               FINANCIAL PERFORMANCE

Network
EBIT performance reflects the UT5FD, including $60m impact of the true up from FY2018.
RAB rollover estimated value $5.7bn1

                                                                                                                          Revenue
      $m                                                    FY2019                        FY2018          Variance
                                                                                                                          › $60m recognised in relation to FY2018 UT5FD
      Track Access                                                  1,070                    1,167            (8%)          true up
      Services & Other                                                    48                   52             (8%)        › FY2016 and FY2017 revenue cap adjustment
                                                                                                                            $66m
      Revenue                                                       1,118                    1,219            (8%)
                                                                                                                          › Other revenue mainly includes GAPE revenue
      Energy & Fuel                                                  (109)                   (143)            24%           adjustments and impact of prior year bank
      Other Operating Costs                                          (288)                   (287)               -          guarantee
                                                                                                                          Costs
      Depreciation                                                   (321)                   (308)            (4%)
                                                                                                                          › Decrease in Energy & Fuel costs from lower
      EBIT                                                              400                   481           (17%)           prices and discounts, offset in revenue
      Tonnes (m)                                                    232.7                    229.6             1%         › Depreciation increase from asset renewals and
                                                                                                                            ballast undercutting
      NTKs (bn)                                                        57.9                   56.9             2%

           481                                                                       NETWORK EBIT PERFORMANCE

                                   60
                                                                                                                                    12         0                        400
                                                                                                                                                            13
                                                           48                                                        66
                                                                                     4               18

       FY2018              FY2018 UT5 UT5FD MAR                              MAR over-         FY18 Flood      FY17 & FY16         Other     Other      Depreciation   FY2019
                            True Up2   Reduction2                             recovery          Recovery       Revenue Cap        Revenue   Operating
 1.     Based on the UT5FD, including all deferred capital but excluding AFDs of $0.4bn
                                                                                                                                             Costs
 2.     Excludes GAPE and net of Energy & Fuel costs                                                                                                                            23
FY2019 RESULTS               FINANCIAL PERFORMANCE

Capital expenditure
Capital result in line with guidance for FY2019. Non-growth capex forecast in line with long-
term expectations

     CAPITAL EXPENDITURE1 FY2016 – FY2020 ($M)

                                                                                                                                               › FY2019 capex in line with guidance at
       703                                                                                                                                       $495m (guidance $480m - $520m)

                                                                                                                                               › Capital expenditure guidance for
                                                                                                                                                 FY2020 $520m - $550m
                            532                                                                                                   ~520 - 550   › FY2020 Growth capex mainly relates
                                                  490                                        272                   495
                                                                                                                                                 to wagons for CQCN

       587
                                                                                                                                               › Non growth capital in FY2020 forecast
                                                                                             250                                                 to increase against FY2019 as a result
                                                                                                                                                 of:
                            465                                                                                                   ~480 - 500
                                                  443                                                              451                           › Rollingstock overhauls
                                                                       223                    22
                                                                                                                                                 › Facility projects
                                                                       201                                                                       › Network renewals
       116
                             67                    47                                                               44              ~40 - 50
                                                                    22
      FY2016            FY2017                FY2018             1HFY2019 2HFY2019                             FY2019              FY2020(f)

       Non Growth                    Growth

1.       Total Group capital expenditure net of lease incentive payments and externally funded projects and includes capitalised interest                                                 24
FY2019 RESULTS           FINANCIAL PERFORMANCE

 Legal and capital structure review
 The objective of the review was to optimise the capital structure of the Group through a
 reorganisation of the legal entities under Holdings

                CURRENT LEGAL STRUCTURE                                     PROPOSED LEGAL STRUCTURE

                                        BBB+/Baa1
                         Holdings       Group credit rating includes
                                        Network as subsidiary of
                                        Operations
                                                                                                     Holdings
                                        Gearing @ 30 June 2019 – 41.7%

                       Operations
                                                                                   Operations                   Network

                                         Standalone funding structure –        Standalone funding         Standalone funding
                          Network        BBB+/Baa1                             structure                  structure
                                         Gearing @ 30 June 2019 - 58.7%1       Targeting BBB+/Baa1        Targeting BBB+/Baa1

                                           IMPLICATIONS OF PROPOSED LEGAL STRUCTURE
 › Legal structure is simplified and consistent with business units and external reporting

 › Enables standalone funding structures for Above Rail (Operations) and Below Rail (Network) and establishes independent
   gearing levels consistent with their different business risk profiles

 › Establishment of new credit rating for Operations and removal of Holdings’ rating. Both Operations and Network targeting
   BBB+/Baa1 credit ratings

         Provides additional funding capacity of ~$1.2bn – debt to be added progressively over time

1.   Using RAB and excludes AFDs                                                                                                25
FY2019 RESULTS   FINANCIAL PERFORMANCE

Implementation steps
Required to effect the share transfer of Network and establish independence from
Operations

 › Duty relief - Office of State Revenue (OSR) in Queensland
     › An application for duty relief on the proposed restructure has been approved by the OSR relating to the transfer of shares and
       assets (estimated value $300m)
     › Under the Queensland duty regime, for the relief to apply Aurizon Holdings, Aurizon Operations and Aurizon Network will need
       to remain members of the same corporate group for 3 years from the date the transfer occurs

 › Credit ratings
     › Credit rating agencies have been engaged on the proposed restructure and the requirement to establish a credit rating for
       Operations

 › Financing & other third party consents
     › Including the necessary consents from financiers to amend the Group’s current financing arrangements

 › Convertible Note (CN) issued by Network to Operations
     › Early conversation of the CN into shares in Network held by Operations
 › Deed of Cross Guarantee
     › Revoke the existing Deed of Cross Guarantee
     › Establish a new Deed of Cross Guarantee for the consolidated Operations Group

                                                                                                                                        26
FY2019 RESULTS   FINANCIAL PERFORMANCE

Capital structure objectives
The objectives determine the appropriate credit ratings and gearing to ensure the optimal
outcome for the Group and shareholders

                      Balance sheet flexibility
                       to adjust to changing
                                                                                    Sustainability of
                        market conditions,
                                                                                 cashflows through the
                     business risk and to take
                                                                                         cycle
                        advantage of future
                       growth opportunities

                                                                  Cashflow
                                                  Flexibility
                                                                sustainability

                                                   Credit          Cost of
                                                   Rating          Capital

                    • Targeting
                      credit ratings                                         Seeking to minimise the
                      BBB+/Baa1                                                 cost of capital and
                    • Facilitates access to                                    maximise long term
                      broad range of capital                                   shareholder returns
                      markets

                                                                                                         27
FY2019 RESULTS      FINANCIAL PERFORMANCE

Prioritisation of capital
Surplus capital will be applied in line with Aurizon’s capital allocation hierarchy

                                                      CAPITAL ALLOCATION HIERARCHY

 1                                          2                         3                      4
        DETERMINE
                                                  NON GROWTH                                          SURPLUS
        AVAILABLE                                                             DIVIDENDS
                                                    CAPITAL                                           CAPITAL
         CAPITAL

     › Ongoing operating                        › Sustaining and          › Within 70-100%       › Capital management
       cashflows                                  transformation            payout ratio           opportunities
                                                  projects
     › Impacts of the new                                                                        › Growth projects – only
       legal structure:                                                                            where it maximises
                                                                                                   shareholder value
      › Target credit ratings
        for Network &
        Operations -
        BBB+/Baa1
      › ~$1.2bn additional
        funding capacity

                   Capital management options influenced by low franking account balance

                                                                                                                            28
FY2019 RESULTS

        Outlook & Key Takeaways

        Andrew Harding
        Managing Director & CEO
FY2019 RESULTS   OUTLOOK & KEY TAKEAWAYS

FY2020 outlook
Group EBIT guidance $880m – $930m

 KEY ASSUMPTIONS

 › QCA approves UT5 customer deal during 1HFY2020 and an uplift in WACC from 5.9% to 6.3% assumed 2HFY2020

 › Above Rail Coal volumes of 220 - 230mt

 › Operational efficiency improvements remain a key driver in the business. Redundancy costs included in guidance

 › Excludes the Rail Grinding business

 › No major weather or industrial relations impacts

                                                                                                                    30
FY2019 RESULTS   OUTLOOK & KEY TAKEAWAYS

Key messages
Aurizon has a simple strategy which enables the delivery of shareholder value

    Commercial                              De-risking &
    agreement                                 growing
                                                             Ongoing       Implementing
       for UT5             ~50% of the      Above Rail                                        Maximise
                                                            operational     the optimal
      improves             portfolio has   contract book                                    distributions
                                                             efficiency       legal and
     regulatory               stable,         through                                        and returns
                                                             gains will         capital
    returns and             regulated        improved                                             to
                                                            continue to     structure for
       provides              earnings         service                                       shareholders
                                                           deliver value     the Group
     long-term                              delivery and
       certainty                           performance

                                                                                                            31
Contact and further information
Chris Vagg                                     Kath Clapham
Head of Investor Relations & Group Treasurer   Manager Investor Relations
+61 7 3019 9030                                +61 7 3019 9044
chris.vagg@aurizon.com.au                      kath.clapham@aurizon.com.au

ASX: AZJ
US OTC: AZNNY
FY2019 RESULTS

        Additional Information

        Group
        Coal
        Bulk
        Network
        Capital Expenditure
FY2019 RESULTS   ADDITIONAL INFORMATION

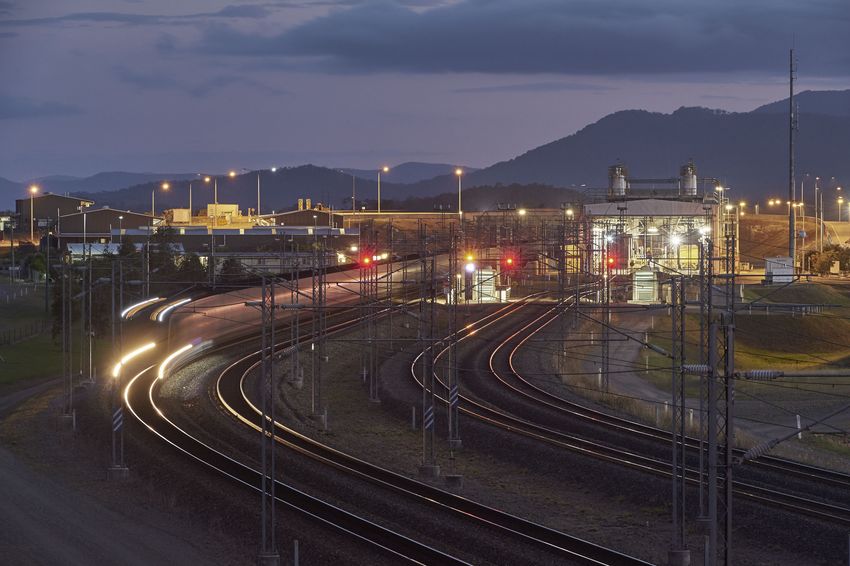
Aurizon’s rail haulage operations

                                          KEY OPERATIONAL
                                          STATISTICS
                                          COMMODITIES
                                          Coal, iron ore and bulk freight
                                          ROLLINGSTOCK
                                          ~500 active locomotives
                                          OPERATIONAL FOOTPRINT
                                          ~40 operational sites
                                          PEOPLE
                                          More than 4,500 full-time employees
                                          WAGONS
                                          11,000+ active wagons

                                                                                34
FY2019 RESULTS   ADDITIONAL INFORMATION

Aurizon’s vision, purpose, values and strategic levers
Execution against the three strategic levers is aimed at driving differentiation, competitive
advantage and sustainable performance

                 VISION                         PURPOSE                  STRATEGIC LEVERS

                                                                               Accelerate cost
                                                                               competitiveness of
                                                                               Aurizon

          The first                            Growing
        choice for                             regional                Accelerate cost
            bulk                             Australia by              competitiveness      of
                                                                             Achieve regulatory

        commodity                           delivering bulk                  reform and competitive
                                                                       Aurizon.
                                                                             advantage through
         transport                           commodities                       asset efficiency

         solutions                           to the world
                                                                               Position Aurizon for
                                                                               growth

                                               VALUES

    SAFETY                         PEOPLE    INTEGRITY       CUSTOMER            EXCELLENCE
                                                                                                      35
FY2019 RESULTS           ADDITIONAL INFORMATION

Sustainability
2019 will be the third year of TCFD disclosure for Aurizon

› Aurizon takes a direct approach to reporting environmental,
  social and governance (ESG) disclosures with the
  publication of the annual Sustainability Report

› In August 2019, Australian Council of Superannuation
  Investors (ACSI) rated Aurizon’s ESG disclosures as
  Leading for the fifth consecutive year

› As at June 2019, Aurizon participates in FTSE4Good Index
  Series, MSCI ESG Ratings and Sustainalytics

› Aurizon’s FY2018 response to climate-related risks was
  highlighted as an example of disclosure practice in the
  TCFD’s 2019 Status Report

› Aurizon’s FY2019 Sustainability Report is scheduled for
  release in October 2019

                                                               ESG rating of AA
                                                             as at February 2019.
    We report against the Task
     Force on Climate-related         Aurizon Holdings
      Financial Disclosures         remains a member of
    (TCFD) as recommended          the FTSE4Good Index
     by the Financial Stability   following the June 2019     ESG rating of “Average      *Excludes intermodal.
           Board (FSB)                  index review        Performer” as at March 2019

                                                                                                                  36
FY2019 RESULTS                ADDITIONAL INFORMATION

Future of Coal
Australian export coal is dependent on the global traded market, driven by regional demand
in Asia and preference for higher quality coal

AUSTRALIA COAL EXPORT VOLUME SPLIT: FY20191                                                                                                INDIA: COKING (METALLURGICAL) COAL
                                                                                                                                           REQUIREMENTS3
                Metallurgical Coal                                              Thermal Coal                                                                                                                                                          89%
                                                                                                                                            50mt
                                                                                         2%
                   13%
                                                                                                                                            40mt

                                                                                                                                            30mt

                     183mt                                                          210mt                                                   20mt
                                                                                                                                                                                                                                                      11%
                                                                                                                                            10mt
                                87%
                                                                                          98%                                                 0mt
                                                                                                                                                       FY09 FY10 FY11 FY12 FY13 FY14 FY15 FY16 FY17 FY18

                                                                                                                                                     Domestic Production                       Imported From Australia                        Total Imported
                                         Asia           Rest of World

COAL IMPORT VOLUME: SELECT REGIONS2                                                                                                        AVERAGE AGE OF COAL-FIRED ELECTRICITY
                                                                                                                                           CAPACITY4
    1,250mt                                                               Asia: 77% Global
                                                                          Traded Market                                                                                                   Expected Retirement Age
                                                                                                                                                                                                35-45 years
                                                                                                                     Asia
    1,000mt
                                                                                                                     Asia                                                                         24 years                                   23 years
      750mt                                                                                                          (Ex-China)
                       Asia: 40% Global                                                                                                                                                                                 15 years
                                                                                                                                                      12 years              13 years
      500mt            Traded Market

      250mt                                                                                                          Europe
                                                                                                                                                        China                  India                Japan            South Korea              Taiwan
          0mt
                1990              1995             2000              2005             2010              2015                                                Top Five Global Steam (Thermal) Coal Import Nations (By Volume, In Descending Order)

Sources: 1. Australian Bureau of Statistics, 2. International Energy Agency, World Coal Information 2018, 3. India Ministry of Coal, Coal Directory of India (multiple years), Provisional Coal Statistics (2017-18). Note: India financial year (April to
March). Domestic coking coal production includes washed coal (only), 4. Platts UDI Electric Power Plants Database (March 2019).
Notes: mt = million tonnes

                                                                                                                                                                                                                                                               37
FY2019 RESULTS            ADDITIONAL INFORMATION

Enterprise Agreements

                                                                                                        Headline Increases

                                         # Staff              Term
               EA                                                                Expiry Date   Year 1   Year 2      Year 3   Year 4        Comments
                                        Covered               (years)

 WA Rollingstock
                                             100                  4             10 May 2021    1.0%     1.5%        1.75%    1.75%    Complete
 Maintenance

 WA Rail Operations                          420                  4             30 June 2022   1.5%     2.0%         2.0%    2.0%     Complete

                                                                                10 November
 NSW Coal                                    310                  3                            2.5%     2.5%         2.5%             Complete
                                                                                    2021

                                                                                  30 January
 QLD Staff                                   920                  4                            2.1%     2.1%        2.25%    2.25%    Complete
                                                                                     2023

 QLD Infrastructure                          550                  4             27 May 2023    2.1%     2.1%        2.25%    2.25%    Complete

 QLD Coal*                                                                            TBA      2.5%     2.3%        2.25%             Awaiting approval
 • Traincrew & transport
   operators                                1280                  3
 • Maintenance                                                                        TBA      2.0%     2.0%         2.0%             Awaiting approval

 QLD Bulk                                    370                                                         In bargaining

* Coal agreement has received approval in an employee ballot. Awaiting FWC approval
                                                                                                                                                          38
FY2019 RESULTS

        Additional information

        Group
FY2019 RESULTS        ADDITIONAL INFORMATION

Financial highlights1 (underlying)

  $m                                           FY2019      FY2018      Variance

  Revenue                                      2,907.6     3,112.7      (7%)

  Operating costs                              (1,536.0)   (1,646.6)     7%

  EBITDA                                       1,371.6     1,466.1      (6%)

  EBIT                                          829.0       940.6       (12%)

  NPAT                                          473.3       542.1       (13%)

  EPS (cps)                                      23.8        26.9       (12%)

  Total dividend (cps)                           23.8        27.1       (12%)

  ROIC                                          9.7%        10.9%      (1.2ppt)

  Gearing                                       41.7%       42.3%       0.6ppt

  1.    Continuing Operations
                                                                                  40
FY2019 RESULTS   ADDITIONAL INFORMATION

Underlying group EBIT bridge ($m)

           941

                                    14

                                          13

                                                   80

                                                            5       829

        FY2018                     Coal   Bulk   Network   Other   FY2019

                                                                            41
FY2019 RESULTS        ADDITIONAL INFORMATION

EBIT by business unit (underlying)

  $m                                           FY2019   FY2018   Variance

 Coal                                          415.1    428.6     (3%)

 Bulk                                           37.3     50.1     (26%)

 Network                                       400.3    480.6     (17%)

 Other                                         (23.7)   (18.7)    (27%)

 EBIT1                                         829.0    940.6     (12%)

  1.    Continuing Operations
                                                                            42
FY2019 RESULTS        ADDITIONAL INFORMATION

Group operating highlights1

  $m                                           FY2019   FY2018   Variance

  Above Rail2 Revenue / NTK ($/’000 NTK)        37.7     38.1     (1%)

  Labour Costs3 / Revenue                      26.0%    24.4%    (1.6ppt)

  NTK / FTE (MNTK)                              12.5     13.2     (5%)

  EBITDA Margin – Underlying                   47.2%    47.1%     0.1ppt

  Operating Ratio – Underlying                 71.5%    69.8%    (1.7ppt)

  NTK (bn)                                      59.0     63.8     (8%)

  Tonnes (m)                                   258.9    267.1     (3%)

  People (FTE)                                 4,728    4,835      2%

  1.    Continuing operations
  2.    Above Rail includes Coal & Bulk
  3.    Excludes redundancy costs                                           43
FY2019 RESULTS   ADDITIONAL INFORMATION

Other profit & loss (underlying)

  $m                                      FY2019   FY2018   Variance

 Revenue                                   82.2     90.8     (9%)

  Total operating expenses                (96.1)   (99.7)     4%

  EBITDA                                  (13.9)    (8.9)    (56%)

  Depreciation and amortisation            (9.8)    (9.8)      -

  EBIT                                    (23.7)   (18.7)    (27%)

                                                                       44
FY2019 RESULTS   ADDITIONAL INFORMATION

Quarterly above rail tonnes – June quarter 2019

                                                                                            Quarter
                                                                                            Jun-19     Year Financial   Variance
                                                           Quarter Ending
                                                                                              vs.         to date
                                                                                            Jun-18

                                          Jun-18   Sep-18     Dec-18   Mar-19      Jun-19     %       Jun-19   Jun-18      %
Coal volumes (mt)
CQCN                                       38.9     38.0       38.4         36.4    39.5      2%      152.3     152.5      -
NSW & SEQ                                  15.8     14.2       15.9         15.3    16.6      5%       62.0     59.9      4%
                                 Total     54.7     52.2       54.3         51.7    56.1      3%      214.3     212.4     1%
Coal NTK (bn)
CQCN                                       9.7      9.7         9.5         9.1     10.0      3%       38.3     38.3       -
NSW & SEQ                                  3.1      2.7         3.2         3.1     3.2       3%       12.2     12.1      1%
                                 Total     12.8     12.4       12.7         12.2    13.2      3%       50.5     50.4       -

Bulk volumes (mt)                          13.3     11.5       12.1         10.3    10.7    (20%)      44.6     54.7     (18%)
Bulk NTK (bn)                              3.4      2.3         2.5         1.7     2.0     (41%)      8.5      13.4     (37%)

Total Above Rail Volumes (mt)              68.0     63.7       66.4         62.0    66.8     (2%)     258.9     267.1    (3%)
                                                                                                                                   45
FY2019 RESULTS     ADDITIONAL INFORMATION

Cashflow and shareholder returns

FREE CASH FLOW ($M)                                            SHAREHOLDER RETURNS ($M)
                                                  +10%
                                                                             830
                                                         735                                   762
                             704
                                            669
                                                                             301
                                                                                               300
                                                                                        552
                                                                 465                                   488
                                                                  69
                 340

    227                                                                      529
                                                                                               462
                                                                 396

   FY15          FY16       FY17        FY18         FY19       FY15      FY16         FY17    FY18   FY19
     Total Group         Continuing operations                    Buy Back         Dividends

› FCF benefited from the receipt of the Cliffs                 › Final dividend 12.4cps declared at 100%
  termination payment                                            payout of NPAT. 5% lower than prior year due
                                                                 to lower NPAT, impacted by UT5 true up
› Impact of UT5 true up in 1HFY2020 through
  payment to customers - ~$93m including GAPE                  › 100% payout ratio maintained since
                                                                 2HFY2015

                                                                                                                46
FY2019 RESULTS             ADDITIONAL INFORMATION

Balance sheet summary

     $m                                                                                                30 June 2019   30 June 2018

     Assets classified as held for sale1                                                                  108.4          108.0

     Other current assets                                                                                 631.2          698.2

     Property, plant & equipment                                                                         8,536.3        8,659.9

     Other non-current assets                                                                             425.2          315.7

     Total assets                                                                                        9,701.1        9,781.8

     Liabilities classified as held for sale                                                               (3.8)         (12.7)

     Other current liabilities                                                                           (795.7)        (735.6)

     Total borrowings                                                                                    (3,369.8)      (3,501.9)

     Other non-current liabilities                                                                       (854.4)        (801.5)

     Total liabilities                                                                                   (5,023.7)      (5,051.7)

     Net assets                                                                                          4,677.4        4,730.1

     Gearing - net debt / (net debt + equity)                                                             41.7%          42.3%

1.     Assets related to discontinued operations at 30 June 2019 - $42.9m and 30 June 2018 - $106.1m
                                                                                                                                     47
FY2019 RESULTS            ADDITIONAL INFORMATION

Funding update

FY2019 FUNDING ACTIVITY                                                                     KEY DEBT METRICS                           FY2019               FY2018
› Aurizon Finance cancelled existing bank debt                                              Weighted average
  syndicated facilities and replaced with bilateral facilities                                                                        4.3 years            4.7 years
                                                                                            maturity1
  totalling $450m, with maturity extended to November
                                                                                            Group interest cost on
  2023                                                                                                                                   4.5%                  4.5%
                                                                                            drawn debt
                                                                                            Group Gearing2                              41.7%                 42.3%
                                                                                            Network Gearing3                            58.7%                 62.4%
                                                                                            (incl AFDs4)

                                                                                            Credit Rating (S&P/Moody’s)             BBB+/Baa1            BBB+/Baa1

                                                                           MATURITY PROFILE ($M)
                                                                                                                875
                                                                                                                                                                778
                                                                                                                                       711
                                                                                                                425
                                                525                 490              500

                                                                                                                 90

                                                                    470
                                                                                                                360

                                                                     20
          FY20                                FY21                  FY22             FY23                      FY24                   FY25                     FY26
1.   Calculated on drawn debt, excluding working capital facility
2.   Group Gearing – net debt/net debt plus equity                                              Network - Drawn Bank Debt     Network - AMTN    Corporate - Drawn Bank Debt
3.   Network Gearing - net debt/RAB                                                             Network - Undrawn Bank Debt   Network - EMTN    Corporate - Undrawn Bank Debt
4.   Access Facilitation Deed                                                                                                                                                   48
FY2019 RESULTS   ADDITIONAL INFORMATION

Reconciliation of borrowings

                                                   $m                              Commentary

 Total debt including working capital facility   3,147.8   › Non-current debt on a Cash basis

 Reconciliation to Financial Statements

 Add/(less):

                                                           › Transaction costs directly attributable to borrowings are
 Capitalised transaction costs                    (9.2)      capitalised to the balance sheet and amortised to the income
                                                             statement in accordance with AASB 9, e.g. refinancing costs
                                                           › Discounts on mid-term-notes capitalised to the balance
 Discounts on bonds                              (10.2)      sheet and unwound to the income statement in accordance
                                                             with AASB 9
                                                           › Fair value hedge MTM adjustment on bonds in accordance
 MTM adjustment on bonds                         241.4
                                                             with AASB 9

 Total adjustments                               222.0

 Total borrowings per financial report           3,369.8   › Current and non-current borrowings

                                                                                                                            49
FY2019 RESULTS   ADDITIONAL INFORMATION

Significant Items

  $m                                      FY2019   FY2018   Variance

  Continuing operations                     -       25.7       -

   Asset impairments - Bulk                 -      (31.7)      -

   Cliffs contract exit                     -       34.5       -

   Redundancy benefit                       -       22.9       -

 Discontinued operation - Intermodal      (11.4)   (74.7)     nm

                                                                       50
FY2019 RESULTS   ADDITIONAL INFORMATION

Redundancy cost information

                                                                       › Redundancy costs since IPO have been included in
                         Redundancy costs      Redundancy costs          underlying EBIT as well as classified as a significant
  Year                 included in underlying     classified as          item
                             EBIT ($m)        Significant items ($m)
                                                                       › Aurizon classifies redundancy costs as significant in
 FY2011                             2                  63                the notes to the financial statements, 4E, 4D and
                                                                         investor presentations when the amounts are
                                                                         considered material
 FY2012                            15                   -
                                                                       › Redundancy costs are presented for total Group
 FY2013                             -                  96                (Continuing and Discontinued operations)

 FY2014                             -                  69

 FY2015                            36                   -

 FY2016                            24                   -

 FY2017                             5                  116

 FY2018                            17                  (10)

 FY2019                            21                  (1)
                                                                                                                                  51
FY2019 RESULTS             ADDITIONAL INFORMATION

Dividend history

                                                                                  Amount per share
                                                                   Payment Date                      Franking   Payout Ratio
                                                                                      (cents)
     FY2019 Final                                         23 September 2019             12.4           70%         100%1
     FY2019 Interim                                       25 March 2019                 11.4           70%         100%1
     FY2019 Total Dividend                                                              23.8
     FY2018 Final                                         24 September 2018             13.1           60%         100%1
     FY2018 Interim                                       26 March 2018                 14.0           50%         100%1
     FY2018 Total Dividend                                                              27.1
     FY2017 Final                                         25 September 2017             8.9            50%         100%
     FY2017 Interim                                       27 March 2017                 13.6           70%         100%
     FY2017 Total dividend                                                              22.5
     FY2016 Final                                         26 September 2016             13.3           70%         100%
     FY2016 Interim                                       29 March 2016                 11.3           70%         100%
     FY2016 Total dividend                                                              24.6
     FY2015 Final                                         28 September 2015             13.9           30%         100%
     FY2015 Interim                                       23 March 2015                 10.1           0%           70%
     FY2015 Total dividend                                                              24.0
     FY2014 Final                                         22 September 2014             8.5            0%           70%
     FY2014 Interim                                       28 March 2014                 8.0            80%          65%
     FY2014 Total dividend                                                              16.5
The relevant final dividend dates are:
› Ex-dividend date 26 August 2019
› Record date 27 August 2019

1.     Payout ratio on underlying NPAT for continuing operations                                                               52
FY2019 RESULTS    ADDITIONAL INFORMATION

Impact of AASB 16 Leases
The Group will adopt AASB 16 from 1 July 2019

                                                                                        ESTIMATED IMPACT ON BALANCE SHEET

 › The adoption of AASB 16 will result in almost all previously                        ASSETS                           $m
   recognised operating leases being recognised on the balance                         Current Assets
   sheet. Under the new standard an asset (right to use the leased
   item) and a finance liability to pay rentals are recognised                         Other assets                     5.0

                                                                                       Non Current assets
 › The Group has elected to apply the Modified Retrospective
   Approach when transitioning to the new standard. The Group will                     Property, plant & equipment     51.2
   not be required to restate comparative information
                                                                                       Other assets                    41.5
 › Impact on the financial accounts:                                                   LIABILITIES
     ›   Increase in total assets of $97.7m, including recognition of a right of use   Current liabilities
         asset in PP&E and lease receivables
                                                                                       Provisions                       0.1
     ›   Increase in total liabilities of $96.2m, including recognition of lease
         liabilities                                                                   Other liabilities               (9.2)
     ›   Increase in equity of $1.5m, representing the impact on retained
                                                                                       Non Current liabilities
         earnings on adoption of the modified retrospective transition approach
     ›   Estimated increase to EBIT of $0.5m and a decrease in profit before tax       Provisions                       2.1
         of $2.8m for FY2020
                                                                                       Other liabilities              (89.2)
 › With the introduction of the new lease accounting standard
                                                                                       Net assets                       1.5
   Aurizon has reviewed the current ROIC calculation and simplified
   the definition of invested capital which will be applied from                       EQUITY
   FY2020
                                                                                       Retained earnings               (1.5)

                                                                                                                               53
FY2019 RESULTS

        Additional information

        Coal
FY2019 RESULTS    ADDITIONAL INFORMATION

Coal snapshot
As at 30 June 2019

                      214                                  336                       236km
                                                                                       average haul
                  million tonnes                         active locos
                                                                                          length

                         76                             8,724                     22.8km/hr
                 average services
                                                        active wagons                         velocity
                     per day

                                TONNES                                  HAULAGE BREAKDOWN
                                                                                 (estimate)
                                                                                                     Thermal Coal
                                                 CQCN
                              29%                                                                    Metallurgical Coal
                                                 NSW/SEQ
                                                                           45%
                                                                                              55%
                                           71%

                                                                                                                          55
FY2019 RESULTS            ADDITIONAL INFORMATION

Coal operations - CQCN

Includes all mines in the CQCN                     56
FY2019 RESULTS   ADDITIONAL INFORMATION

Coal operations – NSW & South East Queensland (SEQ)

                                           Includes all mines in NSW & SEQ   57
FY2019 RESULTS   ADDITIONAL INFORMATION

Coal profit and loss (underlying)

  $m                                           FY2019      FY2018      Variance

  Tonnes (m)                                    214.3       212.4        1%

         Above Rail                            1,236.2     1,207.8       2%

         Track Access                           487.7       598.1       (18%)

         Other                                   0.9         7.3        (88%)

  Total Revenue                                1,724.8     1,813.2      (5%)

  Operating Expenses                           (1,115.0)   (1,202.0)     7%

  EBITDA                                        609.8       611.2         -

  Depreciation and amortisation                (194.7)     (182.6)      (7%)

  EBIT                                          415.1       428.6       (3%)

  Operating Ratio                               75.9%       76.4%       0.5ppt

  Operating Ratio (excluding access revenue)    66.4%       64.7%      (1.7ppt)
                                                                                  58
FY2019 RESULTS   ADDITIONAL INFORMATION

Coal financial and operating metrics

                                                           FY2019   FY2018   Variance

  Tonnes (m)                                               214.3    212.4      1%

  NTKs (bn)                                                 50.5     50.4        -

  Above Rail Revenue /NTK ($/’000 NTK)                      24.5     24.0      2%

  Opex (excl access)/NTK ($/’000 NTK)                       16.6     15.4     (8%)

  Locomotive Productivity (000’s NTK / Active loco days)   419.9    462.8     (9%)

  Wagon Productivity (000’s NTK / Active wagon days)        16.1     16.4     (2%)

  Payload (tonnes)                                         7,496    7,447      1%

  Velocity (km/hr)                                          22.8     23.2     (2%)

  Fuel Consumption (l/d GTK)                                2.93     2.91     (1%)

  Contract Utilisation                                      90%      93%     (3.0 ppt)

                                                                                         59
FY2019 RESULTS   ADDITIONAL INFORMATION

Coal haulage tonnes (mt) by system

                                          FY2019   FY2018   Variance

  CQCN

  Newlands                                 18.8     20.4     (8%)

  Goonyella                                61.0     62.4     (2%)

  Blackwater                               58.9     58.5      1%

  Moura                                    13.6     11.2     21%

  Total CQCN                              152.3    152.5       -

  NSW & SEQ

  West Moreton                             7.4      7.6      (3%)

  Hunter Valley                            54.6     52.3      4%

  Total NSW & SEQ                          62.0     59.9      4%

  Total Coal                              214.3    212.4      1%

                                                                       60
FY2019 RESULTS          ADDITIONAL INFORMATION

Coal contract portfolio

COAL CONTRACT PORTFOLIO EXPIRY PROFILE                                                                                                    ANNUALISED FORECAST COAL CONTRACTED
(AS AT 30 JUNE 2019)1                                                                                                                     VOLUMES (MTPA)1

                                                                                                                                                                                                                        249
                                                                                                                                                                                            238
                                                            0 - 3 years                                                                                         229

                                                       13%                                                                                                                                                               69
                                                                                                                                                                                             63
                                                                                                                                                                 63

                                                                                >3 - 7 years
                                                                     15%

                                                                                                                                                                                            175                         180
                                                                                                                                                                166
                          72%
          >7 years

                                                                                                                                                            FY2018a                     FY2019a                     FY2020f

                                                                                                                                                                                NSW & SEQ                      CQCN

1.     This represents the contracted tonnes as at 30 June 2019 and includes nominations, options and other uncertain events that have the potential to cause variance in AZJ contracted tonnes. It also incorporates the Glencore contract
       extensions and additional volume signed after 30 June 2019                                                                                                                                                                             61
FY2019 RESULTS                            ADDITIONAL INFORMATION

    Coal contract portfolio

         AURIZON COAL CONTRACT VOLUME EXPIRY BY YEAR (MTPA – AS AT 30 JUNE 2019)
                            60
                                         Contracted volume expiry
                                         Glencore extension / new volume
                                         Jellinbah extension

                            45
Million tonnes per annum

                            30

                            15

                              0
                                       FY20            FY21            FY22            FY23             FY24            FY25            FY26            FY27             FY28            FY29            FY30
                           Notes:
                           ›   This represents the maximum contracted tonnes as at 30 June 2019, adjusted for the Glencore contract extensions and additional volume signed after 30 June 2019. Announced contract tonnages
                               may not necessarily align with current contract tonnages.
                           ›   Incorporates contract extension options where applicable.
                           ›   Includes immaterial variations to volume/term not announced to market.

                                                                                                                                                                                                                              62
FY2019 RESULTS                ADDITIONAL INFORMATION

   Australia FY2018 Coal Supply Summary

      Coal Production                  Domestic Consumption                             Export                    All Coal Export (By Destination)                                      All Coal Export (By Port)
                                                                                                                        118mt                                                                  157mt

     450mt                                   68mt                                382mt                                            89mt                                                                    120mt

                                                                                                                         31%               48mt      47mt              48mt                     41%                 67mt
                                                                                                                                  23%                         32mt                                        31%
          State Split                          State Split                           State Split^                                                                                                                           28mt      7mt
                                                                                                                                           13%       12%               13%                                          17%                         5mt
                                                                                                                                                              8%                                                                      2%        1%
                                                                                                                                                                                                                             7%
                7mt                                7mt                                                                  Japan     China    India    South    Taiwan   Rest of                Newcastle    Hay     Gladstone Abbot   Brisbane    Port
                                                                                                                                                    Korea             World                               Point             Point              Kembla
                                                              27mt                 162mt
       194mt
                         249mt                                                                       223mt
                                               33mt                                                                Metallurgical Coal Export (By Destination)                           Thermal Coal Export (By Destination)
                                                                                                                         44mt                                                                81mt
                                                                                                                                  40mt
                                                                                                                                           37mt
          QLD            Other                  QLD          Other                     QLD           NSW
                                                                                                                                                                       30mt
                                                                                                                                                                                                         49mt
          NSW                                   NSW
                                                                                                                         25%                         18mt                                     40%
                                                                                                                                  22%      21%                                                                    29mt
                                                                                                                                                                                                                           23mt
          Coal Type                             Coal Type                             Coal Type                                                               9mt
                                                                                                                                                                       17%                               24%                                    18mt
                                                                                                                                                     10%                                                           14%
                                                                                                                                                              5%                                                            11%      4mt        9%
                                                       4mt                                                                                                                                                                           2%
                                                      (6%)                                                               India    China    Japan    South    Taiwan   Rest of                Japan     China      South    Taiwan    India     Rest of
                                                                                                                                                    Korea             World                                       Korea                        World
                       183mt                                                                         179mt
                       (41%)                                                       203mt
                                                                                                     (47%)
        267mt                                                                      (53%)
        (59%)
                                                    64mt
                                                   (94%)
                                                                                                                     Coal Mining              Aust. Electricity            Export Revenue                QLD Royalties              NSW Royalties
                                                                                                                     Employment               Generation Share

                                                                                                                        38k                        46%                          $60b                      $3.7b                      $1.7b
               Metallurgical                      Metallurgical                            Metallurgical
               Thermal                            Thermal                                  Thermal

^Due to different sources, the sum of state export volume may not equal the national total. Sources - Coal Production: Volume (saleable coal), state split and coal type sourced from Office of Chief Economist (OCE) Resources and Energy Quarterly June
2019. Domestic Consumption: Volume calculated using production (OCE) less exports (OCE). Export Volume and coal type sourced from OCE. Export state split percentage sourced from port/terminal reporting and applied to OCE volume. All Coal
Export (By Destination): Includes anthracite volume, sourced from Australian Bureau of Statistics (ABS) Customised Report. All Coal Export (By Port): Sourced from respective port/terminal reporting. Metallurgical/Thermal Export (By Destination):
Sourced from ABS, Customised Report. Employment: ABS Labour Account Australia, year ended 30 June 2018. Australian Electricity Generation Share: Data for FY17 (GWh, black coal only), sourced from Department of the Environment & Energy,
Australian Energy Update 2018. Export Revenue: Sourced from ABS, Customised Report. QLD Royalties: Sourced from QLD Treasury Mid-Year Fiscal & Economic Review 2018-19. NSW Royalties: Sourced from NSW Department of Planning &
Environment.

                                                                                                                                                                                                                                                            63
FY2019 RESULTS       ADDITIONAL INFORMATION

                  Coal Market | Australia

              AUSTRALIA: METALLURGICAL COAL EXPORT                                                                                                                    AUSTRALIA: THERMAL COAL EXPORT
                   250                                                                                         $300                                                       250                                                                        $150

                                                                                                                        Hard Coking Coal Price (USD/t)

                                                                                                                                                                                                                                                            Thermal Coal Price (USD/t)
                   200                                                                                                                                                    200

                                                                                                               $200                                                                                                                                  $100
 million tonnes

                                                                                                                                                         million tonnes
                   150                                                                                                                                                    150

                   100                                                                                                                                                    100                                                                210
                                                                                                     183       $100                                                                                                                                  $50

                    50                                                                                                                                                     50

                     0                                                                                         $0                                                           0                                                                        $0
                         FY11      FY12    FY13    FY14    FY15      FY16      FY17       FY18      FY19                                                                        FY11 FY12 FY13 FY14 FY15 FY16 FY17 FY18 FY19

                             Export Volume [LHS]     Hard Coking Coal (Average Spot Price) [RHS]                                                                                  Export Volume [LHS]      Thermal Coal (Average Spot Price) [RHS]

                  AUSTRALIA: METALLURGICAL COAL EXPORT (FY2019)                                                                                                           AUSTRALIA: THERMAL COAL EXPORT (FY2019)
                      Record Volume: +5%yr

                                                                                                                                                                                 79mt
                                                                        Record Volume: +17%yr
                             47mt                                                                                                                                                                                   Record Volume: +400%yr
                                          41mt
                                                     35mt                                                                                                                                  47mt
                                                                                                  32mt
                                                                                                                                                                                                        32mt
                                                                   18mt                                                                                                                                           24mt                    21mt
                                                                                   11mt
                                                                                                                                                                                                                              7mt

                             India        China     Japan          South         Taiwan          Rest of                                                                         Japan     China        South    Taiwan     Vietnam      Rest of
                                                                   Korea                         World                                                                                                  Korea                            World

Sources/Notes: Export Volume (and country split) - Australian Bureau of Statistics, Customised Report. Hard Coking Coal Price – Platts (Peak Downs Region product). Thermal Coal Price - Intercontinental Exchange (Newcastle 6,300 kcal/kg
Gross As Received product).                                                                                                                                                                                                                                                              64
FY2019 RESULTS              ADDITIONAL INFORMATION

      Coal Price | Coal Capital & Exploration Expenditure

     HARD COKING COAL SPOT PRICE (US$/t FOB)                                                                                            THERMAL COAL SPOT PRICE (US$/t FOB)

      $300                                                                                                                          $150

      $250
                                                                                                              $204
      $200                                                                                                                          $100
                                                                                                                                                                                                                                               $80
      $150

      $100                                                                                                                            $50

        $50

          $0                                                                                                                           $0
                Jun-       Dec-        Jun-        Dec-        Jun-        Dec-        Jun-       Dec-        Jun-                           Jun-        Dec-        Jun-       Dec-        Jun-        Dec-        Jun-         Dec-          Jun-
                 15         15          16          16          17          17          18         18          19                             15          15          16         16          17          17          18           18            19

                                    Hard Coking Coal (Average Qtr Spot Price)                                                                                                Thermal Coal (Average Qtr Spot Price)

       COAL CAPITAL EXPENDITURE (AUD)                                                                                                    COAL EXPLORATION EXPENDITURE (AUD)
     $2.0b                                                                                  +12%                                   $75m

     $1.5b                                                                                                                                                                                                                 -1%
                                                                                                                                   $50m

     $1.0b

                                                                                                                                   $25m
     $0.5b

     $0.0b                                                                                                                           $0m
                Jun-       Dec-        Jun-        Dec-        Jun-        Dec-        Jun-       Dec-        Jun-                           Jun-        Dec-        Jun-       Dec-        Jun-        Dec-        Jun-         Dec-          Jun-
                 15         15          16          16          17          17          18         18          19                             15          15          16         16          17          17          18           18            19

Sources/Notes: Hard Coking Coal Price – Platts (Peak Downs Region product). Thermal Coal Price - Intercontinental Exchange (Newcastle 6,300 kcal/kg Gross As Received product). Coal Capital & Exploration Expenditure: Australian Bureau of
Statistics. FOB = Free On Board                                                                                                                                                                                                                       65
FY2019 RESULTS                         ADDITIONAL INFORMATION

    Australia coal competitiveness

   METALLURGICAL COAL CASH COSTS (US$/t, CFR INDIA, 2019)                                                                               THERMAL COAL CASH COSTS (US$/t, CFR JAPAN, 2019)
             $160                                                                                                                            $80

             $140
                                                                                                                                             $70
             $120
US$/t

                                                                                                                                 US$/t
             $100                                                                                                                            $60
                                                                                                   $141
                                                                                  $127                                                                                                                              $69                $70
                 $80
                                                                    $112                                                                                                      $62                $63
                                                                                                                                             $50           $59
                                                    $93
                 $60               $82

                 $40                                                                                                                         $40
                                  Russia          Australia        Canada    United States Mozambique                                                   Colombia            Indonesia         Australia       South Africa           Russia
                                                                                                                                                   Note: Thermal Cash Costs (FOB) are energy-adjusted to 6,300 kcal/kg (Gross As Received)

             METALLURGICAL COAL QUALITY                                                                                                      THERMAL COAL QUALITY
                       100                                                                                                                   0%        Increasing
                                  Increasing
                                  quality                                                                                                              quality                                Indonesia
                                                                                                                                                                                                                           Australia
 Coal Strength (CSR)
 Typical Hard Coking

                                                                                                       Export                                10%                                                                                             Export
                       80                             Mozambique                                       Volume                  Ash Content                                                                                                   Volume
                                                                                 Australia
                                                                                                                                             20%                                                               South Africa
                                                                                                                                                                                      China (Domestic)
                       60
                                                          Canada                       United States                                         30%

                       40                Russia                                                                                              40%                India (Domestic)

                             35                30             25            20               15                10                              4,000                4,500             5,000             5,500             6,000                6,500

                                                      Average Coal Volatile Matter (VM)                                                                                     Energy (kcal/kg, Gross As Received)
 Sources/Notes: Cash Costs: Wood Mackenzie Coal Cost Curves (Data: May 2019, Reference Year: 2019), Wood Mackenzie Global Coal Markets Tool (Data: 2019 1H, Reference Year: 2019), Sea freight export terminal assumptions: US –
 East Coast, Canada – West Coast, Australia – Hay Point (Metallurgical) & Newcastle (Thermal), Russia - East. Metallurgical Coal Quality: Wood Mackenzie Global Coal Markets Tool (2019 1H). Thermal Coal Quality: Wood Mackenzie Coal Cost
 Curves (Data: May 2019, Reference Year: 2019), Wood Mackenzie Coal Supply Data Tool (Q1 2019, Reference Year: 2019), India Ministry of Coal Provisional Coal Statistics 2017-18, IEA Coal Medium-Term Market Report 2016, Indonesia Coal
 Mining Association, Richards Bay benchmark specifications (Platts).                                                                                                                                                                                   66
FY2019 RESULTS

        Additional information

        Bulk
FY2019 RESULTS            ADDITIONAL INFORMATION

Bulk snapshot
As at 30 June 2019

                               45                                                           162                                   >10
                     million tonnes                                                        active locos                        products hauled

                   191km                                                                  2,510                                  8.5b
                      average haul
                                                                                          active wagons                             NTK1
                         length

                                                                                         HAULAGE BREAKDOWN

                                                                                                             Bauxite/Alumina
                                                                                             27%             Iron Ore
                                                                                                     48%     Other2

                                                                                             25%
 1.   Net tonnes per kilometre. Payload tonnes x distance payload transported km/1bn
 2.   Includes limestone, chemicals (caustic and sulphuric acid), fuel and agriculture
                                                                                                                                                 68
FY2019 RESULTS   ADDITIONAL INFORMATION

Bulk operations – Queensland

                                          69
FY2019 RESULTS   ADDITIONAL INFORMATION

Bulk operations – Western Australia

                                          70
FY2019 RESULTS   ADDITIONAL INFORMATION

Bulk profit & loss (underlying)

  $m                                      FY2019    FY2018    Variance

  Tonnes (m)                               44.6      54.7      (18%)

  Total Revenue                           501.7     618.1      (19%)

  Total operating expenses                (447.2)   (542.9)    18%

  EBITDA                                   54.5      75.2      (28%)

  Depreciation and amortisation           (17.2)    (25.1)     31%

  EBIT                                     37.3      50.1      (26%)

  Operating Ratio                         92.6%     91.9%     (0.7ppt)

                                                                         71
FY2019 RESULTS   ADDITIONAL INFORMATION

Bulk financial and operating metrics

  $m                                      FY2019   FY2018   Variance

  Tonnes (m)                               44.6     54.7     (18%)

  NTKs (bn)                                8.5      13.4     (37%)

  Operating Ratio                         92.6%    91.9%    (0.7ppt)

  Revenue / NTK ($000 NTK)                 59.0     46.1     28%

  Opex (excl access)/NTK ($/’000 NTK)      42.4     30.3     (40%)

  Fuel Consumption (l/d GTK)               3.29     3.01     (9%)

  Order Fulfilment (%)                    96.0%    98.0%    (2.0ppt)

                                                                       72
FY2019 RESULTS                ADDITIONAL INFORMATION

 Australia Capital & Exploration Expenditure

CAPITAL EXPENDITURE: METAL ORE MINING1                                                                                           EXPLORATION EXPENDITURE: IRON ORE
  A$4.0b                                                                                                                          A$100m                                                            +18%
                                                                                                 +19%

  A$2.0b                                                                                                                            A$50m

  A$0.0b                                                                                                                              A$0m
               Jun-        Dec-         Jun-         Dec-         Jun-         Dec-         Jun-         Dec-                                    Jun-         Dec-   Jun-   Dec-   Jun-   Dec-   Jun-   Dec-
                15          15           16           16           17           17           18           18                                      15           15     16     16     17     17     18     18

    EXPLORATION EXPENDITURE: NICKEL & COBALT                                                                                       EXPLORATION EXPENDITURE: COPPER
 A$100m                                                                                                                           A$100m
                                                                                                                                                                                                    +42%

                                                                                                   +6%

  A$50m                                                                                                                             A$50m

    A$0m                                                                                                                              A$0m
               Jun-        Dec-         Jun-         Dec-         Jun-         Dec-         Jun-         Dec-                                    Jun-         Dec-   Jun-   Dec-   Jun-   Dec-   Jun-   Dec-
                15          15           16           16           17           17           18           18                                      15           15     16     16     17     17     18     18

Source/Notes: Australian Bureau of Statistics, Note: 1Metal Ore Mining includes: Iron ore, Bauxite, Copper, Gold, Mineral Sand, Nickel, Silver, Lead, and Zinc.
                                                                                                                                                                                                               73
FY2019 RESULTS               ADDITIONAL INFORMATION

 Bulk commodities: Global & Australia

 Global & Australia supply growth (CAGR 2019-2024)
 (Selected commodities)

               11.2%

                                          4.0%
                                                                    3.7%

                                                                                               2.6%
                                                                                                                         2.3%

                                                                                                                                                                                                                                  0.9%

              Lithium                    Nickel                    Copper                    Potash                  Phosphate                    Bauxite                   Iron ore                  Alumina                      Zinc

                                                                                                                    Global           Australia

Source/Notes: Lithium, Nickel, Bauxite, Iron ore, Alumina, Zinc: Office of the Chief Economist (Resources & Energy Quarterly March 2019), Potash and phosphate: Food & Agriculture Organization of the United Nations – World fertilizer trends and
outlook to 2020 (growth represents world supply between 2015-2020). Source data not available: Global – bauxite, iron ore & alumina, Australia – Potash & phosphate.
                                                                                                                                                                                                                                                      74
FY2019 RESULTS

        Additional Information

        Network
FY2019 RESULTS              ADDITIONAL INFORMATION

     Network snapshot
     As at 30 June 2019

                                     233                                                                         40+                                          three
                                                                                                                                                               above rail
                               million tonnes                                                             mines serviced
                                                                                                                                                               operators

                              $5.7b                                                                             five                                    2,670km
                            Regulated Asset
                                                                                                        export terminals                                      railway track
                                Base1

                                                                                             HAULAGE BREAKDOWN2 FY2019
                                                                                                                      (estimate)

                                                                                                                                         Thermal Coal
                                                                                                                                   31%   Metallurgical Coal

                                                                                                                 69%

1.   Estimate at 1 July 2019 - Roll forward value based on UT5FD (excludes $0.4bn in assets operating under an AFD)
2.   Estimate – based on AZJ analysis, represents coal hauled on the CQCN by all operators                                                                                    76
FY2019 RESULTS   ADDITIONAL INFORMATION

Central Queensland Coal Network (CQCN)
CQCN comprises four major coal systems and one connecting system link (GAPE) servicing
Queensland’s Bowen Basin coal region

                                                                                         77
FY2019 RESULTS   ADDITIONAL INFORMATION

Network profit & loss (underlying)

                                          FY2019    FY2018    Variance
  $m

 Tonnes (m)                               232.7     229.6       1%

 Access Revenue                           1,070.3   1,167.1    (8%)

  Services and other                       47.4      51.6      (8%)

 Total Revenue                            1,117.7   1,218.7    (8%)

 Operating costs                          (396.5)   (430.1)     8%

 EBITDA                                   721.2     788.6      (9%)

 Depreciation and amortisation            (320.9)   (308.0)    (4%)

 EBIT                                     400.3     480.6      (17%)

 Operating Ratio                          64.2%     60.6%     (3.6ppt)

                                                                         78
You can also read