Secure Income REIT Plc - 9 March 2018 www.SecureIncomeREIT.co.uk
←
→
Page content transcription
If your browser does not render page correctly, please read the page content below

Secure Income REIT Plc

9 March 2018

www.SecureIncomeREIT.co.uk
Secure Income REIT Plc is a specialist UK REIT, selectively investing in key
operating real estate assets in defensive sectors that provide long term rental
 income with inflation protection. As at 31 December 2017 it owned a £1.77
billion portfolio of 81 high quality assets let to financially strong businesses.
 An investment in the Company offers secure, growing income streams and
strong foundations for sustainable capital growth, while continuing to deliver
      attractive risk adjusted returns for shareholders over the long term.

                                                                                    2
1. Introduction

2. December 2017 financial highlights

3. New acquisitions:
    − The Manchester Arena
    − The Brewery
    − Stonegate Pubs
    − Travelodge Hotels
    − Financing & Pro Forma Enlarged Group NAV

4. Enlarged Portfolio Analysis

                                                 Warwick Castle
Secure Income REIT Plc

 ▪     The current portfolio of 81 properties is valued at £1.77bn

       ▪    Let to substantial businesses in defensive sectors

       ▪    Long WAULT of 22.2 years with no breaks

       ▪    58% subject to fixed annual uplifts averaging 2.8% p.a. and 42% to uncapped, upwards only RPI reviews

 ▪     The Company has delivered strong Total Accounting Returns of 26% p.a. since listing in June 2014

 ▪     The Company has an experienced board, chaired by Martin Moore and with Leslie Ferrar, Jonathan Lane and Ian
       Marcus along with Nick Leslau, Mike Brown & Sandy Gumm from the external investment adviser, Prestbury

 ▪     The Prestbury team has a track record of outperformance over many years and is closely aligned with
                                              1
       shareholders with a c. £137m stake – one of the largest management stakes in the sector.

1 £137 million held at 9 March valued at the Placing Price                                                           4
Existing Portfolio
Multi sector portfolio underpinned by strong tenant covenants
Portfolio total passing rent £95.7m at 31 December 2017 from 81                                 Portfolio Value December 2017: £1.77bn
key operating assets with income security from strong operating                                            Travelodge
businesses underpinning £1.77bn of property value                                                            Hotels
                                                                                                              13%
                                                                                              Orpea
 Hospitals:                                                                                  Hospitals
  ▪ 49% of rent guaranteed by Ramsay Health Care Limited: £7.2bn                               3%                              Merlin UK
                                                                                                                                Theme
    market capitalisation ASX 50 company and one of the top five                                                                Parks
    private hospital operators in the world                                                                                      27%
                                                                                                                 Ramsay
  ▪ 2% of rent guaranteed by Orpea SA, mental health and aged care                                               Hospitals
                                                                                                                   51%
    specialists, listed on Euronext with £5.6bn market capitalisation
 Theme Parks:                                                                                                                              Merlin German
                                                                                                                                           Theme Parks
  ▪ 34% of rent guaranteed by Merlin Entertainments Plc: FTSE 250                                                                                6%
    company with £3.8bn market capitalisation: second largest visitor
    attractions company in the world and largest in Europe                                      Portfolio Rent December 2017: £95.7m p.a.

 Budget Hotels:
                                                                                                      Orpea
  ▪ 15% of rent guaranteed by Travelodge Hotels Ltd: a well-                                         Hospitals
                                                                                                       2%         Travelodge
    capitalised business with financial year 2017 revenue growth of                                               Hotels15%      Merlin
    6.6% to £637.1m and an increase in EBITDA to £112.4m; one of                                                                 Theme
    the UK’s top two budget hotel brands                                                                                         Parks
                                                                                                                                  34%
 Overall:
   ▪ 58% of rent subject to fixed minimum annual uplifts averaging                                               Ramsay
                                                                                                                 Hospitals
     2.8% p.a. until at least 2037, 42% to uncapped upwards only RPI                                               49%
     uplifts

Sources: Market data as at 1 March 2018 using AUD/GBP exchange rate of A$1:£0.56423 and EUR/GBP exchange rate of €1:£0.88826
For further information please see Appendix 2, pages 41 to 43

                                                                                                                                                    5
31 December 2017 Financial Highlights

                                                                        31 December 2017                 31 December 2016                   % change

   • Net Assets                                                                 £860.6m                          £737.4m                      ↑ 16.7%

   • EPRA Net Asset Value                                                       £870.8m                          £745.9m                      ↑ 16.7%

   • EPRA Net Asset Value per share                                              370.4p                           323.6p                     ↑ 14.5%

   • EPRA NAV per share growth plus dividends                                    18.7%                            16.5%                       ↑ 2.2pp

   • Net LTV                                                                     49.6%                            53.5%                       ↓ 3.9pp

                                                                        31 December 2017                 31 December 2016                   % change
                                   1
   • Adjusted EPRA EPS                                                            13.6p                            11.3p                      ↑ 20.4%

   • Dividends per share (commenced Aug 2016)                                     13.6p                             5.8p                         n/a

   • Annualised DPS at year end                                                   14.0p                            11.8p                      ↑ 19.1%

        ▪    Total shareholder return and total accounting return for the year 18.7%

1 Adjusted to exclude rental income in excess of cash rents received as a result of the accounting requirement to spread the impact of fixed rental uplifts
                                                                                                                                                              6
over the lease term and other non recurring items (see slide 47)
EPRA NAV Progression

                                                                                            £m                Pence
      • EPRA NAV at 31 December 2016                                                      745.9               323.6
      • Valuation uplifts:
      •  Healthcare                                                                        51.6                22.4
      •  UK Leisure                                                                        33.2                14.4      7.6% uplift
                                                                                                   £124.9m                  since
      •       German leisure (constant currency)                                            7.8                3.4      December ’16
      •   Travelodge Hotels                                                                32.3               14.0       at constant
      • Net results                                                                        31.4               13.7        currency

      • Incentive fee                                                                        -                (7.4)
      • Irrecoverable VAT on incentive fee                                                 (1.6)              (0.6)
      • Currency translation movements                                                      1.4                0.5
      • Dividends paid                                                                    (31.2)              (13.6)
      • EPRA NAV at 31 December 2017                                                      870.8               370.4
                                                                                                             up 14.5%

          ▪   Portfolio valuation up 7.8% since 31 December 2016 to £1.77 billion
          ▪   Passing rents up 3.3% like-for-like to £95.7m at 31 December 2017
          ▪   Valuation net initial yield 5.1%: 22bps yield compression on portfolio since December 2016

For further information please see page 45 for the detailed Dec 2017 property valuation uplift                                    7
Adjusted EPRA Earnings

                                                       2017                                2016

                                               £m             Pence                  £m            Pence
  Net rent:
   Like for like portfolio                     80.5              34.9                77.9            40.9
   Travelodge (from Oct 2016)                  13.9               6.0                2.4             1.1
  Net finance costs
   Like for like portfolio                    (49.1)             (21.2)             (49.2)          (25.7)
   Travelodge (from Oct 2016)                  (1.9)             (0.8)               (0.4)           (0.2)
  Admin & corporate costs                     (11.9)             (5.1)               (9.1)           (4.8)
  Tax                                          (0.3)             (0.2)                 -               -
  Adjusted EPRA EPS                            31.2              13.6                21.6            11.3
                                                                +20%

   ▪    Positive impact of 3.3% rental uplifts resulting in Adjusted EPRA EPS growth and therefore dividend
        growth
   ▪    Fully covered quarterly dividends with in-built uplifts providing inflation protection

                                                                                                              8
Delivering Strong Total Returns

                                                   Performance since listing in June 2014
       ▪       NAV per share up 113%                                          ▪     Net LTV down from 80% to under 50%
       ▪       Like-for-like portfolio value up 36%                           ▪     Annualised DPS 14p per share (3.8% on Dec ‘17 EPRA
                                                                                    NAV)

                                                                 Total Accounting Return

425p                                                                                                                 6.6p             7.0p     •     CAGR since Mar
                                                                                                    5.9p
325p                                                                                                                                                 2016 secondary
                                                                                                                   355.5p           370.4p           placing 27.4% p.a.
225p                                                                               300.2p         323.6p
                               258.5p        275.3p            282.8p                                                                          •     CAGR since Oct
125p        184.5p                                                                                                                                   2016 placing
25p                                                                                                                                                  25.7% p.a.

-75p        Jun-14             Dec-14        Jun-15 1       Dec-15                 Jun-16          Dec-16          Jun-17           Dec-17
                                                    EPRA NAV per share             Dividends per share

                   Adjusted EPRA EPS                                         Dividends and DPS                                 Net Loan to Value
                                                                                                  14.0p
                                             13.6p                                  13.1p                              69.7%
                                   11.3p             £14.0m
                                                                                                                                 61.0%
                                                                                                                                             53.5%      49.6%
                                                                  11.8p
                                                                    £12.0m

                                                                                     £15.1m

                                                                                                    £16.1m
                       2.6p
            0.0p
                                                      £7.0m
           Dec-14     Dec-15      Dec-16    Dec-17             Dec 2016           June 2017    Dec 2017               Dec-14    Dec-15       Dec-16     Dec-17

   1 Pro forma figures for the completion of the sale of Madame Tussauds and the refinancing of the Group’s entire debt which occurred subsequent to
   the balance sheet date

                                                                                                                                                                   9
New Acquisitions

                   Warwick Castle
Delivering on our growth strategy: Two simultaneous off-market acquisitions
▪ Leisure portfolio:
▪ £224m gross cost
▪ Manchester Arena, The Brewery at Chiswell Street, 17 Travelodge Hotels & 18 Stonegate Pubs
1
− WAULT c.18.0 years
− NIY 5.9%
− 72% of rents with RPI reviews; 26% with fixed reviews; 2% upwards only open market reviews
− 100% occupational leases on FRI terms
▪ Hotels portfolio: Total Acquisitions by Cost
▪ £212m gross cost
▪ 59 Travelodge Hotels Manchester
1 Arena
− WAULT c.23.5 years 24%
− NIY 6.1%
Travelodge
− 100% of rents with uncapped upwards only five yearly RPI reviews Stonegate Hotels
Pubs 57%
− 100% occupational leases on FRI terms 6% Brewery
13%
▪ £436m gross cost
▪ Placing to raise £315.5m at Pro Forma EPRA NAV of 365.0p per share
▪ £128.7m of new non-recourse debt at 30% loan to cost and expected 3.4% p.a.
▪ Management & board investing £5.25m cash at the placing price bringing the value of their aggregate holding to
over £143m at the placing price
1 WAULT is calculated from 9th March 2018 and excludes any rent-free incentives
11Acquisitions: Benefits for the Group
▪ Dividend accretive: post acquisition dividend yielding 4.3% on placing price
▪ Material deleveraging: from 49.6% to 45.8%
▪ Total returns: base case outlook c. 10% p.a. over the next 5 years1
▪ Long term secure income:
− WAULT of 21.7 years2
− Rent subject to upwards only RPI reviews increases from 42% to 51%.
− 48% of rents subject to fixed uplifts with the remaining 1% subject to upwards only open market reviews
− 70% of rent subject to annual uplifts (as opposed to five yearly)
▪ Value-enhancing asset management opportunities
▪ Increases EPRA NAV to c. £1.2bn
1 EPRA Net Asset Value growth plus dividends. See assumptions on page 38 12
2 WAULT is calculated from 9th March 2018 and excludes any rent-free incentivesManchester Arena
Manchester Arena
▪ Strategic 8 acre long leasehold property1 on top of Manchester Victoria Railway and Metrolink station, close to
prime retail, restaurants, leisure and NOMA regeneration scheme
▪ UK’s largest indoor arena by capacity at 21,000 seats and ranked 2nd in the UK and 4th globally by ticket sales
▪ Arena let to SMG – (the world’s largest venue management company), unexpired term 27 years, passing rent
£3.68m p.a. with annual RPI reviews (collared at 2%-5% p.a.)
− leading global venue manager with 40+ years of experience
− 25 years of uninterrupted EBITDA growth averaging 8% p.a.
− 239 venues globally
− 16m tickets sales annually
− Acquired for $1bn in December 2017 by Onex, VC with over $30bn under management
▪ 160,000 sq. ft of offices & leisure space, 1,000 space multi-storey car park and advertising hoardings
▪ In addition to SMG, let to Serco, Manchester City Council, Unison, JCDecaux and Teamsport, combined passing
rent £2.71m p.a.
▪ Potential additional income generation from asset management
▪ £5.75m net income p.a. contracted to rise to £5.92m p.a. on expiry of lease incentive with a WAULT of c. 18 years2
▪ Next SMG rent review on 15 June 2018 anticipated to take net income over £6m p.a.
1 176 year leasehold with 10% of rents received payable to Network Rail
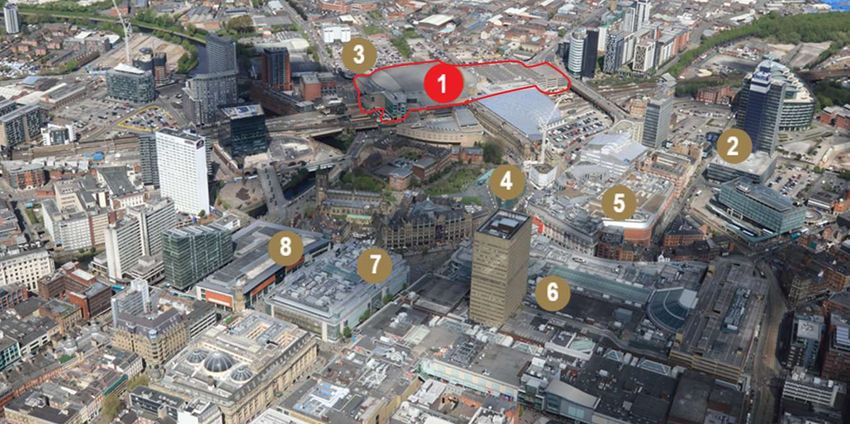
2 WAULT is calculated from 9th March 2018 and excludes any rent-free incentives 14Manchester Arena – Aerial View
1 Manchester Arena 5 Printworks
2 NOMA Estate 6 Manchester Arndale Centre
3 Old Boddington Brewery Site 7 Selfridges
4 National Football Museum 8 Harvey Nichols
15The Brewery at Chiswell St, London EC1
The Brewery at Chiswell St, London EC1

    ▪ 66,000 sq ft (GIA) predominantly freehold investment1

    ▪ Largest catered events venue in the City of London

             − 9 function rooms

             − 700+ dinner capacity in the main event space, only behind Grosvenor House and Park Lane Hilton

             − Well located: Crossrail station within 5 minutes walk (Moorgate entrance to Liverpool Street)

    ▪ Winner of two London Venue Awards 2016

    ▪ Let to specialist venue operator until July 2031 at £3.4m p.a. rising five yearly 2.5% p.a. compound

    ▪ Asset management opportunities

1 The property is predominantly freehold and part 999 year lease from 2006                                      17
The Brewery at Chiswell St, London EC1
Entrance The Porter Tun Room King George III Room
Queen Charlotte Room Upper Sugar Room James Watt
18Travelodge Hotels
Travelodge Bath CentralTravelodge Hotels
▪ 76 hotels1 let to Travelodge Hotels Ltd - gross cost £245.5m
− WAULT of 23.1 years2
− Rent of £15m p.a. subject to 5 yearly upward only uncapped RPI reviews
▪ Largest lot sizes in Bath, London Morden, London Park Royal, Heathrow Heston, Reading, Dartford and
Birmingham
▪ 50% by value in 17 locations average lot size c.£7m
▪ 50% by value average lot size c.£2m
▪ 58% freehold/virtual freehold; 28% long leasehold; 14% short leasehold3
▪ Adding to existing hotels portfolio provides opportunity for portfolio rationalisation and asset management
opportunities
1 59 in Hotels portfolio and 17 in Leisure portfolio
2 Calculated from 9th March 2018
3 Analysis by value; short leasehold refers to properties with less than 80 years unexpired
20Travelodge Portfolio Analysis
Attractive portfolio diversified by location, type and value
Location
Top 50% by purchase cost 39 Milton Keynes Old Stratford
1 Bath Central 40 Warrington
2 London Wimbledon (Morden) 41 Bedford Wyboston
3 Heathrow Heston M4 Westbound 42 Stratford Alcester
4 Reading Central 43 Alfreton
5 London Park Royal 44 Birmingham Sutton Coldfield
6 Dartford 45 Telford Shawbirch
7 Birmingham Central 46 Stafford M6
8 Cambridge Fourwentways 47 Stirling M80
9 York Tadcaster 48 Oswestry
10 Arundel Fontwell 49 Bournemouth
11 Southampton Eastleigh 50 Peterborough Alwalton
12 Ilminster 51 Chester
13 Leeds Central 52 Pontefract Ferrybridge A1/M62
14 Medway M2 53 Middlewich
15 Plymouth Derriford 54 Dundee
16 Heathrow Heston M4 Eastbound 55 Leeds
17 Towcester Silverstone 56 Nottingham, Wollaton Vale
18 Brentwood East Horndon 57 Chippenham Leigh Delamere M4 Westbound
19 Great Yarmouth Acle 58 Birmingham
20 Reading M4 Westbound
59 Birmingham Oldbury
21 Lincoln Thorpe on the Hill
60 Cambridge Swavesey
22 Frimley
61 Coventry
23 York
62 Basildon, Wickford
24 Chippenham Leigh Delamere M4 Eastbound
63 Liverpool, Aigburth
25 Inverness
64 Stonehouse
26 Reading M4 Eastbound
65 Plymouth Roborough
27 Canterbury Whitstable
66 Macclesfield Adlington
28 Bracknell
29 Widnes 67 Barnsley
30 St Clears Carmarthen 68 Scotch Corner Skeeby
31 Stoke Talke 69 Edinburgh Musselburgh
32 Okehampton Sourton Cross 70 Cardiff Llanedeyrn
33 Liverpool Docks 71 Stoke on Trent
34 Swansea M4 72 Leicester
35 Cirencester 73 Preston Chorley
36 Birmingham Hilton Park M6 Southbound 74 Derby
37 Perth 75 Carlisle Todhills
38 Birmingham Frankley M5 Southbound 76 Grantham, South Witham
21Travelodge
A leading UK Hotel Brand
▪ UK’s second largest hotel brand by number of hotels and rooms
▪ Excellent market position with some 19m customers, 558 hotels and over 42,000 rooms at 31 December 2017
▪ Results for the year ended 31 December 2017:
− Revenue up 6.6% from £597.8m to £637.1m
− EBITDA up 2.1% from £110.1m to £112.4m
− RevPAR1 growth 0.7pts ahead of competitive segment
− Cash £95m and £50m undrawn revolving credit facility
▪ Well invested modernised hotel portfolio
▪ Well balanced approximately even business/leisure customer split
▪ Almost 90% booking direct, with c. 80% through own websites
▪ Low upfront capex leasehold model
1 Revenue per available room 22Travelodge Hotels
Bath Central Dartford Cirencester
Cambridge Fourwentways London Wimbledon (Morden) Leeds Central
23Stonegate Pubs
The Bedford Arms, SouthamptonStonegate Pubs
▪ Freehold portfolio of 18 pubs let to or guaranteed by
Stonegate Pub Co Ltd, the UK’s largest privately
managed pub operator by number of sites - gross cost
£29.7m
▪ WAULT of c. 22 years1 with no breaks
▪ Passing rent of £1.96m p.a. subject to five yearly RPI
uplifts with 1%- 4% p.a. collar
▪ Average lot size of £1.6m
▪ Stonegate has a Moody’s B2 credit rating and is owned by
TDR who have a long experience in the leisure sector
including David Lloyds, Center Parcs and Pizza Express
▪ EBITDA has risen to £98m 2 2017 from £70m in 2015
Source: ONS, OBR
1 Calculated from 9th March 2018
25
2 In 52 weeks ending 9th April 2017Stonegate Pubs
Slug and Lettuce, Southsea The Bedford Arms, Southampton
Faradays, Nottingham The Abbey, Gloucester
7 Nottingham 13 Brighouse
1 Southsea
8 Lincoln 14 Middlesborough
2 Southampton
9 Liverpool 15 East Boldon
3 Farnham
10 Bolton 16 South Shields
4 London
11 Preston 17 Cramlington
5 Gloucester
12 Huddersfield 18 Kirkcaldy
6 Wolverhampton
The Occasional Half, Palmers Green Slug and Lettuce, Farnham
26Financing and Pro Forma Enlarged Group NAV
▪ Specific deal funding:
− transparency for investors
− enhances returns by avoiding cash drag
▪ Issue of 86.4m new shares at pro forma EPRA NAV of 365.0p per share
▪ £128.7m of new secured debt
Hotels portfolio Leisure portfolio Equity Issue (net
Dec 2017 1 2 Pro forma EPRA NAV
at cost at cost of costs)
£m £m £m £m £m
Investment property 1,770.2 210.0 219.0 2,199.2
Acquisition costs 1.7 5.3 7.0
Write off acquisition costs (1.7) (5.3) (7.0)
Debt (967.3) (68.7) (60.0) (1,096.0)
Prepaid finance Fees 12.0 1.1 1.3 14.4
Cash 89.1 (144.1) (165.6) 309.7 89.1
Other net assets (33.2) (33.2)
EPRA NAV 870.8 (1.7) (5.3) 309.7 1,173.5
3
EPRA NAV (p/share) 370.4 365.0
Net LTV 49.6% 45.8%
1 £5m non-refundable deposit paid at exchange
2 £6m non-refundable deposit paid at exchange
3 Based on 230,536,874 shares currently in issue and 4,588,479 committed to be issued in March 2018; 321,563,353 shares in issue following Placing
– see assumption 10 slide 38
27New Debt Facilities
▪ Strong interest from major UK clearing banks & institutions in competitive process
▪ Two new ring-fenced facilities
− Five year terms
− Expected blended marginal cost expected 3.4% on 30% blended LTC
− Significant covenant headroom
− Cure rights as usual for SIR facilities
− Only limited make-whole payments and pre-payment fees
▪ Floating rate facilities, to be hedged to limit interest rate exposure
▪ Maturities designed to facilitate enlarged group access to debt capital markets in due course
Leisure Portfolio
Total Hotels Total New Debt
(excl. hotels)
Cost £243.3m £185.7m £429m
Loan principal £68.7m £60m £128.7m
Expected interest cost 3.4% p.a. 3.4% p.a. 3.4% p.a.
Initial LTV 28.2% 32.3% 30.0%
Default LTV 50.0% 50.0%
Initial ICR 650% 550%
Default ICR 250% 150%
Valuation fall to default LTV 44% 35%
Income fall to default ICR 61% 73%
28Enlarged Group Debt
▪ Reduction in net LTV from 31 December 2017 49.6% to 45.8%
▪ Weighted average term to maturity 6.0 years at April 2018
▪ Weighted average cost c. 4.9% p.a.
▪ Pro forma post acquisition interest cover 2.3x 1
▪ On base case assumptions2 net LTV expected to further reduce to c. 38% at June 2023
Illustrative Portfolio Valuation and Net LTV at Constant Valuation Yield2
2,570.9
38.3%
There is no certainty that these illustrative projections will be achieved
1 Interest cover for these purposes is measured as current passing rent divided by current annualised interest cost
29
2 See assumptions on page 38Enlarged Portfolio Analysis
Heide ParkEnlarged Portfolio Data: Key Statistics
1
Valuation by Type
July 2018
• Dec 2017
Theme Park Running
NIY 1
Hotels Yield
5% Existing • Hospitals • 4.9% 5.0%
Hotels • Theme Parks • 5.1% 5.3%
10% Brewery • Hotels • 5.8% 5.9%
New Hotels 3% • Arena 5.6%
11% • Brewery 6.1%
Stonegate
1% • Pubs 6.6%
Theme Parks
Manchester • Total Portfolio • 5.1% 5.3%
22%
Arena
5%
Healthcare 2
43% WAULT (years)
• Theme Parks 24.4
• Hotels 24.2
• Pubs 21.9
• Hospitals 19.5
• Arena 17.9
• Brewery 13.3
21.7
1 Existing portfolio at 31 December 2017 independent valuation and acquisition at cost
31
2 WAULT is calculated from 9th March 2018 and excludes any rent-free incentivesIllustrative Distribution Outlook
5 year CAGR
Jun 18- 23
22
6.3% p.a.
5.6% p.a.
Distributions per share (pence)
20
3.3% p.a.
18
16
14 RPI Swap Curve + 100 bps
RPI Swap Curve
Zero or lower RPI growth
12
Jun-18 Jun-19 Jun-20 Jun-21 Jun-22 Jun-23
▪ Pay-out ratio of 1x Adjusted EPRA EPS
▪ Following completion of placing and acquisition, dividend to increase to annualised 15.7p per share on
base case assumption: first increased payment expected Q3 2018
▪ Following distribution of enhanced net income, dividend yield of c.4.3% on Placing Price of 365.0p
▪ Illustrative 5 year dividend growth CAGR (2018-2023) on base case assumptions of 5.6% p.a.
1
1 See assumptions on page 38 - There is no certainty that these illustrative projections will be achieved 32Total Return Outlook
1
EPRA NAV plus Dividends on Base Case
Net LTV 44.8% 44.0% 43.0% 41.4% 39.7% 38.3%
600
89.3
500 68.8
49.7
15.7 32.2
400
Pence per share
300
484.5
460.1
431.7
200 392.8 406.0
365.0
100
0
Jun-18 Jun-19 Jun-20 Jun-21 Jun-22 Jun-23
EPRA NAV per share (pence) Accumulated dividends (pence)
1 See assumptions on page 38 - There is no certainty that these illustrative projections will be achieved 33Total Shareholder Return Scenarios
Attractive growth prospects on steady state portfolio basis
1
TSR (Jun 2018 – Jun 2023)
Property Valuation Base case: RPI
RPI curve +1% RPI curve -1% Zero or lower RPI
Yield (net) Curve
-50 bps 13.8 % 13.2 % 12.6 % 11.3 %
-25 bps 12.4 % 11.7 % 11.0 % 9.6 %
Base case 10.9 % 10.2 % 9.5 % 8.0 %
+25 bps 9.4 % 8.6 % 7.9 % 6.4 %
+50 bps 7.9 % 7.2 % 6.4 % 4.9 %
Base case
▪ Base case 10.2% TSR from 30 June 2018 to 30 June 2023 assuming investment at Placing Price and final
valuation at EPRA NAV
▪ Assumes a constant valuation yield on the combined portfolio and based on the assumptions on pg.38
1 See assumptions on page 38 - There is no certainty that these illustrative projections will be achieved 34Summary
▪ Exciting proposed new off-market acquisition would:
✓ offer 4.3% dividend yield on placing price
✓ further diversify the portfolio
✓ provide estate management opportunities
✓ maintain WAULT of enlarged portfolio at c.22 years
✓ increase EPRA NAV by over a third to c. £1.2bn
✓ increase RPI review exposure from 42% to 51%
✓ reduce LTV from 50% to 46%
✓ generate base case TAR c. 10% p.a.
▪ Consistently strong performance over 3.5 years since listing with a doubling of NAV per share,
driving total Accounting Return since June 2014 IPO of 25.9% p.a.
▪ Very resilient portfolio of key operating assets let to strong businesses in defensive sectors with
high barriers to entry
▪ RPI & fixed rental uplifts combined with fixed cost debt drives healthy dividend growth, creating
attractive and predictable returns
1
▪ Prestbury’s c. £137m stake provides strong alignment with shareholders – management and
Board investing a further £5.2m at the placing price
1 £137 million held at 9 March valued at the Placing Price 35Placing Summary
Secure Income REIT Plc
Issuer Ticker: SIR
UK REIT, traded on AIM
Placing of up to 86,438,000 ordinary shares to raise gross proceeds of up to £315.5m
Placing Price Placing Price of 365.0 pence per share equal to pro forma EPRA NAV per share
New shares entitled to May 2018 dividend
Placing opens: 9 March 2018
1 Placing closes: 11.30am on 26 March 2018
Timetable
Extraordinary General Meeting to approve increase in share capital: 27 March 2018
Admission and settlement: 29 March 2018
Non pre-emptive placing to qualified institutional investors
Offer Structure Outside the US in reliance on Regulation S
Following Admission, the Placing Shares will rank pari passu with existing shares
Stifel Nicolaus Europe Limited
Sole Bookrunner
Mark Young 020 7710 7633 David Arch 020 7710 7616 Peter Lees 020 7710 7490
contact details
Tom Yeadon 020 7710 7480 Neil Winward 020 7710 7460 Rob Tabor 020 7710 7669
1 The times and dates above may change. Any such change will be notified by announcement through a Regulatory Information
Service. References to time are to London time. The timetable above assumes that the resolutions are passed at the General Meeting without
adjournment 36Appendix 1: Assumptions and Glossary
Travelodge Manchester CentralAssumptions
1. Employs RPI swap curve at 27 February 2018, averaging inflation increases of 3.3% p.a. over the period
2. Constant property valuation yield at 31 December 2017 external valuation yields for existing portfolio and 6.0%
yield on acquisition cost for new acquisitions
3. Only fixed uplifts included on Ramsay leases: ignores potential for further uplifts from open market reviews
4. Other than the target portfolios referred to in this presentation, no purchases or sales of properties or lease
variations. Target portfolio acquisitions assumed to close on 1 April 2018.
5. 31 December 2017 exchange rate (€1:£0.8873) used throughout illustrative periods (Euro denominated EPRA
net assets amount to c.5.1% of the whole at 31 December 2017 and estimated c.3.8% on a pro forma basis after
acquisition)
6. Valuation yield shift on sensitised valuation scenarios occurs on last day of calculation period
7. Expected cost of funds (five year swap rate) on new debt 1.38% – will not be fixed by way of hedging until after
purchase contracts are unconditional
8. The investment advisory agreement between SIR and Prestbury expires in June 2022 with no renewal rights on
either side. The returns illustrations assume that the existing arrangements continue unchanged beyond that
date
9. In October 2022 the existing leisure loan facility matures. At that time the loan principal will be £372.5m at 31
December 2017 Euro exchange rate and the base case property valuation as at 31 December 2017 valuation
yield and Euro exchange rate is estimated at £702.3m. The illustrative returns assume that the existing loan
continues on the same terms
10. Pro forma EPRA NAV per share is calculated as 230.5m shares currently in issue plus 4.5m to be issued in
March for the 2017 Incentive Fee plus 86.4m for the placing
11. The Company raises gross proceeds of £315.5 million from the Placing
38Glossary
DPS Dividends per share
DSCR Debt service cover ratio, measured as rental income divided by payments due to lenders (comprising
interest or interest plus amortisation as specified in relevant credit agreement)
EPRA European Public Real Estate Association
EPRA EPS A measure of EPS designed by EPRA to present underlying earnings from core operating activities
EPRA NAV A measure of NAV designed by EPRA to present the fair value of a company on a long term basis by
excluding items such as interest rate derivatives held for long term benefit, net of deferred tax
EPS Earnings per share, calculated as the earnings over a period, after tax, attributable to members of the
parent company divided by the weighted average number of shares in issue over the period
Net Initial Yield Annualised net rents on investment properties expressed as a percentage of the investment property
valuation, less purchasers’ costs
Prestbury Prestbury Investments LLP, the investment adviser to the company
Loan To Value or The outstanding amount of a loan expressed as a percentage of property value
LTV
NAV Net asset value
Net LTV LTV calculated on the gross loan amount and any other secured liabilities, less cash balances
Running yield The anticipated Net Initial Yield at a future date, taking account of any rent reviews in the intervening
period, Existing Portfolio at 31 December 2017 independent valuation and acquisition at cost
TAR Total Accounting Return: the movement in EPRA NAV over a period plus distributions paid in the period,
expressed as a percentage of EPRA NAV at the start of the period
TSR Total Shareholder Return: the movement in share price over a period plus distributions paid in the period,
expressed as a percentage of the share price at the start of the period
WAULT Weighted average unexpired lease term
39Appendix 2: Existing Portfolio Details
Warwick CastleThe Healthcare Portfolio
Ramsay
United Kingdom
5 20 Leeds
19 private hospitals valued at £896.2m at 31 December 2017 13 3
9 Manchester
representing 51% of current portfolio value generating £46.9m Liverpool
Sheffield
of passing rent
Well located throughout England – 51% by value in South East
15
Let on individual fully repairing and insuring leases with a term to Birmingham
4
expiry of 19.4 years at December 2017 without break clauses 17 19
Cambridge
Rent increases by at least 2.75% p.a. throughout the lease term 10
in May each year 18 11 14 16
7
Guaranteed by Ramsay Health Care Limited Bristol 12 London
1 8
London Psychiatric Hospital
6
Let to a UK subsidiary of Groupe Sinoué on a fully repairing 2
and insuring lease for 26.6 years
Ramsay Health Care Portfolio London Psychiatric Hospital
Central London’s only private psychiatric hospital – located in
Lisson Grove, near Marylebone station 1 Ashtead Hospital 9 Oaklands Hospital 17 West Midlands Hospital
Rent increase of 3.0% in May each year 2 Duchy Hospital 10 Oaks Hospital 18 Winfield Hospital
Guaranteed by Orpea SA 3 Euxton Hall Hospital 11 Pinehill Hospital 19 Woodland Hospital
Valued at £48.2m at 31 December 2017, representing 3% of 4 Fitzwilliam Hospital 12 Reading Hospital 20 Yorkshire Clinic
total portfolio value generating £2.0m of passing rent 5 Fulwood Hospital 13 Renacres Hospital
6 Mount Stuart Hospital 14 Rivers Hospital
Healthcare Portfolio Net Initial Yield of 4.8% as at 7 Nightingale Hospital 15 Rowley Hospital
31 December 2017 8 North Downs Clinic 16 Springfield Hospital
41The Merlin Leisure Portfolio
Leeds
Overview United
Kingdom Liverpool Manchester
1
Valued at £595.2m at 31 December 2017 valuation Sheffield
representing 34% of current portfolio generating £32.7m of 1
2
passing rent .
Birmingham
• UK (82% by value): 3 Cambridge
− Alton Towers Park and Hotel, Thorpe Park, Warwick
Castle London
Bristol 2
− Alton Towers and Thorpe Park are 2 of top 3 theme
3
parks in the UK
Alton Towers Theme Park
• Germany (18% by value): 1
and Alton Towers Hotel
− Heide Park attractions and hotel 2 Thorpe Park
• Visitor attractions account for 82% of passing rent and 3 Warwick Castle
hotels 18%
Germany
Hamburg
Individual fully repairing and insuring leases with:
4
• Average unexpired lease term of 24.5 years Hanover
Berlin
• Upwards only uncapped RPI-linked rent reviews every
Düsseldorf
June for the UK portfolio
• Fixed annual increases of 3.34% every July for the German Frankfurt
properties
Nuremberg
Guaranteed by Merlin Entertainments Plc Heide Park Theme Park
4
and Heide Park hotel
Leisure Portfolio Net Initial Yield of 5.1% as at 31 Munich
December 2017
1 Includes £107.8m of German assets valued in Euros and translated at €1 : £0.8873
2 Includes £6.3m of rent from German assets denominated in Euros and translated at €1 : £0.8873
3 The Global Attractions Attendance Report 2016
42The Existing Hotels Portfolio
Overview Location (by value)
Valued at £230.6m at 31 December 2017 valuation representing 13% of current
portfolio generating £14.1m of passing rent
▪ 55 Hotels with 3,096 rooms Scotland
19%
South East
− Key assets in Manchester, Oxford & Edinburgh: average lot size 29%
£21.7m
North West
17%
− Remaining 52 properties: average lot size £3.2m East
2%
25.4 year weighted average unexpired lease term
South West East Mids
▪ no unexpired lease shorter than 20 years North 15% 9%
5% West Mids
▪ no break clauses 4%
Five yearly upwards only RPI rent reviews Property type (by value)
Purchased in October 2016 for £192.6m contract price off £13.7m income at
completion; yield of 7.0%
Each hotel let to Travelodge Hotels Ltd – one of the UK’s leading hotel brands
Roadside
with c. 19m customers p.a.. Trading in the UK, Ireland and Spain with 558 hotels City centre
27% 34%
and over 42,000 rooms as at 31 December 2017
City
roadside
Edge of
22%
town
Hotel Portfolio Net Initial Yield of 5.8% as at 31 December 2017 17%
43Appendix 3: 31 December 2017 Financial Information
Florence Nightingale HospitalDecember 2017 Property Valuation Uplift
Healthcare Merlin Leisure Travelodge Hotels Total
31 Dec Change 31 Dec Change 31 Dec Change 31 Dec 31 Dec
2017 over year 2017 over year 2017 over year 2017 2016 Change
£m £m £m £m £m
Rent at 31 Dec 48.9 +2.8% 32.7 +4.1% 14.1 +3.2% 95.7 92.6 +3.3%
Values:
England 944.5 +5.8% 487.4 +7.3% 186.8 +16.6% 1,618.7 1,507.3 +7.4%
Scotland - - - - 43.7 +15.4% 43.7 37.9 +15.4%
Germany at
constant FX - - 104.3 +8.1% - - 104.3 96.5 +8.1%
Euro rate movement - - 3.5 - - - 3.5 - -
Fair value at
944.5 +5.8% 595.2 +8.1% 230.5 +16.3% 1,770.2 1,641.7 +7.8%
31 Dec
2017 2016 2017 2016 2017 2016 2017 2016
Net Initial Yield 4.9% 5.0% 5.1% 5.3% 5.8% 6.5% 5.1% 5.3%
Running Yield at
July 20181 5.0% 5.3% 5.% 5.2%
WAULT 19.6 20.6 24.5 25.5 25.4 26.3 22.2 23.1
1 Using valuer’s assessments of RPI of 2.5% at next uplift and taking no account of any open market uplift on Ramsay Hospitals
45Financing as at 31 December 2017
▪ £967.3m of secured credit in four ring-fenced facilities
▪ All facilities are non recourse with substantial headroom on financial covenants
▪ All facilities have cash cure rights and SIR has £60m uncommitted cash as at 31 December 2017 that could, if
necessary, be deployed for covenant cure
Healthcare Healthcare Leisure Travelodge
Principal at 31 December 17 £217.8m £309.1m £380.4m1 £60.0m
Assets in security pool 9 11 6 55
Fixed rate 4.29% 5.30% 5.68% 2.71%
None yrs 1 – 5
Annual cash amortisation £1.0m £3.2m £3.8m Oct 2020-2022 None
Final repayment Sept 2025 Oct 2025 Oct 2022 Oct 2023
LTV cash trap headroom n/a 27% 20% / 25%3 35% / 42%3
LTV default headroom 35% (Sept 19)2 31% n/a 48%
DSCR4 cash trap headroom 30% 18% n/a 65%
DSCR default headroom 41% 30% n/a 71%
1 Includes £64m of Euro denominated loans at 31 December 2017 (EUR/GBP exchange rate of €1:£0.8873)
2 Not tested until Sept 2019
3 First stage partial cash sweep to lender, second stage full cash sweep to lender
4 Debt Service Cover Ratio
46Unaudited Supplementary Information
EPRA Earnings Per Share and Adjusted
EPRA Earnings Per Share
Earnings Per Share
2017 2016 2017 2016
£000 £000 Pence per share Pence per share
EPRA EPS 10.9 11.5
EPRA Earnings Per Share
Basic earnings attributable to Diluted EPRA EPS 10.7 11.3
shareholders 137,240 92,329
Adjusted EPRA EPS 13.6 11.3
EPRA adjustments:
Diluted adjusted EPRA EPS 13.3 11.1
Investment property revaluation (113,428) (72,181)
Other income (171)
German deferred tax on investment EPRA NAV Per Share
property revaluation 1,437 1,766
EPRA earnings 25,078 21,914 2017 2017 2016 2016
Pence per Pence per
Other adjustments: £000 £000
share share
Rent smoothing (11,443) (12,783)
Basic NAV 860,577 373.3 737,423 324.5
Incentive fee 17,575 10,457
Dilution from shares issued for
Costs of share placing 2,007 incentive fee (7.3) (4.6)
Diluted NAV 860,577 366.0 737,423 318.9
Adjusted EPRA earnings 31,210 21,595
Deferred tax on investment
property revaluations 10,238 4.4 8,496 3.7
EPRA Triple Net Asset Value Per Share EPRA NAV 870,815 370.4 745,919 323.6
2017 2017 2016 2016
Pence per Pence per
£000 share £000 share
EPRA NAV 870,815 370.4 745,919 323.6
Adjustment to reflect fair value of
fixed rate debt (38,024) (16.2) (43,211) (18.8)
Deferred tax on German investment
property revaluations (10,238) (4.4) (8,496) (3.7)
EPRA Triple NAV 822,553 349.8 694,212 301.1
47Unaudited Supplementary Information
EPRA Cost Ratio
2017 2016
£000 £000
Revenue 106,930 93,214
Tenant contributions to property outgoings (1,112) (60)
EPRA gross rental income 105,818 93,154
Non-recoverable property expenses 27 32
Administrative expenses 28,984 20,975
Corporate costs 502 615
Direct vacancy costs
EPRA costs 29,513 21,622
EPRA Cost Ratio 27.9% 23.2%
EPRA Cost Ratio excluding non-cash items
2017 2016
£000 £000
EPRA gross rental income 105,818 93,154
Rent smoothing adjustments (11,443) (12,783)
EPRA gross rental income excluding non-cash items 94,375 80,371
EPRA costs 29,513 21,622
Incentive fee settled in shares (16,015) (9,359)
EPRA costs excluding non-cash items 13,498 12,263
EPRA Cost Ratio excluding non-cash items 14.3% 15.3%
EPRA Net Initial Yield
2017 2016
£000 £000
Annualised rental income based on cash passing 95,682 92,568
Non-recoverable property operating expenses (27) (32)
Annualised net rents 95,655 92,536
Property at external valuation 1,770,164 1,641,701
Allowance for purchaser's costs 119,479 110,818
Grossed up investment property portfolio valuation 1,889,643 1,752,519
EPRA Net Initial Yield and Topped Up Net Initial Yield 5.1% 5.3%
48Appendix 4: Additional Data
Additional Enlarged Portfolio Data: Key Statistics

                    Review Type by Rent                                                              Value by Region

                                                                                        South East                                      27.2 %

                                                                                        West Mids                              19.2 %
                                             RPI-linked reviews:
                 Open market                 Hotels                 23%             Greater London                    13.6 %
                 reviews 1%
                                             UK Theme Parks         22%                                          The Arena
                                             Arena                   4%                 North West                12.3 %
                                             Pubs                    2%
                                                                                       South West             8.2 %
                                             Fixed reviews:
 Fixed uplifts                  RPI-linked                                                   North      5.0 %
     48%                                     Hospitals              40%
                               reviews 51%   German Theme Parks      5%
                                                                                         Germany       4.8 %
                                             The Brewery             3%
                                                                                         East Mids    3.5 %
                                             Open market reviews:
                                             Arena                  1%                        East    3.4 %

                                                                                          Scotland   2.5 %

                                                                    Manchester Victoria Station                  Car Park

                                                                     Office space                                Martin House – Part Basement

                                                                                                                                                 50
SMG
• SMG is the leading global manager of venues with 40+ years of experience and 25 years of
uninterrupted EBITDA growth averaging 8% p.a.
• 239 venues globally, 15 in Europe providing 20% of gross profit. 83 stadiums & arenas with
1.4m seats, 70 convention centres with 20m sq. ft of space, 66 theatres plus 176 F&B venues.
• 33,000 events p.a. include the world famous Super Bowl, NBA, Rolling Stones, U2, Beyonce
concerts
• 16m tickets sales annually, US$79m adj. EBITDA, 98% renewal rate, av. client tenure 12
years, 74% RFP win rate for new clients
• Onex acquired SMG for US$1 billion in December 2017 with US$425m of cash and rollover
equity. Founded in 1984, Onex is one of the oldest and most established VCs and manages
US$30bn including US$8bn of their own capital. It focuses on partnerships with management Source: Statistica
and long term investment horizons and has a strong track record and history of capital
preservation.
51Recent Long Lease Market Evidence
SECTOR PROPERTY TRANSACTION REVIEW BASIS WAULT PRICE NIY
DATE
Annual uplifts indexed to RPI for 25 years 1% -
Leisure Odeon, Derby Nov-17 20 £12,600,000 4.89%
5% pa
Leisure David Lloyd, Monks Lane, Newbury Aug-17 5 yearly reviews to RPI 0% - 4% pa 30 £17,585,000 4.49%
5 yearly rent reviews linked to RPI 1%-3%
Leisure Virgin Active, Wandsworth Mar-17 20 £12,950,000 5.00%
compounded annually
14 public houses let to Stonegate Annual CPI reviews 1% - 4% until 2024. Five
Pubs Jun-17 22.5 £23,000,000 5.50%
Pub Company yearly index linked reviews thereafter
Pubs 5 pubs let to Spirit or Punch May-17 Fixed increases of 1.25% - 2.5% pa 28 £9,475,000 4.80%
Annual RPI with a floor of 1% and a collar of 4%
Jan-16 3.8% -
Pubs Marstons (various transactions) with a tenant buy back option for £1 at the end of 40 £21m - £45m
to Apr-17 4.1%
the lease
Medical Offices Bond House, High Road, Chiswick Dec-17 Annual RPI linked reviews to 2-4% 13.8 £29,000,000 4.00%
Retail Tesco, Bristol Aug-17 Annual RPI linked reviews 13.5 £28,500,000 4.90%
Retail Sainsbury’s, Bybrook, Ashford Aug-17 Annual RPI linked reviews 21 £80,000,000 4.50%
Yearly RPI linked increases. Completion not due
Retail Morrisons, Loughborough Jun-17 24.5 £32,500,000 4.32%
until March 2018
Abcam Building, Cambridge 5 yearly RPI linked reviews with a cap and collar
Offices Mar-17 20 £61,325,000 4.85%
Biomedical Campus of 2% -4%
Student Hughended Student Village, High Annual RPI linked reviews and a cap and collar
Feb-17 30 £38,750,000 4.35%
Accommodation Wycombe of 0% -8%
Holiday Park Park Holidays Portfolio Nov-17 Annual indexed reviews to RPI 1% - 4% 100 £144,700,000 3.01%
Holiday Park Park Dean Portfolio May-17 Annual rent reviews in line with RPI 0% - 5% 170 £150,000,000 3.22%
These tables include a sample of illustrative transactions that the Company is aware of. It does not purport to show all
transactions involving the sectors listed.
52Recent Long Lease Market Evidence
SECTOR PROPERTY TRANSACTION REVIEW BASIS WAULT PRICE NIY
DATE
Budget Hotels Travelodge, London Tower Bridge Nov-17 5 yearly uncapped RPI 31 £47,000,000 3.58%
Budget Hotels Travelodge, Chertsey Nov-17 5 yearly uncapped RPI 22 £7,200,000 4.75%
Travelodge, 12-14 West St Sub
Budget Hotels Oct-17 5 yearly uncapped RPI 31 TBC
Brighton 4%
Budget Hotels Travelodge, Tewkesbury Sep-17 TBC 27 £4,665,000 5.50%
Budget Hotels Travelodge, Princes St, Swindon Sep-17 5 yearly uncapped RPI 23 £6,300,000 5.50%
Budget Hotels Premier Inn, Camberley Sep-17 5 yearly uncapped RPI; capped at 5% 15 £8,500,000 5.00%
Travelodge, Liverpool – John
Budget Hotels Aug-17 5 yearly uncapped RPI; collar and cap of 1%-4% 25 £7,590,000 5.25%
Lennon Airport
Premier Inn, Birmingham Waterloo
Budget Hotels Aug-17 5 yearly CPI 20 £26,600,000 4.12%
St
Travelodge, Lytham St Annes,
Budget Hotels Aug-17 5 yearly RPI 20 £6,700,000 5.67%
Blackpool
Budget Hotels Travelodge, Chester Le-Street Aug-17 5 yearly RPI 21 £940,000 5.81%
Excess of
Budget Hotels Travelodge, London Southwark Jul-17 5 yearly, higher of RPI or Market Rent 31 3.35%
£50m
These tables include a sample of illustrative transactions that the Company is aware of. It does not purport to show all
transactions involving the sectors listed.
53Appendix 5: Governance
Travelodge Glasgow CentralHighly Experienced Board: Independent Directors
Governance Structure Strongly Aligned with Shareholder Interests
Board structure
• Chairman highly experienced in long lease sector and independent of managers
• 4 independent non-executive directors (including Chairman)
• 3 management representatives on Board (Nick Leslau, Mike Brown and Sandy Gumm) must be in minority for all decisions
Experienced Independent Directors
Ian Marcus Jonathan Lane Leslie Ferrar, CVO
Martin Moore
Remuneration Committee Chair and Nominations Committee Chair Audit Committee Chair
Chairman
Senior Independent Director
Senior advisor to KKR and Senior Non-Executive Director of The Crown Senior Advisor to Morgan Stanley & Non-Executive Chairman of The
independent Non-Executive Director Estate and Town Centre Securities Chairman of EMEA Real Estate Risk Advisory Group
at SEGRO Plc and F&C Commercial Senior Adviser to Eastdil Secured, Wells Investment Banking (“REIB”) Non-Executive member of HMRC
Property Trust Fargo Securities, Elysian Residences Chairman of the board of Grosvenor Risk & Audit Committee
Chairman of M&G Real Estate until Limited and Work.Life Europe and member of the advisory
Audit Committee member for the
2013 and CEO from 1996 to 2012 board of Resolution Real Estate
Member of Redevco NV’s Advisory Board Sovereign Grant
Advisors LLP
Commissioner of English Heritage and Trustee of The Prince’s Foundation Treasurer to TRH the Prince of
and a Trustee of the Guildhall Chairman of the European Advisory Board of Policy Committee member of the Wales and the Duchess of
School Trust the Wharton Business School Real Estate British Property Federation, Cornwall 2005 to 2012
Faculty member of the BoE Commercial
Past President and board member of Property Forum Former head of international
British Property Federation Former Chairman of the BoE’s Commercial expatriate tax at KPMG
Property Forum. MD and Chairman of the Former member of the Government’s
Chartered Surveyor Property Unit Advisory Panel and Chartered Accountant
European RE Investment Banking division of
Past Chairman of the Investment Credit Suisse former Director of Songbird Estates Trustee of the Diocese of
Property Forum and Commissioner Advisory board member for the Westminster
of The Crown Estate Past President of the British Property
University of Oxford Programme for
Forum and past Chairman of the Investment
the Future of Cities
Property Forum
55A Proven Management Team with 130+ Years Combined Experience
Strong Manager Alignment
Management team members have a strong track record of long-term investment in the companies they have managed (Burford,
Prestbury, Helical Bar, Max Property Group Plc)
Nick Leslau Mike Brown Sandy Gumm Tim Evans Ben Walford
Prestbury’s Chairman Prestbury’s CEO Prestbury’s COO Prestbury’s Property Director Prestbury’s Senior Surveyor
Over 35 years’ real Over 34 years’ real Over 27 years’ Over 27 years’ real Over 15 years’
estate experience estate experience in experience in finance estate experience experience in property
(Secure Income REIT Plc, funds and listed with extensive Plc board (Secure Income REIT investment,
Max Property Group Plc, companies (Secure experience (Secure Plc, Prestbury, Jones refurbishment and
Prestbury Group Plc, Income REIT Plc, Max Income REIT Plc, Lang LaSalle, Hill design
Burford Holdings Plc) Property Group Plc, Prestbury Group Plc, Samuel Asset Over 15 years with
Extensive Plc board Helical Bar plc, Burford Holdings Plc) Management, MEPC) Prestbury
experience both as Threadneedle) 9 years with KPMG in Over 15 years with BSc (Hons) Est Man,
executive and non- Over 8 years with Sydney and London Prestbury MRICS
executive Prestbury Over 20 years with MA Hons (Cantab),
Over 20 years with BSc (Hons) Land Man, Prestbury MRICS
Prestbury MRICS BEc, CA (ANZ)
BSc (Hons) Est Man,
FRICS
Overseeing an experienced team of finance, property and administrative staff
56Management Team Strongly Aligned with Shareholders
Management Team has among the largest shareholdings in the quoted UK Real Estate sector: c.£137m
at the placing price
Prestbury exclusively offers all qualifying long lease deals to the Company
Contract term to June 2022 – no renewal rights or termination payment at end of term
Incentive to achieve above target returns via incentive share awards of 20% of above target growth after
investor priority returns:
• Target is higher of 10% above year end EPRA NAV and EPRA NAV at time of last incentive share award
(“high watermark”)
• Paid in shares subject to lock-in of 18 – 42 months
• The 2017 results set a new benchmark of 10% total accounting return in 2018 from the 370.4p per share
delivered at 31 December 2017; that is, returns of 37p per share accruing to shareholders during the year
before any incentive fee is earned
• Independent Director review of incentive arrangements completed in March 2017; no changes required;
appropriateness of incentive fee structure to be reviewed again in 2019, three years ahead of expiry of the
management agreement
Management meets overhead costs and receives advisory fee on sliding scale relative to EPRA NAV:
paid in cash quarterly 1.25% p.a. up to £500m, plus 1.0% p.a. between £500m to £1.0bn, plus 0.75% p.a.
thereafter
57A Proven Track Record of Delivering Shareholder Returns
Prestbury Team Track Record
The Prestbury Team has a strong track record including, between them, the management of three listed real estate investment vehicles,
Burford Holdings Plc, Prestbury Group Plc and Max Property Group Plc
A Max Property Group Plc – Average Total Return of 17.1% p.a. (May-2009 – Sep-2014) vs. Peer Group1
17.1%
Average NAV Total
15.6%
return per Share
9.2% 8.2%
6.6% 6.1% 5.1%
Max London Metric London & Stamford LXB Metric Retail NewRiver Retail Conygar
(Jan-13 - Sep-14) (May-09 to Sep-12) (Mar-10 to Sep-12)
Prestbury Group Plc: Average Total Returns of 25% p.a. Burford Holdings Plc – Total Returns of 34% p.a.
B C
(1997 – 2003) (1987 – 1997)
100 De-listing and 1,500 14.6x
disposal of majority
1,250
Indices Rebased to
Rebased to 100
Prestbury NAV Per
of portfolio 25% p.a. returns
75 1,000 34% p.a returns
Share
750
50
500
8.2% p.a returns
25 250 2.0x
0
0 Dec-1986 Dec-1988 Dec-1990 Dec-1992 Dec-1994 Dec-1996
Dec-1997 Dec-1998 Dec-1999 Dec-2000 Dec-2001 Dec-2002 Dec-2003 Burford NAV Progression Peers NAV Progression
NAV per share Distributions Previous Distributions FTSE 350 Real Estate Index
1 Sources: Data compiled from company announcements and annual reports over the following periods: Max Property Group Plc (May 2009 to September 2014); London & Stamford Property Plc (May 2009 to
September 2012); Metric Property Investments Plc (March 2010 to September 2012); LXB Retail Properties Plc (October 2009 to September 2014); LondonMetric Property Plc (January 2013 to September
2014); New River Retail Ltd (September 2009 to September 2014); and Conygar Investment Company Plc (May 2009 – September 2014). LondonMetric Property Plc was not listed as a cash shell but created
through the merger of London & Stamford Property Plc and Metric Property Investments Plc which were listed in 2007 and 2010 respectively.
58Disclaimer
The information contained in these slides and communicated verbally to you, including the speech(es) of the presenter(s) and any materials distributed at or in
connection therewith (together, the “Presentation”) is confidential. Reliance upon the Presentation for the purpose of engaging in any investment activity may
expose an individual to a significant risk of losing all of the property or other assets invested. If any person is in any doubt as to the contents of the Presentation,
they should seek independent advice from a person who is authorised for the purposes of the Financial Services and Markets Act 2000, as amended (the
“FSMA”) or otherwise suitably authorised if in another jurisdiction and who specialises in advising on investments of this kind. Any investment decision should not
be made based on the content of the Presentation but be made solely on the basis of the final announcement to be published by Secure Income REIT Plc (the
“Company”). The contents of the Presentation shall not be taken as any form of commitment on the part of any person to proceed with any transaction.
The Presentation has been prepared by, and is the sole responsibility of, the Company. No undertaking, representation, warranty or other assurance, expressed or
implied, is made or given by or on behalf of Stifel Nicolaus Europe Limited (“Stifel”), the Company or Prestbury Investments LLP (the “Investment Adviser”) or
any of their respective shareholders, directors, employees, advisers, agents or affiliates or any other person as to the fairness, accuracy or the completeness of
the information or opinions contained herein, and to the extent permitted by law, no responsibility or liability is accepted by any of them for any such information or
opinions. Notwithstanding the aforesaid, nothing in this paragraph shall limit or exclude liability for any representation or warranty made fraudulently.
The Presentation has not been approved by the Financial Conduct Authority (the “FCA”) and does not constitute, or form part of, an admission document, listing
particulars, a prospectus or a circular relating to the Company, nor does it constitute, or form part of, any offer or invitation to sell or issue, or any solicitation of any
offer to purchase or subscribe for any ordinary shares in the Company (the “Ordinary Shares”). Further, neither the Presentation nor any part of it, or the fact of its
distribution, shall form the basis of, or be relied upon in connection with, or act as any inducement to enter into, any contract for Ordinary Shares. Any investment
in Ordinary Shares should only be made on the basis of definitive documentation in final form.
The Presentation may not be copied, reproduced or further distributed, in whole or in part, to any other person, or published, in whole or in part, for any purpose
without the prior written consent of the Company.
This Presentation is being distributed by the Company in the United Kingdom in accordance with Article 69 of the Financial Services and Markets Act 2000
(Financial Promotion) Order 2005 (the “Financial Promotion Order”) made pursuant to section 21(5) of the FSMA. In addition, this Presentation is being
distributed in the United Kingdom only to, and is directed only at, those persons falling within the following articles of the Financial Promotion Order: Investment
Professionals (as defined in Article 19(5)); and High Net Worth Companies (as defined in Article 49(2)). Persons who do not fall within either of these definitions
should not rely on the Presentation nor take any action based upon it but should instead return it immediately to the Company. The Presentation is exempt from
the general restriction in section 21 of the FSMA relating to the communication of invitations or inducements to engage in investment activity on the grounds that it
is made only to certain categories of persons.
The distribution of the Presentation in jurisdictions other than the United Kingdom may be restricted by law and persons into whose possession the Presentation
comes should inform themselves about and observe any such restrictions. In particular, neither the Presentation nor any copy of it should be distributed, directly or
indirectly, by any means (including electronic transmission) to any persons in Australia, Canada, Japan or the Republic of South Africa. This Presentation should
not be distributed in or into the United States of America (or any of its territories or possessions) (together, the “US”) other than to “qualified institutional buyers”
(“QIBs”) as such term is defined in Rule 144A under the United States Securities Act of 1933, as amended (the “Securities Act”).
The Ordinary Shares have not been, and will not be, registered under the Securities Act or under the securities laws of any other jurisdiction, and are not being
offered or sold (i) directly or indirectly, within or into the US, Australia, Canada, Japan or the Republic of South Africa or (ii) to, or for the account or benefit of, any
US persons or any national, citizen or resident of the US, Australia, Canada, Japan or the Republic of South Africa, unless such offer or sale would qualify for an
exemption from registration under the Securities Act and/or any other applicable securities laws.
59Disclaimer
Solely for the purposes of the product governance requirements contained within: (a) EU Directive 2014/65/EU on markets in financial instruments, as amended
(“MiFID II”); (b) Articles 9 and 10 of Commission Delegated Directive (EU) 2017/593 supplementing MiFID II; and (c) local implementing measures (together, the
“MiFID II Product Governance Requirements”), and disclaiming all and any liability, whether arising in tort, contract or otherwise, which any “manufacturer” (for the
purposes of the MiFID II Product Governance Requirements) may otherwise have with respect thereto, the Ordinary Shares have been subject to a product approval
process, which has determined that the Ordinary Shares to be issued pursuant to the Placing are: (i) compatible with an end target market of retail investors and
investors who meet the criteria of professional clients and eligible counterparties, each as defined in MiFID II; and (ii) eligible for distribution through all distribution
channels as are permitted by MiFID II (the “Target Market Assessment”).
Notwithstanding the Target Market Assessment, distributors should note that: the price of the Ordinary Shares may decline and investors could lose all or part of their
investment; the Ordinary Shares offer no guaranteed income and no capital protection; and an investment in the Ordinary Shares is compatible only with investors
who do not need a guaranteed income or capital protection, who (either alone or in conjunction with an appropriate financial or other adviser) are capable of
evaluating the merits and risks of such an investment and who have sufficient resources to be able to bear any losses that may result therefrom. The Target Market
Assessment is without prejudice to the requirements of any contractual, legal or regulatory selling restrictions in relation to the Placing. Furthermore, it is noted that,
notwithstanding the Target Market Assessment, Stifel will only procure investors who meet the criteria of professional clients and eligible counterparties.
For the avoidance of doubt, the Target Market Assessment does not constitute: (a) an assessment of suitability or appropriateness for the purposes of MiFID II; or (b)
a recommendation to any investor or group of investors to invest in, or purchase, or take any other action whatsoever with respect to the Ordinary Shares.
Each distributor is responsible for undertaking its own target market assessment in respect of the Ordinary Shares and determining appropriate distribution channels.
The Company is under no obligation to update or keep current the information contained in this Presentation or to correct any inaccuracies which may become
apparent, and any opinions expressed in it are subject to change without notice. Neither the Company nor any of its directors, officers, employees or advisers accept
any liability whatsoever for any loss howsoever arising from any use of this Presentation or its contents or otherwise arising in connection therewith.
The Presentation contains forward-looking statements. These statements relate to the future prospects, developments and business strategies of the Company.
Forward-looking statements are identified by the use of such terms as "believe", "could", "envisage", "estimate", "potential", "intend", "may", "plan", "will" or variations
or similar expressions, or the negative thereof. The forward-looking statements contained in the Presentation are based on current expectations and are subject to
risks and uncertainties that could cause actual results to differ materially from those expressed or implied by those statements. If one or more of these risks or
uncertainties materialise, or if any underlying assumptions prove incorrect, the Company's actual results may vary materially from those expected, estimated or
projected. Given these risks and uncertainties, certain of which are beyond the Company's control, potential investors should not place any reliance on forward-
looking statements. These forward-looking statements speak only as at the date of the Presentation. Except as required by law, the Company undertakes no
obligation to publicly release any update or revisions to the forward-looking statements contained in the Presentation to reflect any change in events, conditions or
circumstances on which any such statements are based after the time they are made.
Stifel, which is authorised and regulated in the United Kingdom by the FCA, is acting as bookrunner and nominated adviser connection with the matters referred to
herein, and will not be responsible to anyone other than the Company for providing the protections afforded to its clients, nor for providing advice in relation to the
contents of the Presentation or any transaction or arrangement referred to herein.
Apart from the responsibilities and liabilities, if any, which may be imposed on Stifel by the FSMA or the regulatory regime established thereunder, Stifel accepts no
responsibility whatsoever, and makes no representation or warranty, express or implied, in relation to the contents of the Presentation, including its accuracy,
completeness or verification or for any other statement made or purported to be made by it, or on behalf of it, the Company, the directors, the Investment Adviser or
any other person in connection with the Company, the Ordinary Shares or the matters referred to herein, and nothing in the Presentation is or shall be relied upon as
a promise or representation in this respect, whether as to the past or future. Stifel accordingly disclaims all and any liability whether arising in tort, contract or
otherwise (save as referred to above), which it might otherwise have in respect of the Presentation or any such statement.
60You can also read