"Honey, I Shrunk the ESG Alpha": Risk-Adjusting ESG Portfolio Returns - April 2021 - IHS Markit
←
→
Page content transcription
If your browser does not render page correctly, please read the page content below

A Scientific Beta Publication

  “Honey, I Shrunk the ESG
Alpha”: Risk-Adjusting ESG
          Portfolio Returns
                               April 2021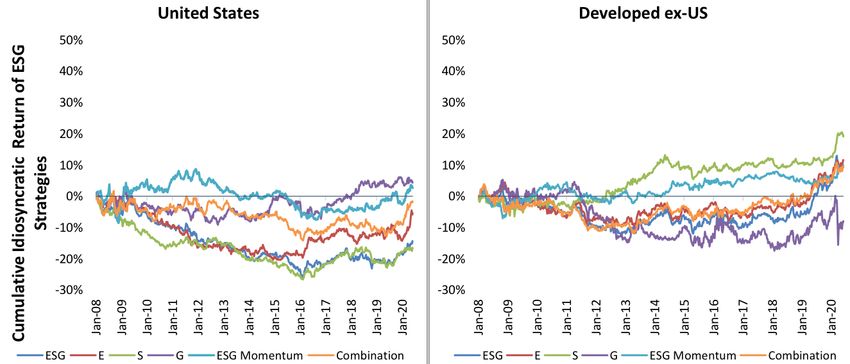
A Scientific Beta Publication — “Honey, I Shrunk the ESG Alpha”: Risk-Adjusting ESG Portfolio Returns — April 2021
2   Copyright © 2021 Scientific Beta. All rights reserved. Please refer to the disclaimer at the end of this document.

    Table of Contents

    Introduction................................................................................................................................................................................5

    1. Constructing ESG Strategies .................................................................................................................................. 9

    2. Factor Exposures and Sector Biases ...................................................................................................................11

    3. Downside Risk..........................................................................................................................................................22

    4. Attention Shifts........................................................................................................................................................27

    5. Conclusions .............................................................................................................................................................31

    References....................................................................................................................................................................34

    About Scientific Beta.................................................................................................................................................37

    Scientific Beta Publications.....................................................................................................................................39

    We thank Noël Amenc and Frédéric Ducoulombier for helpful comments. We thank Edoardo De Nigris for his contribution to the empirical
    analysis.

    Printed in France, April 2021. Copyright © 2021 Scientific Beta. All rights reserved. Please refer to the disclaimer at the end of this document.
    The authors can be contacted at contact@scientificbeta.com.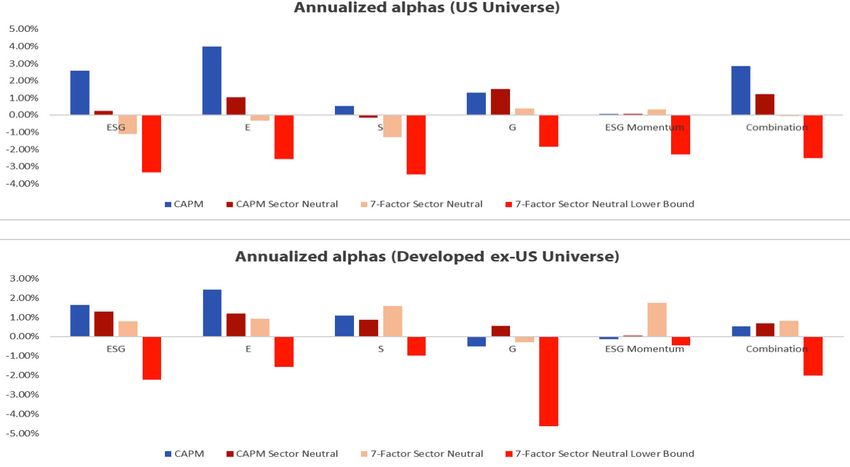
A Scientific Beta Publication — “Honey, I Shrunk the ESG Alpha”: Risk-Adjusting ESG Portfolio Returns — April 2021       3
                                               Copyright © 2021 Scientific Beta. All rights reserved. Please refer to the disclaimer at the end of this document.

Summary

In this paper, we show that there is no solid evidence supporting recent claims that ESG strategies
generate outperformance. We construct ESG strategies that have been shown to outperform in
popular papers. We assess performance benefits to investors when accounting for sector and factor
exposures, downside risk, and attention shifts.

Simple returns of ESG strategies look attractive, with annualised returns of up to almost 3% per year.
But when accounting for exposure to standard factors, none of the twelve different strategies we
construct to tilt to ESG leaders adds significant outperformance, whether in the US or in developed
markets outside the US. 75% of outperformance is due to quality factors that are mechanically
constructed from balance sheet information.

ESG strategies do not offer significant downside risk protection either. Accounting for exposure of
the strategies to a downside risk factor does not alter the conclusion that there is no value-added
beyond implicit exposure to standard factors such as quality.

Recent strong performance of ESG strategies can be linked to an increase in investor attention. Flows
into sustainable mutual funds show that attention to ESG has risen remarkably over the later period
of our sample, from about 2013. We find that alpha estimated during low attention periods is up to
four times lower than alpha during high attention periods. Therefore, studies that focus on the recent
period tend to overestimate ESG returns.

We conclude that claims of positive alpha in popular industry publications are not valid because
the analysis underlying these claims is flawed. Omitting necessary risk adjustments and selecting a
recent period with upward attention shifts enables the documenting of outperformance where in
reality there is none.

Our findings do not question that ESG strategies can offer substantial value to investors. Instead, they
suggest that investors who look for value-added through outperformance are looking in the wrong
place. It might be time to consider ESG strategies for the unique benefits that they can provide, such
as hedging climate or litigation risk, aligning investments with norms, and making a positive impact
for society. Investors would benefit from further research on these important questions.
A Scientific Beta Publication — “Honey, I Shrunk the ESG Alpha”: Risk-Adjusting ESG Portfolio Returns — April 2021
4   Copyright © 2021 Scientific Beta. All rights reserved. Please refer to the disclaimer at the end of this document.

    About the Authors

                                       Giovanni Bruno is a Senior Quantitative Analyst at Scientific Beta and a member
                                       of the EDHEC Scientific Beta research chair. His research focuses on asset pricing.
                                       He earned his PhD in finance at the Norwegian School of Economics, where he
                                       also worked as a Teaching Assistant delivering courses on Investments, Derivatives
                                       and Risk Management and Quantitative Investment. He holds a Master’s Degree
                                       from LUISS Guido Carli University (Italy), where he obtained First-Class Honours
                                       in Quantitative Finance. Previously to his PhD, he held roles as a Consultant and a
                                       Quantitative Analyst with PricewaterhouseCoopers and Altran, respectively, where
                                       he specialised in Financial Risk Management.

                                       Mikheil Esakia is a quantitative research analyst at Scientific Beta. He does research
                                       in empirical finance, with a focus on the relation of macro-economy and equity
                                       markets, portfolio construction, and liquidity of systematic equity strategies. He
                                       has co-authored various articles published in practitioner journals and magazines.
                                       Prior to joining Scientific Beta, he worked as an operational risk analyst at Liberty
                                       Bank, Georgia. He obtained master’s degree in Finance from EDHEC Business School
                                       after studying business administration at Free University of Tbilisi.

                                       Felix Goltz, PhD, is Research Director at Scientific Beta. He carries out research in
                                       empirical finance and asset allocation, with a focus on alternative investments and
                                       indexing strategies. His work has appeared in various international academic and
                                       practitioner journals and handbooks. He obtained a PhD in finance from the University
                                       of Nice Sophia-Antipolis after studying economics and business administration
                                       at the University of Bayreuth and EDHEC Business School.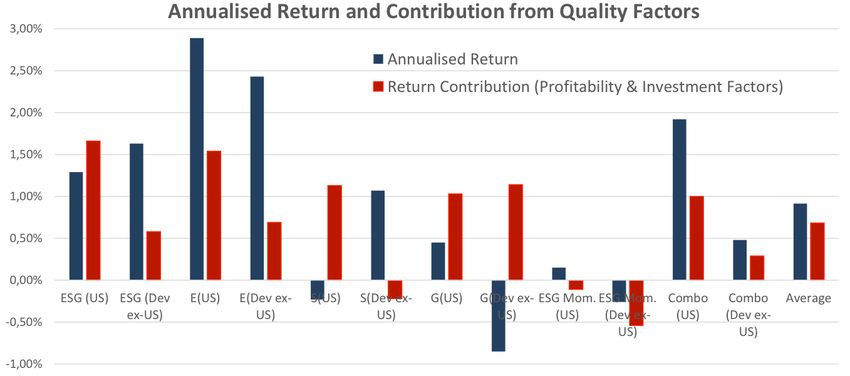
5

Introduction
A Scientific Beta Publication — “Honey, I Shrunk the ESG Alpha”: Risk-Adjusting ESG Portfolio Returns — April 2021
6   Copyright © 2021 Scientific Beta. All rights reserved. Please refer to the disclaimer at the end of this document.

    Introduction

    Investors are increasingly concerned with integrating environmental, social and governance (ESG)
    criteria when constructing their equity portfolios. There are four important motivations for doing so:
    i) aligning portfolios with investors’ values and norms;
    ii) making a social impact by pushing companies to act responsibly;
    iii) reducing exposure to risks faced by ESG laggards, such as climate or litigation risk; and
    iv) generating performance by favouring ESG leaders.

    Our objective is to assess whether there is support in the data for the fourth motivation. ESG is often
    perceived as a source of outperformance and ESG providers are fond of endorsing this perception.
    In particular, numerous studies have looked at ESG strategies and concluded that they do generate
    outperformance.

    Exhibit 1 provides an overview of popular papers that analyse different types of ESG strategies. A
    first set of papers analyses the performance of portfolios that sort stocks on their aggregate ESG
    scores or on sub-components, such as environmental scores. Giese, Nagy and Lee (2020) conclude
    that favouring ESG leaders generates positive alpha. Likewise, Giese, Lee, Melas, Nagy and Nishikawa
    (2019) conclude that there is a visible performance advantage of ESG leaders. A second type of ESG
    strategy is ESG Momentum, which favours stocks with increasing ESG scores. Such strategies generate
    positive alpha, according to Nagy, Kassam and Lee (2016) and Giese and Nagy (2018). A third type
    of strategy combines the previous two. For example, Verheyden, Eccles and Feiner (2016) consider a
    strategy that favours ESG leaders that also have high Momentum. They conclude that such a strategy
    delivers positive alpha.

    Exhibit 1: Overview of Papers that Conclude on Positive Alpha from ESG Strategies
      Type of ESG Strategy                                 Papers                                            Results                        Stock Universe
                                            Deconstructing ESG Ratings                     Long/short portfolios from sorting           MSCI AC World Index IMI
                                                    Performance                              on ESG, E, S, G (and other more                 (2013-2019).
                                            (Giese, Nagy and Lee, 2020)                   specific key issue scores) come with
                                                                                          positive active return and positive
      ESG Overall and                                                                                      alpha.
      Component Alpha
                                       Foundations of ESG Investing: How                    “the performance advantage of           Several MSCI universes including
                                        ESG Affects Equity Valuation, Risk,                  higher ESG-rated companies is                   Europe and US
                                       and Performance (Giese, Lee, Melas,                  visible across the entire universe”
                                           Nagy and Nishikawa, 2019)
                                        Can ESG add alpha? An analysis of                       ESG momentum strategies              MSCI World Index (2008-2015)
                                        ESG Tilt and Momentum Strategies                         generate positive alpha.
                                          (Nagy, Kassam and Lee 2016)
      ESG Momentum Alpha                   How Markets Price ESG: Have                       A long/short ESG momentum               MSCI World Index (2009-2018),
                                          Changes in ESG Scores Affected                    strategy shows a positive alpha.         MSCI Emerging market index
                                                  Stock Prices?                                                                             (2013-2018).
                                             (Giese and Nagy, 2018)
                                          ESG for All? The Impact of ESG                    Excluding stocks with lowest ESG         Large and Mid Cap Global and
                                          Screening on Return, Risk and                    scores leads to improved returns,            Developed (2010-2015).
      ESG Combined Alpha
                                                  Diversification                          lower volatility, and lower tail risk.
                                       (Verheyden, Eccles and Feiner, 2016)
A Scientific Beta Publication — “Honey, I Shrunk the ESG Alpha”: Risk-Adjusting ESG Portfolio Returns — April 2021 7
Copyright © 2021 Scientific Beta. All rights reserved. Please refer to the disclaimer at the end of this document.
Introduction
Asset managers readily adopt the idea of a positive ESG alpha. For example, Dutch asset manager
NN Investment Partners “are convinced that responsible investing enhances risk-adjusted returns
and believe that companies with sustainable business practices and high standards of corporate
governance will become the success stories of the future.”1 Global asset management firm State
Street affirms that their “Active Quantitative Equity group views ESG as a source of alpha that could
lead to positive portfolio performance over time. […] . This premise rests on the thesis that value
creation (or destruction) is influenced by more than financial capital alone, especially longer term.” 2
Investors need to ask whether the promise of generating outperformance from ESG leaders is credible.
Claims of outperformance may be based on simple returns from ESG strategies, or on returns after
adjusting for market exposure alone. However, such a simplistic view of performance is insufficient.
Even if ESG strategies have higher returns, investors do not gain if these returns are due to sector biases
or exposure to standard factors. The relevant question to ask for investors is whether non-financial
information in ESG scores offers additional performance benefits. Our empirical analysis addresses this
question. We construct ESG strategies used in popular industry papers and assess their value-added
to investors when accounting for sector and factor exposures, downside risk, and attention shifts.
In particular, we ask whether ESG strategies offer value-added over sector exposures and exposures
to standard factors and draw on standard performance evaluation methods to account for exposures
to equity styles such as value and quality. Using a tractable measure of downside risk, we also assess
whether ESG strategies offer downside protection and if they produce higher risk-adjusted returns when
accounting for their downside risk exposure. Finally, we account for the shift in investor preferences
towards ESG by considering fund flows, a well-established measure of investor attention. We ask
whether an upward shift may generate inflated ESG returns over the recent period when compared
with the long-term returns that investors can expect from ESG strategies.
Our findings show that ESG strategies do not generate positive alpha.
• First, claims of outperformance only hold when considering standalone returns and ignoring
estimation risk. By contrast, there is no outperformance of the ESG strategies when applying standard
risk adjustments. This finding shows that ESG ratings do not add value over information contained in
sector classifications and factor attributes. Despite relying on analysis of non-financial information
by hundreds of ESG analysts, ESG strategies perform like simple quality strategies mechanically
constructed from accounting ratios3. The lack of alpha means that investors would incur performance
losses if they wrongly assumed that ESG is a separate rewarded factor4.
• Second, ESG strategies do not offer downside risk protection. Therefore, accounting for downside
risk exposure does not change our conclusion that there is no positive alpha.
• Third, our findings suggest that rising attention to ESG has inflated returns over part of our sample
period. When investor attention to ESG does not rise, ESG performance is even weaker than over the
entire sample. Investors can easily overestimate long-term ESG returns when considering short time
periods with rising attention to ESG.
1 - NN IP (2020).
2 - State Street (2018).
3 - The provider of the ESG data used in our study reports, MSCI, reports employing 250 analysts as of 2019 to come up with the ESG ratings data. See
Beerens (2019).
4 - See Amenc, Esakia and Goltz (2021) for a detailed discussion. Also see the supplement material to this paper.A Scientific Beta Publication — “Honey, I Shrunk the ESG Alpha”: Risk-Adjusting ESG Portfolio Returns — April 2021
8 Copyright © 2021 Scientific Beta. All rights reserved. Please refer to the disclaimer at the end of this document.
Introduction
Our findings contradict common claims in the industry that ESG is a source of outperformance. They
do not question that ESG strategies can offer substantial value to investors. But investors who look for
value-added through outperformance are looking in the wrong place. It might be time to consider
ESG strategies for the unique benefits that they can provide, such as hedging climate or litigation
risk, aligning investments with norms, and making a positive impact for society.9 1. Constructing ESG Strategies
A Scientific Beta Publication — “Honey, I Shrunk the ESG Alpha”: Risk-Adjusting ESG Portfolio Returns — April 2021
10   Copyright © 2021 Scientific Beta. All rights reserved. Please refer to the disclaimer at the end of this document.

     1. Constructing ESG Strategies

     We use monthly ESG ratings data from MSCI (also known as IVA for ‘Intangible Value Assessment’)
     from January 2007 to June 2020. ESG ratings range from 0.0 to 10.0 with a high score indicating strong
     performance on ESG issues. We use the component scores for the environmental (E), social (S), and
     governance (G) components of the overall rating. To come up with these scores, the data provider
     assesses firms on a set of issues for each component, the set of issues and their weighting differs
     across industries. For example, as of January 2020, the main issue for the social rating of automobile
     manufacturers is product safety and the main issue for household appliances producers is supply
     chain labour standards. We use the scores, as published by MSCI, to design strategies that focus on
     one component. In addition, we use aggregate ESG scores. We construct the aggregate ESG score of
     a firm as the weighted average of the component scores5. We use the weight of each component,
     as provided by MSCI. These weights depend on the industry a stock belongs to. For example, as of
     January 2020, the weight assigned to the environmental component in the overall ESG score is 68%
     for Commodity Chemicals but only 9% for Banks.

     ESG scores are necessary to select stocks for the strategies we test. We apply these scores to stocks in
     a typical US equity index universe, made up of large and mid-cap stocks. We also test the strategies in
     a Developed Markets universe excluding the US. We obtain returns in USD for stocks in the Scientific
     Beta US index universe and the Scientific Beta Developed ex US universes6. Stocks with missing ESG
     data are excluded at each rebalancing date. There is no back-filling or forward-filling.

     We construct long/short strategies that capture performance differences between ESG leaders and ESG
     laggards as follows: at each monthly rebalancing date, we select 30% of the stocks with the highest
     ESG scores in the long leg, and 30% of stocks with the lowest score in the short leg. The rebalancing
     date is the third Friday of the calendar month. Stocks within the long and the short leg are equally
     weighted. We then evaluate strategy returns from 1 January 2008 to 39 June 30 2020.

     We construct three types of strategies, following the popular industry papers cited in the introduction.
     •Overall ESG score and component scores (E, S and G):
      - We select stocks based on their overall ESG score, or the score for one of the three components,
      following Giese, Nagy and Lee (2020). This leads to four different strategies.
     •ESG Momentum score:
      - We select stocks based on their ESG Momentum, defined as the change of their ESG score over
      12-months, see Giese and Nagy (2018). We exclude stocks with missing and zero ESG Momentum
      scores7.
     •Combined score (ESG and ESG Momentum):
      - We select 30% of stocks in the long leg by selecting 40% of stocks with the highest ESG score
      and then excluding 10% of stocks with the lowest ESG Momentum. Similarly, the short leg selects
      40% of stocks with the lowest ESG score and then excludes 10% of stocks with the highest ESG
      Momentum. This sequential combination is based on Verheyden, Eccles and Feiner (2016).

     5 - The MSCI data we use does not contain the simple aggregation of E, S and G components but it does contain the weights for each component in each
     industry. We use this information to derive the overall ESG score. MSCI also publishes an overall ESG score which is not the weighted average of components,
     but instead removes cross-industry effects by normalising scores based on their GICS industry classification (69 industries). Instead of using these scores, we
     rely on the overall ESG scores computed as the weighted average individual component score (E, S, and G scores). We test the use of overall ESG and individual
     component scores (E,S and G) in both standard and sector neutral strategies, where we neutralise sector effects based on the TRBC sector classification.
     6 - The Scientific Beta stock universes are similar to those of other equity indices covering large and mid-cap stocks. Over the sample period (1/01/2008
     - 30/06/2020) the correlation of daily returns (in dollars) over time of the Scientific Beta US Cap-weighted index with the MSCI USA Index is 0.99, and the
     correlation of daily returns (in dollars) over time of the Scientific Beta Developed ex-US Index with the MSCI World ex-USA is 0.99.
     7 - An ESG Momentum score is missing if the current or last year’s ESG score is missing.
11 2. Factor Exposures and Sector Biases
A Scientific Beta Publication — “Honey, I Shrunk the ESG Alpha”: Risk-Adjusting ESG Portfolio Returns — April 2021
12 Copyright © 2021 Scientific Beta. All rights reserved. Please refer to the disclaimer at the end of this document.
2. Factor Exposures and Sector Biases
2.1. Simple Performance
Exhibit 2 shows basic risk and return metrics over our sample period from January 2008 to June 2020.
Clearly, the simple performance of ESG strategies looks attractive. In line with the original papers,
some ESG strategies have positive returns, that can be economically large – with up to almost 3%
per year – albeit statistically insignificant.
Exhibit 2: Basic Risk and Return Statistics for ESG Strategies
Jan 2008 - Jun 2020 ESG E S G ESG Momentum Combination
Scientific Beta US Universe
Ann. Return 1.29% 2.89% -0.23% 0.45% 0.15% 1.92%
t-statistic 0.85 1.71 -0.05 0.40 0.19 1.23
Ann. Volatility 6.13% 6.29% 5.47% 5.17% 5.35% 5.92%
Sharpe Ratio 0.21 0.46 -0.04 0.09 0.03 0.32
Max Drawdown 17.29% 13.64% 20.07% 18.04% 19.71% 14.91%
Scientific Beta Developed ex-US Universe
Ann. Return 1.63% 2.43% 1.07% -0.85% -0.26% 0.48%
t-statistic 0.90 1.59 0.70 -0.05 -0.11 0.36
Ann. Volatility 7.43% 5.71% 6.36% 11.60% 4.81% 7.01%
Sharpe Ratio 0.22 0.43 0.17 -0.07 -0.05 0.07
Max Drawdown 11.19% 16.26% 13.04% 19.52% 17.96% 18.40%
The analysis is based on the Scientific Beta United States universe in the upper panel and on Scientific Beta Developed ex-US in the lower panel. The
analysis was done using daily data. t-statistics with an absolute value greater than two indicate statistical significance at conventional levels. The
sample period ranges from 1/01/2008 to 30/06/2020.
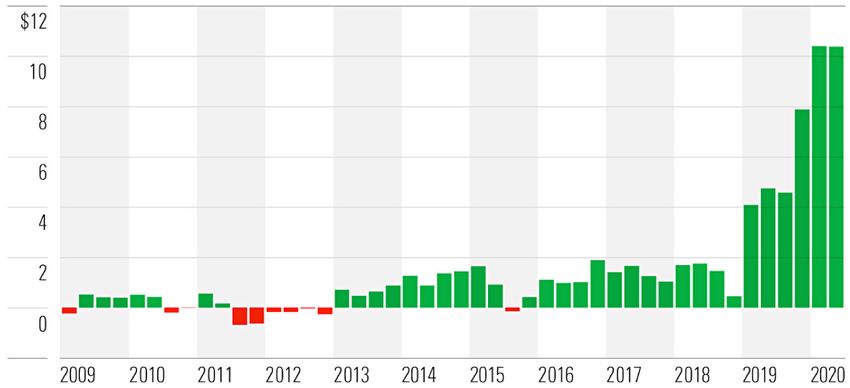
Exhibit 3: Cumulative Returns of ESG Strategies
The plots show the time series of cumulative returns of the strategies, calculated from daily returns for the entire sample period. The sample period
ranges from 1/01/2008 to 30/06/2020. The strategies refer to the Scientific Beta US universe and Scientific Beta Developed ex-US universe.
It is useful to assess how returns evolved over our sample period. Exhibit 3 plots the time series of
cumulative returns. The plot on the left-hand side shows US returns, and the plot on the right-hand
side shows developed markets outside the US. Cumulative returns for the best performing strategiesA Scientific Beta Publication — “Honey, I Shrunk the ESG Alpha”: Risk-Adjusting ESG Portfolio Returns — April 2021 13
Copyright © 2021 Scientific Beta. All rights reserved. Please refer to the disclaimer at the end of this document.
2. Factor Exposures and Sector Biases
are substantial: above 30% in both universes. Returns of most strategies are particularly strong in the
second half of the sample. This pattern implies that omitting the earlier period would lead to higher
estimates of average returns. Indeed, using the period from 2013 as in Giese, Nagy, and Lee (2020)
increases ESG returns by more than 1% per year8.
While such return plots are commonly shown in communications of asset managers to their clients –
and in papers on ESG investing – they do not allow for sensible conclusions on the investment merits
of a strategy. Instead, investors need to consider risk-adjusted returns.
2.2. Adjusting for Factor Exposures
Simple returns (or volatility-adjusted returns such as the Sharpe Ratio) are not relevant for investors
because they ignore interaction of the strategy with other components of the investor’s portfolio. Except
for the degenerate case where an investor considers holding 100% of their portfolio in a candidate
strategy, we need to account for their other investment options. In particular, we need to account
for overlap with standard factors. Factors such as value, size, momentum, low risk, investment and
profitability have been documented as sources of long-term returns. Investors who have access to
such factors only care about a strategy’s value-added beyond compensation for its factor exposures.
Value-added needs to be measured as alpha from a multi-factor spanning regression (Fama 1998).
Only ESG strategies with significant alpha increase the Sharpe ratio of the total portfolio of investors
who have access to standard factors. Gibbons, Ross, Shanken (1989) show that the difference in
squared Sharpe ratio between the total portfolio that includes a candidate strategy and the squared
Sharpe ratio of the portfolio without this strategy is a function of the multi-factor alpha. Taking the
ESG strategy as the candidate strategy, we can write:
Where SR denotes the Sharpe ratio, αESG is the intercept from a time series regression for strategy
returns onto the returns of standard factors, and σε iis the idiosyncratic volatility of the ESG strategy,
i.e. the variation of returns that is not explained by the standard factors. The equation shows that an
ESG strategy with a multi-factor alpha of zero does not support increasing the Sharpe ratio for the
investor, relative to the case where he ignores the ESG strategy9.
To measure the level of returns of ESG strategies that does not come from exposure to standard
factors, we employ a standard time series regression. The multi factor model includes seven factors:
the market (MRK), value (HML), size (SMB), momentum (MOM), low volatility (VOL), high profitability
(PRO), and low investment (INV) factors. We estimate alpha in time series regressions of weekly ESG
portfolio returns (in excess of the risk-free rate) on factor returns:
8 - For the period from Jan 2013 to Dec 2019, used in Giese, Nagy and Lee (2020), our strategy using the overall ESG score has an average annualised return
of 2.55% (US) and 2.95% (Developed ex US). This compares to annualised returns of 1.29% (US) and 1.63% (Developed ex US) over our full period, as shown
in Exhibit 2. Also see the supplement material to this paper for further details.
9 - An ESG strategy with a positive alpha will help investors improve the Sharpe ratio of their overall portfolio through a long position in this strategy. An
ESG strategy with a negative alpha will also help investors improve the Sharpe ratio but through a short position, i.e., a vice investing strategy.A Scientific Beta Publication — “Honey, I Shrunk the ESG Alpha”: Risk-Adjusting ESG Portfolio Returns — April 2021
14 Copyright © 2021 Scientific Beta. All rights reserved. Please refer to the disclaimer at the end of this document.
2. Factor Exposures and Sector Biases
Again, a positive alpha in this model implies that ESG strategies enable investors to improve their
risk-adjusted returns. For comparison, we also report alpha from the CAPM which adjusts returns
only for market risk, and thus ignores other risk premia available in equity markets.
Exhibit 4 shows the estimated alphas, as well as simple returns for reference. Let us first consider
the estimated CAPM alphas, that only account for the market factor as a source of reward. For the
strategies that use the aggregate ESG ratings, CAPM alphas are large in magnitude (2.57% for the
US and 1.63% for developed markets outside the US) but at best marginally significant. The strategy
using environmental ratings in the US shows a statistically significant CAPM alpha of 3.99%. Strategies
using social or governance ratings have CAPM alpha estimates that are not significantly different from
zero. The ESG Momentum strategy leads to CAPM alpha estimates that are close to zero (-0.14% and
0.06% per year) and far from reaching thresholds for significance. Finally, the combination strategy
that selects stocks based on both their aggregate ESG rating and their ESG Momentum has results
that are somewhat similar to the strategy that uses ESG ratings alone. While the CAPM alphas do not
provide strong support for positive ESG performance, a casual observer might still conclude that
there is some positive alpha to be found, especially when using environmental ratings.
However, the estimates of multi-factor alpha in Exhibit 4 subdue such a positive view on ESG alpha.
When adding non-market factors in US data, alpha shrinks from 3.99% to 0.96% for the environmental
strategy, and from 2.57% to -0.33% for the ESG strategy. In the data for developed markets outside
the US, adding equity style factors to the market factor shrinks the estimate of alpha by about 30
basis points for the overall ESG strategy and the environmental ratings strategy. Importantly, across
the different ways of using ESG ratings to build the strategies and across the two universes, none of
the estimates of multi-factor alpha are significantly different from zero. This implies that an investor
cannot improve their Sharpe ratio by using the ESG strategies we analyse here.
Exhibit 4: Estimates of Alpha of ESG Strategies from Factor Models
Jan 2008 - Jun 2020 ESG E S G ESG Momentum Combination
Geographic Universe US Dev US Dev US Dev US Dev US Dev US Dev
ex-US ex-US ex-US ex-US ex-US ex-US
Ann. Return 1.29% 1.63% 2.89% 2.43% -0.23% 1.07% 0.45% -0.85% 0.15% -0.26% 1.92% 0.48%
t-statistic 0.85 0.90 1.71 1.59 -0.05 0.70 0.40 -0.05 0.19 -0.11 1.23 0.36
CAPM Alpha 2.57% 1.63% 3.99% 2.43% 0.54% 1.08% 1.30% -0.52% 0.06% -0.14% 2.84% 0.53%
t-statistic 1.55 1.05 2.28 1.68 0.35 0.79 0.84 -0.23 0.04 -0.12 1.62 0.37
7 Factor Alpha -0.33% 1.31% 0.96% 1.95% -1.17% 1.95% -0.22% -1.75% 0.00% 0.86% 0.96% 0.52%
t-statistic -0.24 0.85 0.68 1.43 -0.84 1.43 -0.16 -0.78 0.00 0.73 0.59 0.36
The analysis was done using daily data to compute annualised returns, and weekly data for CAPM and Multi-Factor analysis. The multi-factor model
includes the market factor and the Scientific Beta long-short equal-weighted factors, namely the Size, Value, Momentum, Low Volatility, Profitability
and Investment. t-statistics with an absolute value greater than two indicate statistical significance at conventional levels. Factors returns are computed
using the stocks of the relevant geographic universe. The sample period ranges from 1/01/2008 to 30/01/2020.A Scientific Beta Publication — “Honey, I Shrunk the ESG Alpha”: Risk-Adjusting ESG Portfolio Returns — April 2021 15
Copyright © 2021 Scientific Beta. All rights reserved. Please refer to the disclaimer at the end of this document.
2. Factor Exposures and Sector Biases
We have used the multi-factor regressions as a tool to assess the incremental value-added of ESG
strategies over the implicit factor exposures. Beyond analysing value-added, it is interesting to ask
which factors drive ESG performance. Exhibit 5 shows the return contributions from standard factors
to ESG strategy returns. Panel A shows the return contributions from each factor. A high positive
contribution results from a high positive exposure to the factor if the factor had positive returns over
the sample period. For reference, Panel B also shows the factor exposures.
The results in Panel B of Exhibit 5 show that ESG strategies heavily load on some style factors. We
can take the strategy using overall ESG scores as an example. This strategy has significant negative
exposure to the size factor and positive exposure to the high profitability and the low investment
factor across the two geographical universes. Firms that are highly profitable and invest conservatively
are also known as quality firms. These factor exposures show that the overall ESG strategy behaves
like a large cap quality strategy. Other factor exposures of the overall ESG strategy are either more
muted or mixed across the two geographical universes. Neither the US nor the developed markets
strategy load significantly on the value factor. The US strategy loads positively on the low risk factor
and negatively on the momentum factor but the strategy for markets outside the US does not have
significant loadings on these two factors.
The strong relation of ESG strategies with quality factors is also visible for the other strategies that use
a single component of ESG ratings or combine ESG ratings and their momentum. Only the strategy
that focusses on ESG Momentum clearly deviates from this pattern of positive quality exposure.
Likewise, negative exposure to the size factor is common across the different types of ESG strategies.
The ESG strategies clearly resemble large cap quality strategies.
The strong quality exposure aligns with evidence that firms with strong corporate financial performance
are also ESG leaders, as developed in a literature following Wadock and Graves (1997).
Unsurprisingly, the ESG strategies received substantial return contributions from their exposures
to standard factors. Panel A of Exhibit 5 shows how these factor exposures influenced the strategy
returns over our sample. For some factors, return contributions are relatively weak despite statistically
significant exposures. This is the case for the size factor. For example, despite a significantly negative
loading on the size factor, the aggregate ESG strategy for the US receives a contribution of only
-0.01% from the size exposure. This is due to the relatively low magnitude of the size exposure and
the relatively low returns of the size factor over the sample period. Other factor exposures led to
pronounced return contributions. The results show that the quality factors (high profitability and
low investment) make pronounced positive return contributions to most types of ESG strategies.A Scientific Beta Publication — “Honey, I Shrunk the ESG Alpha”: Risk-Adjusting ESG Portfolio Returns — April 2021
16 Copyright © 2021 Scientific Beta. All rights reserved. Please refer to the disclaimer at the end of this document.
2. Factor Exposures and Sector Biases
Exhibit 5: Factor Exposures of ESG Strategies and Return Contributions from Factors
Jan 2008 - Jun 2020 ESG E S G ESG Momentum Combination
Panel A: Factor Return Contribution
Universe US Dev US Dev US Dev US Dev US Dev US Dev
ex-US ex-US ex-US ex-US ex-US ex-US
Market -0.14% 0.08% 0.09% 0.06% -0.25% 0.05% -0.19% 0.13% 0.08% 0.00% -0.21% 0.07%
Size -0.01% -0.40% -0.01% -0.40% -0.01% -0.42% 0.01% -0.19% 0.00% -0.17% -0.01% -0.23%
Value 0.07% -0.03% 0.28% 0.01% 0.09% 0.02% -0.23% -0.07% 0.22% 0.07% 0.12% 0.03%
Momentum 0.14% 0.01% 0.17% -0.01% 0.17% -0.09% -0.15% 0.05% 0.16% -0.13% 0.14% -0.13%
Low Volatility -0.02% 0.04% -0.01% 0.03% 0.01% -0.02% -0.04% 0.09% 0.01% -0.05% 0.00% 0.03%
Profitability 1.47% 0.50% 1.42% 0.56% 0.95% -0.28% 0.93% 1.14% -0.12% -0.49% 0.82% 0.24%
Investment 0.19% 0.08% 0.12% 0.13% 0.18% 0.06% 0.10% 0.00% 0.01% -0.05% 0.18% 0.05%
Panel B: Factor Exposures (Betas)
Universe US Dev US Dev US Dev US Dev US Dev US Dev
ex-US ex-US ex-US ex-US ex-US ex-US
Market -0.02 0.10 0.01 0.06 -0.03 0.05 -0.03 0.15 0.01 0.00 -0.03 0.08
t-statistic -1.38 5.86 0.88 4.39 -2.36 3.65 -1.84 6.00 0.65 -0.17 -1.73 5.24
Size -0.09 -0.14 -0.12 -0.14 -0.07 -0.15 0.11 -0.07 -0.01 -0.06 -0.10 -0.08
t-statistic -4.40 -3.85 -5.84 -4.36 -3.18 -4.61 4.94 -1.26 -0.63 -2.09 -4.13 -2.33
Value -0.04 0.07 -0.16 -0.02 -0.05 -0.06 0.13 0.17 -0.13 -0.18 -0.07 -0.07
t-statistic -0.95 1.15 -3.82 -0.30 -1.21 -1.02 3.04 1.89 -2.70 -3.91 -1.44 -1.18
Momentum -0.05 0.01 -0.06 0.00 -0.06 -0.04 0.05 0.02 -0.06 -0.06 -0.05 -0.06
t-statistic -2.67 0.19 -3.10 -0.17 -3.20 -1.63 2.72 0.48 -2.74 -2.49 -2.34 -2.15
Low Volatility 0.06 0.02 0.04 0.02 -0.02 -0.02 0.11 0.06 -0.03 -0.03 0.01 0.02
t-statistic 2.95 0.78 2.03 0.66 -1.03 -0.60 5.60 1.39 -1.53 -1.29 0.58 0.61
Profitability 0.28 0.13 0.27 0.15 0.18 -0.07 0.18 0.30 -0.02 -0.13 0.16 0.06
t-statistic 7.43 1.78 6.98 2.24 4.68 -1.12 4.49 2.72 -0.54 -2.25 3.50 0.88
Investment 0.25 0.20 0.15 0.32 0.23 0.15 0.13 0.00 0.01 -0.11 0.22 0.13
t-statistic 6.28 4.07 3.76 7.18 5.82 3.31 3.23 -0.07 0.21 -3.01 4.84 2.84
The attributed return is the product of annualised factor return (geometric) and the corresponding factor exposure. The unexplained is computed as a
difference between portfolio’s excess return (over the risk-free) and the total performance explained by the factor model. Factors are computed using
the stocks of the relevant universe. The factor performance contributions table refer to the breakdown of annualised return of strategies computed with
weekly data. The sample period ranges 1/01/2008 to 30/01/2020. The multi-factor model includes the market factor and the Scientific Beta long-short
equal-weighted factors, namely the Size, Value, Momentum, Low Volatility, Profitability and Investment. The factors are not neutralised with respect
to the market factor. t-statistics with an absolute value greater than two indicate statistical significance at conventional levels.
Exhibit 6 further illustrates the importance of quality factors for the returns of ESG strategies.
The bars indicate the sum of return contribution from the low investment and the high profitability factor
for each of the ESG strategies. Annualised returns of the strategies are shown for comparison. It is clear from
these results that returns of the ESG strategy heavily depend on quality factors. For example, the US strategy
that uses aggregate ESG ratings has a contribution from quality factors of about 1.7% per year, exceeding its
annualised returns of about 1.3%. Over our sample period, an investor who has simply tilted to quality factors
with the same intensity as the US ESG strategy has done, would have outperformed the ESG strategy. For
the strategy using overall ESG ratings outside the US, the quality factors contributed roughly to one third of
its returns. The return contribution of quality factors to the other types of strategies is also substantial when
compared to their annualised returns.A Scientific Beta Publication — “Honey, I Shrunk the ESG Alpha”: Risk-Adjusting ESG Portfolio Returns — April 2021 17
Copyright © 2021 Scientific Beta. All rights reserved. Please refer to the disclaimer at the end of this document.
2. Factor Exposures and Sector Biases
Exhibit 6: Contribution from Quality Factors to Returns of ESG Strategies
Based on factor return contributions reported in Exhibit 5. The bars indicate the sum of return contribution from the low investment and the high
profitability factor for each of the ESG strategies.
The rightmost bars indicate the average across all 12 ESG strategies (six ways of using ESG ratings
in two geographies). On average, the ESG strategies deliver annualised returns of 0.91% per year, of
which 0.68% per year are contributed by exposures to the quality factors. Thus, on average, quality
factors account for 75% of ESG returns10.
2.3. Accounting for Sector Biases and Factor Exposures
In addition to factor exposures, portfolios that favour ESG leaders may pick up industry effects.
There is no good reason why firm performance on environmental, social and governance issues
should be orthogonal to industries. Therefore, the strategies analysed above may be subject to
important sector biases. We can easily identify sector biases in these long/short strategies. Differences
in sector allocation among ESG leaders (in the long leg) and laggards (in the short leg) will show up
directly as nonzero sector weights at the level of the long/short strategy.
Indeed, Exhibit 7 shows that the ESG strategies have pronounced sector biases, except in the
case of the ESG Momentum strategy. Omitting Momentum, the total sector bias (defined as the
sum of absolute sector weights) reaches levels ranging from 22% to 46% across the different
strategies. This means that shuffling stock weights to get to a sector neutral strategy would induce
a (one-way) turnover of 22% to 46%. Clearly, stock weights in the strategies are far away from sector
neutrality.
10 - This result is obtained from computing the average return contribution from the two quality factors across the 12 strategies above and dividing by the
average value of the annualised return across the 12 strategies.A Scientific Beta Publication — “Honey, I Shrunk the ESG Alpha”: Risk-Adjusting ESG Portfolio Returns — April 2021
18 Copyright © 2021 Scientific Beta. All rights reserved. Please refer to the disclaimer at the end of this document.
2. Factor Exposures and Sector Biases
Exhibit 7: Sector Weights of Long/Short ESG Strategies
Average Sector ESG E S G ESG Momentum Combination
Allocation Over Time
(Jan 2008 - Jun 2020)
Universe US Dev US Dev US Dev US Dev US Dev US Dev
ex-US ex-US ex-US ex-US ex-US ex-US
Energy -8.73% 1.60% -13.80% -2.73% -0.04% 4.97% -3.30% 1.42% 2.34% 0.23% -5.61% 1.17%
Basic Materials -1.67% -2.35% -3.80% -7.23% -1.11% -1.61% 0.74% 4.16% -0.29% -0.29% -1.99% -1.70%
Industrials 5.78% 6.00% 2.27% 7.33% -3.46% 2.49% 2.60% -6.20% 1.38% 2.30% 7.28% 5.39%
Cyclical Consumer -5.39% 0.96% -0.41% 1.21% -6.37% -0.50% -0.93% -0.89% -0.65% -1.08% -5.56% 0.94%
Non-Cyclical Consumer -2.88% -4.68% -2.97% -5.11% -0.71% -1.22% -0.69% 2.91% 1.18% 0.32% -1.70% -3.66%
Financials 0.19% -6.95% 2.91% -5.87% -2.62% -7.23% 0.90% -2.13% -1.57% -0.80% -1.63% -6.55%
Healthcare -1.75% -2.57% 10.11% 3.61% -0.47% -0.86% -9.32% -4.95% -1.74% -0.69% -1.77% -3.00%
Technology 12.75% 0.62% 6.33% 0.65% 12.51% 0.49% 8.29% 2.03% -1.67% -0.27% 9.46% 0.83%
Telecoms -0.81% 2.63% 1.46% 6.03% -0.87% 1.84% -0.11% 0.11% 0.18% 1.44% -0.84% 3.54%
Utilities 2.50% 4.74% -2.09% 2.11% 3.14% 1.62% 1.82% 3.53% 0.85% -1.16% 2.37% 3.04%
Total Sector Bias 42.45% 33.08% 46.15% 41.90% 31.31% 22.83% 28.69% 28.33% 11.86% 8.59% 38.21% 29.81%
We use the Thomson Reuters Sector Classification (TRBC). The table shows the average sector weight over time for each of the six ESG strategies over
the sample January 2008 - June 2020 for US universe and Developed ex-US universe. Sector weights are computed for each strategy at each monthly
rebalancing date and averaged over time. The total Sector Bias is the sum of the absolute values of the portfolio weights in each sector.
In the US, ESG strategies overweight technology stocks. The strategy using the overall ESG rating
has a 12.75% weight in technology stocks. A strong bias towards technology stocks is also present
in each of the strategies using a single ratings component.
When constructing the strategies, we can impose constraints to match sector allocations in the long
and short. We create ESG strategies that remove sector biases at each monthly rebalancing date.
To obtain sector neutral portfolios, we select stocks by their ESG characteristics within each of the
10 sectors, using the Thomson Reuters sector classification. We equally-weight the selected stocks
within each sector, and weight each sector portfolio by the sector’s weight in the cap-weighted index.
Due to this procedure, the total sector bias of the ESG strategies will be zero by construction.
The performance of sector neutral ESG strategies captures their value-added more accurately,
removing the confounding effects of sector allocation differences across strategies. Exhibit 8 reports
the annualised returns and annualised alphas of the sector neutral strategies. The annualised
returns of the corresponding strategies without sector neutrality are reported as a reference point.A Scientific Beta Publication — “Honey, I Shrunk the ESG Alpha”: Risk-Adjusting ESG Portfolio Returns — April 2021 19
Copyright © 2021 Scientific Beta. All rights reserved. Please refer to the disclaimer at the end of this document.
2. Factor Exposures and Sector Biases
Exhibit 8: Annualised Returns and Estimated Alphas of Sector Neutral Strategies
Jan 2008 – Jun 2020 ESG E S G ESG Momentum Combination
Universe US Dev US Dev US Dev US Dev US Dev US Dev
ex-US ex-US ex-US ex-US ex-US ex-US
Without Sector Neutrality
Ann. Return 1.29% 1.63% 2.89% 2.43% -0.23% 1.07% 0.45% -0.85% 0.15% -0.26% 1.92% 0.48%
t-statistic 0.85 0.90 1.71 1.59 -0.05 0.70 0.40 -0.05 0.19 -0.11 1.23 0.36
With Sector Neutrality
Ann. Return -0.58% 1.33% 0.48% 1.28% -0.72% 0.91% 0.87% 0.36% 0.10% -0.14% 0.74% 0.67%
t-statistic -0.36 0.74 0.46 0.86 -0.52 0.62 0.81 0.31 0.16 -0.03 0.62 0.46
CAPM Alpha 0.25% 1.28% 1.03% 1.19% -0.16% 0.86% 1.51% 0.55% 0.06% 0.04% 1.21% 0.69%
t-statistic 0.2 0.83 0.82 0.91 -0.14 0.67 1.29 0.26 0.05 0.03 0.91 0.49
7 Factor Alpha -1.09% 0.79% -0.32% 0.92% -1.28% 1.58% 0.40% -0.30% 0.31% 0.85% -0.05% 0.81%
t-statistic -0.99 0.52 -0.29 0.74 -1.19 1.23 0.35 -0.14 0.24 0.78 -0.04 0.58
The analysis was done using daily data except for CAPM and Multi-Factor analysis, which uses weekly data. The multi-factor model includes the market
factor and the Scientific Beta long-short equal-weighted factors, namely the Size, Value, Momentum, Low Volatility, Profitability and Investment.
t-statistics with an absolute value greater than two indicate statistical significance at conventional levels. Strategies are sector-neutralised by
selecting and weighting stocks at the sector-level and then re-aggregating all sectorial portfolio to match the sector allocation of the cap-weighted
index of the relevant stock universe. Factors are computed on using the stocks of the relevant stock universe. The sample period ranges 1/01/2008
to 30/01/2020
It is clear from the results in Exhibit 8 that sector neutrality weakens the performance of the ESG
strategies. Returns for US strategies shrink dramatically when imposing sector neutrality. Annualised
returns of the aggregate ESG ratings strategy were 1.29% per year without sector neutrality. The
corresponding sector neutral strategy yielded returns of -0.58%. The strategy using the environmental
ratings had annualised returns of 2.89% when accepting the implicit sector bets. With sector neutrality,
returns shrink to 0.48% per year.
Going beyond simple returns, Exhibit 8 reports the CAPM alpha and multi-factor alpha of the sector
neutral strategies. None of the sector neutral strategies shows significant alpha in any model. This
finding implies that ESG ratings were not a separate source of outperformance for investors over
our sample period. Instead, ESG strategies implicitly tilted to different sectors (such as technology)
and equity style factors (such as quality) and these implicit tilts may have paid off over the sample
period.
Exhibit 9 provides a summary of our findings. For each of the strategies we have constructed, we
first plot the annualised CAPM alpha. Using this popular performance measure suggests benefits
for most strategies. But measuring performance as CAPM alpha does not provide relevant conclusions.
We analyse how performance metrics change when accounting for implicit biases of the ESG strategies.
Exhibit 9 plots the resulting performance metrics. First, we show the CAPM alpha after removing
sector effects. We then add equity style factors to the model. Finally, we account for estimation
risk by plotting the lower bound of the alpha estimate at 95% confidence. If there was significant
outperformance after all adjustments, these lower bounds would be positive.A Scientific Beta Publication — “Honey, I Shrunk the ESG Alpha”: Risk-Adjusting ESG Portfolio Returns — April 2021
20 Copyright © 2021 Scientific Beta. All rights reserved. Please refer to the disclaimer at the end of this document.
2. Factor Exposures and Sector Biases
Exhibit 9: Shrinking ESG Alphas when Applying Subsequent Risk Adjustments
The two charts above show annualised alphas of the six ESG strategies after several factor and sector adjustments for the US universe and the Developed
ex-US Universe respectively, over the period 1 Jan 2008 to 30 Jun 2020, computed using weekly data. The bar chart shows the annualised CAPM alpha
of the six ESG strategies, the annualised CAPM alpha of the six ESG strategies in the sector-neutral version, the 7-Factor alpha of the six ESG strategies
in the sector-neutral version, and the 7-Factor alpha Lower Bound of the six ESG strategies in the sector-neutral, which is defined as the annualised
7-Factor alpha of the sector-neutral ESG strategy minus two standard errors.
Exhibit 9 shows that performance shrinks when making necessary risk adjustments. None of the
strategies adds performance over simple sector and factor tilts.
Our conclusion holds when considering the period from 2008 to 2020, admittedly a rather short
period. We had seen from Exhibit 3 that returns of ESG strategies were stronger in the later part
of our sample. To provide perspective on the evolution of performance over time, Exhibit 10 plots
cumulative alphas, defined as the difference between the return of the sector-neutral ESG strategies
and the return component that is explained by their factor exposures.
Exhibit 10: Cumulative Returns Net of Sector and Factor Effects
The plots show the time series of cumulative 7-Factor alphas of the strategies (Sector Neutral Version), calculated from daily returns for the entire
sample period. The cumulative alpha is computed as a difference between cumulative absolute returns of a strategy cumulative factor returns times
the factor betas estimated over the full sample. The sample period ranges from 1/01/2008 to 30/06/2020. The strategies refer to the Scientific Beta US
universe and Scientific Beta Developed ex-US universe.A Scientific Beta Publication — “Honey, I Shrunk the ESG Alpha”: Risk-Adjusting ESG Portfolio Returns — April 2021 21
Copyright © 2021 Scientific Beta. All rights reserved. Please refer to the disclaimer at the end of this document.
2. Factor Exposures and Sector Biases
The graphs in Exhibit 10 show that ESG strategies consistently deliver zero alpha when accounting
for sector neutrality and exposure to standard factors. The flat lines in Exhibit 10 provide relevant
information for investors on the performance benefits of ESG strategies because the results fully
account for risks related to sector biases and factor exposures. In contrast, the upward-sloping lines
in Exhibit 3 are much less relevant because they ignore such risks. Figures of unadjusted returns (like
Exhibit 3) seem to be much more popular in the investment industry than figures of risk-adjusted
returns (like Exhibit 10). We suspect that this might be due to a preference for upward-sloping lines
among product providers, but we leave a thorough investigation of this topic to future research.22 3. Downside Risk
A Scientific Beta Publication — “Honey, I Shrunk the ESG Alpha”: Risk-Adjusting ESG Portfolio Returns — April 2021
23   Copyright © 2021 Scientific Beta. All rights reserved. Please refer to the disclaimer at the end of this document.

     3. Downside Risk

     A popular argument is that ESG ratings capture risk exposures that stem from environmental, social
     and governance issues. Therefore, ESG leaders may be less risky than ESG laggards. There is some
     empirical support for this idea. For example, Dunn, Fitzgibbons and Pomorski (2018) find that ESG
     leaders tend to have lower market beta and lower volatility.

     The analysis above of value-added from factor models fully accounts for possible risk reduction
     benefits of ESG leaders in terms of volatility or market beta. Our factor models capture such effects
     as they include both a market and a low volatility factor. Exhibit 5 above includes factor exposures
     to the market factor and the low volatility factor. In the US data, the overall ESG strategy, the
     environmental ratings strategy and the governance ratings strategy all have significant positive
     exposure to the low volatility factor. The US ESG ratings strategy, the social ratings strategy and the
     governance ratings strategy have significant negative market beta. This confirms that ESG leaders
     may have lower risk. The multi factor alpha we use as a measure of value added fully accounts for
     this. For example, if a strategy has a negative market beta (and market returns are positive), the
     reduction in market exposure will lower its normal returns and drive up its estimated alpha.

     However, our factor models do not capture potential benefits from reduced downside risk. Unlike
     simple market beta, downside risk captures asymmetric exposure. Investors are averse to losses
     that occur in bad times more than to losses that occur in good times, and this idea can be captured
     in measures of downside risk. It has been argued that ESG strategies offer exposure to equity
     markets, with reduced sensitivity in crisis periods. There is support for this idea in the empirical
     literature, even though studies focus on particularly short time periods. For example, Lins, Servaes
     and Tamayo (2017) find that socially responsible firms suffered less during the 2008-09 financial
     crisis. Albuquerque et al (2020) find that stocks with a high environmental and social rating suffered
     less during the downmarket in the first quarter of 2020. Asset managers also emphasise that ESG
     strategies are useful for downside risk reduction. For example, Allianz Global Investors (2018) states:
     “the focus on ESG is a core part of the armoury in protecting portfolios against downside risk.”

     Our performance analysis above does not capture such possible downside risk reduction benefits,
     because we use constant parameter models that do not include any asymmetries or state
     dependencies. We extend our analysis to account for possible benefits in terms of downside risk
     reduction. We augment standard factor models with a downside risk factor. Similar to the analysis
     above, we run time series regressions of strategy returns on a set of risk factors:

     where Dt is the return of the downside risk factor during week t, and Ft is a column vector of returns
     in week t of a standard set of risk-factors. We consider two specifications for Ft, one where we only
     include only the market factor and one where we include the market factor and the six equity style
     factors.   is the loading of the strategy returns on the downside risk factor and     is the row vector
     of loadings on the other factors.
A Scientific Beta Publication — “Honey, I Shrunk the ESG Alpha”: Risk-Adjusting ESG Portfolio Returns — April 2021 24
Copyright © 2021 Scientific Beta. All rights reserved. Please refer to the disclaimer at the end of this document.
3. Downside Risk
Our analysis allows us to address two questions:
• First, we test whether ESG strategies protect against downside risk. If they do, our estimate of
should be negative.
• Second, we test whether ESG strategies outperform when accounting for downside risk. If so, our
estimate of αs should be positive.
Before turning to results, we will discuss how we define the downside risk factor. This factor should
capture the risk of an increase in portfolio’s market exposure during down markets. Following Ang,
Chen and Xing (2006), we compute a stock’s downside beta11, which we denote with , as the
difference between its market beta in periods when market returns are low (below the median) and
its unconditional market beta, i.e.
where
The downside risk factor is long 30% of stocks with the highest downside beta and short 30% of
stocks with the lowest downside beta. The stock selection is done each quarter based on the market
betas and downside betas estimated over the most recent two-year period. In the developed ex-
US universe, the stock selection is made within each geographical block12, and stocks are equally
weighted within each block. The geographical blocks are weighted with their market capitalisation.
Turning to our first test, we assess if the different types of ESG strategies we have constructed have
negative exposure to the downside risk factor. Exhibit 11 shows the estimate of exposure to the
downside risk factor and the associated t-statistic. Statistically significant estimates of downside risk
exposure at 5% level are indicated in bold.
Exhibit 11: Exposure to Downside Risk Factor
Jan 2008 - Jun 2020 ESG E S G ESG Momentum Combination
Universe US Dev. US Dev. US Dev. US Dev. US Dev. US Dev.
Ex-US Ex-US Ex-US Ex-US Ex-US Ex-US
Augmented CAPM
Downside Risk Exposure -0.15 0.00 -0.17 -0.01 -0.10 0.04 -0.05 -0.06 0.03 0.01 -0.14 -0.01
t-statistic -7.02 -0.03 -7.5 -0.52 -4.85 1.64 -2.37 -1.41 1.31 0.29 -5.94 -0.53
Augmented 7 Factor Model
Downside Risk Exposure 0.03 0.14 0.00 0.22 -0.08 0.07 0.11 0.02 0.01 -0.06 -0.06 0.07
t-statistic 1.14 2.78 0.08 5.04 -2.76 1.58 3.72 0.28 0.22 -1.49 -1.76 1.45
The table reports downside betas and corresponding t-statistics estimated in CAPM and 7-factor models augmented by the addition of the Downside
risk-factor. t-statistics with an absolute value greater than two indicate statistical significance at conventional levels. The analysis has been computed
using weekly returns. The sample period ranges 1/01/2008 to 30/01/2020.
11 - We use two years of weekly data in local currency. If a stock has fewer than 90 weekly return observations its relative downside beta will be considered
as missing and replaced by the cross-sectional median value of relative downside beta estimates of stocks in the same universe. The long/short factor is
rebalanced quarterly. In the Developed ex-US Universe, the stock selection is made within each geographical block, and stocks are equally weighted within
each block. Then the aggregate weight assigned to a geographical block reflects the weight of the geographical block in the Cap-Weighted Portfolio.
Whenever the geographical block contains multiple countries with different national currencies, we use returns in USD for estimation.
12 - The Scientific Beta Developed ex-US universe consists of the following six geographic blocks: Canada, Developed Asia Pacific ex-Japan, Japan, Developed
EMEA ex-Eurozone and ex-UK, Eurozone and UK.You can also read