Blended Finance Model to Reduce Non-revenue Water and Energy Consumption in Vietnam - P4G
←
→
Page content transcription
If your browser does not render page correctly, please read the page content below

Blended Finance Model to Reduce
Non-revenue Water and Energy
Consumption in Vietnam
CONTENTS

Contents                                                                          1
List of Tables                                                                    2
List of Figures                                                                   3
List of Abbreviations                                                             4
Executive Summary                                                                 5
I. Introduction                                                                   6
1. Introduction on water sector in Vietnam                                        7
     1.1 National policy context                                                  8
     1.2 Water sector overview                                                    9
     1.3 Current NRW status in Vietnam                                           10
     1.4 Energy consumption related to water distribution                        11
2. Investment trends and programs in water sector in Vietnam                     12
     2.1 Investment trends and estimated investment needs in water sector        13
     2.2 Main sources of investment in the water sector                          14
     2.3 Equitization and public-private partnerships                            15
     2.4 Water tariff                                                            16
3. Objectives and scope of the study                                             17

II. Study activities and results                                                 18
1. Pressure management for reducing water leakages and energy consumption        19
2. Identification of barriers for implementing business models in water sector   20
3. Analysis of financial instruments for investment in water sector              21
4. Case studies on investment in water sector in Vietnam                         22
5. Recommendation for blended finance model                                      23
6. Identification of future challenges and recommendations                       24
7. Conclusions                                                                   25
References                                                                       26
Annex A - List of persons participated in the interviews                         27
LIST OF TABLES

Table 1 Vietnam water balance                                                                   1
Table 2 Targets for urban water supply development in Vietnam                                   2
Table 3 NRW levels reported for several cities/provinces in Vietnam                             3
Table 4 Governmental expenditure and ODA in the water sector in Vietnam during the period
        of 2002-2011                                                                            4
Table 5 Investment programs in water sector                                                     5
Table 6 Water tariff for Hanoi City                                                             6
Table 7 Water tariff for Ho Chi Minh City                                                       7
Table 8 Problems and benefits for water utilities’ different modes of operation                 8
Table 9 Assessment of saving potential for four water networks in Vietnam                       9
Table 10 Key barriers for implementing business models in water sector                         10
Table 11 Grants vs. loans                                                                      11

                                      LIST OF FIGURES

Figure 1 Benefits of pressure management                                                        1
Figure 2 Recommended blended finance model                                                      2
Figure 3 Concept of performance-based contract                                                  3
LIST OF ABBREVIATIONS

ADB      Asian Development Bank
ASEAN    Associations of Southeast Asian Nations
ASSIST   Asia Society for Social Improvement and Sustainable Transformation (ASSIST Inc.)
ATI      Administration of Technical Infrastructure
CAPEX    Capital Expenditure
IFC      International Finance Corporation
IFU      Investing Fund for Developing Countries
IDA      International Development Association
MOC      Ministry of Construction
MOF      Ministry of Finance
MPI      Ministry of Planning and Investment
NRW      Non-revenue Water
ODA      Official development assistance
P4G      Partnering for Green Growth and the Global Goals
PPC      Provincial People Committee
SDGl     Sustainable Development Goal
VWSA     Vietnam Water Supply and Sewerage Association
WASH     Water Sanitation and Hygiene
WB       World Bank
Blended Finance Model to reduce Non-Revenue Water
                                                                   and energy consumption in Vietnam

                          EXECUTIVE SUMMARY

The World Bank assesses that investment in water            viability of water utilities through commercial
infrastructure must triple to US$ 114 billion per year in   losses and increased operational costs. The waste
order to meet the Sustainable Development Goal (SDGs)       of resources resulting from high NRW in developing
on water. According to the UN-Water Global Analysis         countries is considerable and furthermore entails
and Assessment of Sanitation and Drinking-Water 2017        a health risk as a leaking network is also in
report, there has been an increase in countries’ budget     higher risk of contamination. There is a need for
for water, sanitation and hygiene (WASH) at an annual       strong support with respect to water governance,
average rate of 4.9% over the last three years. However,    financial framework, and incentive mechanisms
80% of these countries have reported that WASH              to   implement     an    effective   NRW      program.
financing is still insufficient to meet the nationally-
defined targets for WASH services (WHO, 2017).              In Vietnam, the rapid urbanization and industrialization
                                                            in the recent years have led to the significant
Non-revenue water (NRW) is one of the major                 increase in daily water consumption. In order to
challenges affecting water utilities in the developing      meet this increasing water demand over time, an
countries. NRW is the difference between the                expansion of water supply network is required. Vietnam
amount of water flows through distribution system           has a rate of NRW of around 30% in 2009, and the
and the amount of water billed to consumers. High           Government ofVietnam has an ambitious target to reduce
volumes of NRW seriously affect the financial               NRW to 15% by the year 2025 (Geospartial World, 2013).

                                                                                                                       1
There is a number of barriers for water utilities to reduce NRW including technical, institutional, and
    financial barriers. Given an existing lack of financial resources for WASH services as mentioned above,
    investments from private sector, especially in water infrastructure, are clearly needed. However, the
    existing private investment in water sector in Vietnam is still limited due to the low water tariffs that
    discourage the involvement of private sector.

    The Asia Society for Social Improvement and Sustainable Transformation (ASSIST), the Vietnam Water Supply
    and Sewerage Association (VWSA), Investment Fund for Developing Countries (IFU), and Grundfos have
    expressed interest to collaborate through a partnership, and have successfully applied for an opportunity
    with Partnering for Green Growth and the Global Goals (P4G) for financial support to develop a blended
    finance model towards reducing NRW and energy consumption in water distribution networks in Vietnam.
    This blended finance model, where both public and private investments are part of the financial package,
    need to be advanced in the coming years.

    Outputs from this partnership

    Since establishing the partnership, a number of activities have been conducted to support the overall
    objective of developing a blended finance model, including:
        • Develop a framework and contents for the study;
        • Perform desk review on Vietnamese water sector;
        • Carry out data collection and interviews with officials and financial experts from both the
            governmental and private sectors on opportunities and challenges in the water sector in Vietnam,
            existing initiatives, funding schemes, etc.;
        • Perform data analysis and desk study for developing the blended finance model;
        • Perform assessment of saving potential in the representative water networks in Vietnam;
        • Organize workshops with relevant stakeholders for discussing the initial findings and potential
            ways forward;
        • Active participation in the P4G Summit;
        • Prepare the study report.

    Based on these activities, the partnership has made the key conclusions including:
       • Many water utilities in Vietnam struggle to finance large investments following the equitization
           process, especially as sovereign guarantee of soft loans is not viable for many utilities;
       • There are significant opportunities to reduce energy consumption and water leakage in many
           water networks based on advanced pressure management with relatively limited investments;

2
Blended Finance Model to reduce Non-Revenue Water
                                                                   and energy consumption in Vietnam

   •    The value of water and energy savings is sufficient to repay the needed investments over a 5- year
        time horizon in networks with different sizes, thereby the public support is not needed;
   •    However, when technical conditions do not allow for pressure management and larger investments are
        needed for installation of new piping etc., there is no business case without some level of grant support;
   •    Improving pressure management does not need large capital investments, which calls for a bundling
        mechanism in order to attract large equity investors and keep the administrative burden down in case of
        grant support.

The partnership has decided to initially focus on optimizing water networks, where there is a business case
without grant support, but where risk-sharing can help to scale the impact. This part of the water sector has
proven to be much greater in size than anticipated, and therefore the partnership has given priority to it.
Following success in this part of the sector, building experience, track-record and proof of concept locally, the
partnership expects to be in a significantly better position to finetune the approach to include a grant-element
in the financial model.

The partnership has enjoyed support from P4G in different forms, which has been instrumental to bring the
partnership to a milestone: Deciding how to best move ahead on realizing the potential in reducing water
leakages and energy consumption in Vietnamese water networks. Without support from P4G, the partnership
would not have had the same clarity by now, and would not be able to move ahead with the same speed and
determination.

The partnership looks forward to continuing the cooperation with P4G to advance the agenda on how to
finance the optimization of water networks.

                                                                                                                     3
Introduction
       Among the SDGs, the SDG6 targets on the universal and equitable access to
       safe and affordable drinking water for all, improved water quality, increased
       water-use efficiency across all sectors, and sustainable withdrawals and supply
       of freshwater to address water scarcity by the year 2030.

       NRW is identified as one of the major challenges for water management that many developing countries
       are now facing. A study performed by the South East Asian Utilities Network (SEAWUN) for analyzing
       the NRW levels of 47 water utilities across Indonesia, Malaysia, Thailand, the Philippines, and Vietnam
       reported that the average rate of NRW levels was about 30% (ADB, 2006). The Government of Vietnam
       has set the target for reducing NRW to 15% by the year 2025 (Prime Minister, Decision No. 2147
       dated 24th Nov. 2010).

    1. Introduction on water sector in Vietnam
    1.1 National policy context
    Economic reforms in Vietnam have placed a greater          Recently, the Government of Vietnam has approved
    role for the private sector participation as well as       a National Action Plan to Implement the 2030
    shaped the investment trends and needs in the water        Agenda for Sustainable Development by the
    sector. The water sector was partially privatized          Decision No. 622/QĐ-TTg dated May 10th 2017
    in 2007 following the Decision No. 1929/QD-TTg             of the Prime Minister. The plan includes targets
    dated 20th Nov 2009 of the Prime Minister, and then        and indicators established for SDG6 for the two
    reconfirmed by the Decision No. 2502 dated 22nd            periods of 2017-2020 and 2021-2030. In addition,
    Dec. 2016. Furthermore, Vietnam has introduced a           the Government of Vietnam approved the National
    framework of specific strategies for water resource        Green Growth Strategy for the period of 2011-
    management (FAO, 2012) including the Water Vision          2020, with a vision to 2050 by the Decision No.
    for 2025 and the National Rural Water Supply and           1393/QĐ-TTg dated Sep 25th 2012 of the Prime
    Sanitation Strategy which further promotes the role        Minister. Water use, infrastructure for irrigation and
    of private sector in providing the financial sources for   water, urbanization, water supply and sanitation are
    investment in the water sector (ODI, 2015).                topics of interest within the strategy.

4
Blended Finance Model to reduce Non-Revenue Water
                                                                  and energy consumption in Vietnam

1.2 Water sector overview
The key statistics of the water sector and an overview on the demographic and water coverage indicators in
Vietnam are summarized in Table 1.

                                     Table 1: Vietnam water balance
               Country information                     Year            Value                   Unit
  Country total area                                   2014         33,097,000                  ha
  Cultivated area (arable land + permanent crops)      2014         10,232,000                  ha
  Total population                                     2016            92.70                  million
  GDP                                                  2016           202.62               Billion USD
  Per capita GDP                                       2016            2,186                   USD
                            Surface water              2014           847.70                Billion m³
  Renewable Fresh
                            Ground water               2014            71.42                Billion m³
  Water Resources
                            Rain water                 2014           602.70                Billion m³
                            Total                      2014           884.10                Billion m³
  Total Annual Freshwater Withdrawals                  2005            81.86                Billion m³
                            Agriculture                2005            77.75                Billion m³
  Annual Freshwater
                            Municipal
  Withdrawals by
                            (including                 2005            1.21                 Billion m³
  Sectors:
                            domestic)
                            Industry                   2005            3.07                 Billion m³
 Source: FAO, 2017

 According to the Decision No. 1929/QD-TTg dated 20th Nov 2009 of the Prime Minister on approving Orientations
 for Development of Water Supply in Vietnam’s Urban Centers and Industrial Parks up to 2025 and a Vision towards
 2050, and has been modified according to the Decision No. 2502 dated 22nd Dec. 2016 the specific objectives and
 targets including: the coverage of clean water supply services in urban centers would reach 100%, with an average
 water supply norm of 120 liters/person/day and of quality up to prescribed standards; and the reduction of NRW
 down to 15% up to the year 2025. The key targets for urban water supply sector in Vietnam during the period of
 2015-2025 are summarized in Table 2.

                                                                                                                     5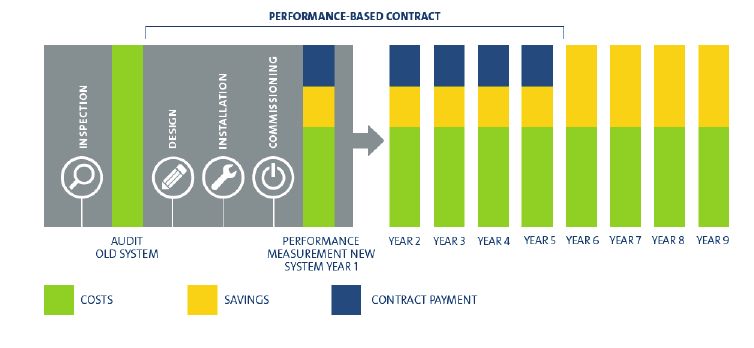
Table 2: Targets for urban water supply development in Vietnam
                             Target                                Urban category           2015      2020     2025
                                                               Categories III or higher       90
                                                                                                       95
    Coverage of clean water supply services (%)                     Categories IV             70                100
                                                                    Categories V              50       80
                                                               Categories III or higher      120
                                                                                                       120
    Water supply norm (Liters/person/day)                           Categories IV            100                120
                                                                    Categories V               -
                                                               Categories III or higher
                                                                                             < 25     < 18
    NRW (%)                                                         Categories IV                               < 15
                                                                    Categories V             < 30     < 25

    1.3 Current NRW status in Vietnam
    According to World Bank (2006), physical water losses and commercial losses can be valued using the marginal
    cost of water and the average tariff, respectively. For developing countries, US$ 0.20 and US$ 0.25 were used for
    the marginal cost and average tariff, respectively. It has been noted that commercial water losses in developing
    countries estimated at US$ 2.6 billion annually. This commercial loss is likely from the fraudulent activities and
    corruptions such as illegal connections, inaccurate meter readings, etc. These causes should be of a great concern
    for both the governments and donors. The NRW levels reported for several cities/provinces in Vietnam are
    summarized in Table 3.

                 Table 3: NRW levels reported for several cities/provinces in Vietnam

                                      Cities/provinces                      NRW
                              Ha Noi                                        23%
                              Hai Phong                                     15%
                              Hai Duong                                     17%
                              Thua Thien Hue                                13%
                              Da Nang                                       19%
                              Binh Duong                                     9%
                              Ba Ria – Vung Tau                             15%
                              Ho Chi Minh                                   32%

                              Source: DIT, 2017

6
Blended Finance Model to reduce Non-Revenue Water
and energy consumption in Vietnam
Rated as “less efficient” sector, the excessive NRW was due to a number of factors such as technical loss (leakage)
and commercial loss (illegal connections and inaccurate meter reading). In an evaluation study conducted by ADB
(2010b), the evaluation results for the improvements in NRW between 2004 and 2007 in several towns showed
that the level of NRW was high (about 30%). The evaluation results also showed that the implemented projects did
not create enough commitment in sustaining the NRW reduction target (the NRW level was expected to reduce to
15% by 2025). The NRW reduction program in all projects was neither comprehensive nor sustained. It has been
shown that NRW reduction efforts cannot be sustained through only training, replacement of pipes and meters,
and acquisition of complicated leak detection equipment.
1.4 Energy consumption related to
water distribution
According to World Bank (2012), the overall energy less treatment than surface water, thus requires less
efficiency of water distribution systems can be indicated electricity consumption. Reducing NRW can help to
by the electricity use per unit of water delivered to end- reduce the amount of losses and prevent excessive
users (kWh/m3 water). However applying this indicator energy consumption.
for evaluating energy efficiency may have two main
challenges: (1) mismatch of energy and water flow At present, the formal and frequent data collection
data, and (2) incomparable operating conditions and activities on energy consumption related to water
processing technologies among utilities. When end-use distribution are still limited in most developing
metering is not universal, oftentimes energy use per unit countries, including Vietnam. Among the few cases,
of produced water is used as an indicator but it leaves during the preparation for “Energy Efficiency for Ho
out an important efficiency factor: physical losses in Chi Minh City Water Supply Project”, Saigon Water
the distribution network. In addition, the indicator is Corporation (SAWACO) conducted an energy audit
significantly affected by processing technologies and of its operations. The energy audit report showed
operational conditions such as daily flow, mix of water that the investment of about US$ 5 million would
sources or the use of gravity for distribution, etc. result in the energy savings of 25,000 megawatt-
hours per year, translating to about US$ 1.3 million
Pumping for water distribution dominates the use of per year and an annual carbon dioxide (CO2)
energy which accounting for 70-80 % or more of the reduction of about 18,889 tons. Following the audit
overall electricity consumption (World Bank, 2012). The results, SAWACO has invested in some energy
remaining of electricity consumption is used for raw efficient components, especially to equip the treated
water pumping and treatment process. Groundwater- water pumps with variable-speed drive (VSD). By
based supply systems require more energy than surface applying this technology, it is expected that NRW will
water-based systems due to the higher pumping needs to be reduced to 25% by 2020 compared to the 2010
extract water. Meanwhile, groundwater usually requires baseline of 40% (ADB, 2013).
72. Investment trends and programs in
water sector in Vietnam
2.1 Investment trends and estimated investment
needs in water sector
There has been a decline in the governmental funding on water-related activities as a proportion of the overall
national budget (FAO, 2012). During the period of 2002-2011, the Government of Vietnam invested an average
amount of US$ 1,140 million per year on water related programs, including infrastructure projects, which accounting
for 10.2% of the total governmental expenditure (UNWater, 2013) as shown in Table 4. The largest expenditure
(50.6%) was for hydroelectric power plants, followed by those for basic water supply and basic sanitation, and
water supply and sanitation in large systems (27.8%). With respect to official development assistance (ODA)
disbursements, different investment priorities were seen with the largest amount (33.5%) for water supply and
sanitation.
Table 4: Governmental expenditure and ODA in the water sector
in Vietnam during the period of 2002-2011
Annual average Annual average
governmental ODA gross
In In
expenditure disbursements
No. Sub-sector percentage percentage
(million (million constant
(%) (%)
constant 2010 2010 US$)
US$)*
1 Hydroelectric power plants 577.63 50.6 29.54 12.3
2 Agricultural water resources 197.54 17.3 37.29 15.5
Basic drinking water supply
3 172.12 15.1 31.92 13.3
and basic sanitation
Water supply and sanitation
4 144.97 12.7 80.54 33.5
in large systems
Disaster prevention and 10.1
5 31.00 2.7 24.36
preparedness
Water resources policy and
6 11.15 1.0 12.79 5.3
administrative management
3.7
7 Water resources protection 6.16 0.6 9.02
8 River development 0.00 0.0 15.06 6.3
Total annual average 1140.57 100 240.52 100
(*) Governmental expenditure includes some ODA. It has not been possible to separate funds from governmental sources and ODA.
Source: UN-Water, 2013
8Blended Finance Model to reduce Non-Revenue Water
and energy consumption in Vietnam
2.2 Main sources of investment in the
water sector
Public financing has dominated the water sector in Vietnam historically. However, the recent policies have put
an emphasis on the role of private capital to meet the investment needs given the increasing public debt and
competing investment demands. This change is also deemed to be necessary as Vietnam has moved into the
category of middle-income countries. As a result, ODA is foreseen to decrease in the future, and that leads to a
great concern on the effectiveness in the mobilization of private investment in the water sector.
There have been three main sources of investment funds in infrastructure which divided relatively equally:
Government (28%), private sector (35%), and ODA (37%) (ERIA, 2014) as shown in Table 5. Apart from domestic
enterprises who play the role as private investors in the water sector, external funding sources come from the
Asian Development Bank (ADB), the World Bank (WB), the Japan International Cooperation Agency (JICA), and
the French Development Agency, along with the Government of Finland, Denmark, Netherlands, and South
Korea (ERIA, 2014).
There is a transition from the high reliance on public investment to some degree of private investment. With the
increasing public debt and competing investment demands, state-owned enterprises have gradually moved to
new forms of private operation and management. There have been various models of public-private partnerships,
equitization, privatization and socialization.
Table 5: Investment programs in water sector
Description Total cost (US$ million)
Proposed
Period
allocation
2010-2015 2016-2020 2021-2025 ODA State
Awareness raising for communities 5.2 3.8 2.3 5.0 6.3
Capacity building for water supply
1.8 1.3 0.7 2.3 1.5
companies & local government
NRW projects 230.0 164.0 98.0 492.0
Program management 0.3 0.3 0.3
Grant total 237.3 169.4 101.3 499.3 8.7
Source: ADB, 2010a
92.3 Equitization and public-private partnerships
The process of equitization involves the transition of The process of creating public-private partnerships
a state-owned enterprise into a joint stock company (PPPs) has been used far less than the process of
by selling equity to one or more private investors. equitization in the water sector. Establishing a PPP
The purpose of this process is to encourage private places more demands on private investors in terms
capital into the water supply or sanitation sector, of specific performance and behavioral obligations
opening opportunities and reserving public capital to (World Bank, 2014a).
use for other purposes. According to The Technical
Infrastructure Department’s report funded by the Utilities, particularly state-owned companies, PPPs,
World Bank shows that by 2016, there were 96 out and equitized companies, could borrow directly from
of 111 water companies are privatized. The remaining financial markets through loans or sale of bonds.
15 water companies (Company Limited) is under the However, this form of financing has not been used
privatization progress till 2020 as per Decision 1232 of much in Vietnam since the investment risk remains
the Prime Minister. Most of the equity capital coming too high and the investors would prefer to see state
from the private sector into equitized firms in the guarantees for payments. It is difficult for most
water sector is of Vietnamese origin (domestic private water companies to access commercial finance as
finance). ODI explains in the report of World Bank (2014b):
“There is limited access to domestic or international
The governmental policy on equitization varies debt finance within the sector. Although concessional
by sectors. Particularly for the water supply and finance and guarantees are available to public and
sanitation sector, the Government pegged a target to private investors for the development of water supply
continue to hold about 51-65% of the share capital and domestic solid waste facilities, these are provided
in equitized companies (ODI, 2015). There has been only through Vietnam Development Bank’s specific
a number of challenges presented by the equitization pilot credit lines, which are supported by donor finance
transition including difficulties for private investors rather than by the commercial banking sector”.
to work with the Government as a compulsory
business partner (World Bank, 2014a). The other
challenges include the uncertainty in regulatory and
policy framework to supervise future operations,
criteria in choosing equitization investors, and the
demand of substantial price increase in the future to
put investment back on track. The dilemma is that in
the event that there is some unexpected operating
failures on the service, private investors may consider
leaving the industry and placing the resolution of
operational problems back on the Government.
10Blended Finance Model to reduce Non-Revenue Water
and energy consumption in Vietnam
2.4 Water tariff
Water tariff levels are currently determined by the Provincial People’s Committee, based on the guidance and
framework provided by the Ministry of Finance (MOF). For examples, the water tariffs for Hanoi and Ho Chi
Minh City are shown in Table 6 and Table 7, respectively. The Decree No. 117/2007/ND-CP dated 11 July 2007
of the Prime Minister provides the guideline on production, supply and consumption of clean water. Particularly,
the Article 51 of the Decree provides the principles for the calculation of water prices, and the Article 52 of the
Decree prescribes the grounds for the formulation and adjustment of water prices.
Table 6: Water tariff for Hanoi City
Water consumption Price after 10/2013 Price after 10/2014 Price after 10/2015
(m3 (VND/m3) (VND/m3) (VND/m3)
/month)
Households
The first 10 m3 4,172 5,020 5,973
From 10 to 20m3 4,930 5,930 7,052
From 20 to 30m3 6,068 7,313 8,669
Above 30m3 10,619 13,377 15,929
Other users (constant price per m3 for all units consumed)
Administrative and
6,540 8,381 9,955
public organization/units
Material production 7,668 9,796 11,615
Businesses and service units 14,137 18,342 22,068
Source: Decision No. 38/2013/QD-UBND and Decision No. 39/2013/QD-UBND
11Table 7: Water tariff for Ho Chi Minh City
Water consumption Price after 10/2013 Price after 10/2014 Price after 10/2015
(m3 (VND/m3) (VND/m3) (VND/m3)
/month)
Households
The first 4 m3/person 4,400 4,800 5,300
From 4 to 6m3/person 8,300 9,200 10,200
Above 6 m3/person 10,500 11,000 11,400
Above 30m3 10,619 13,377 15,929
Other users (constant price per m3 for all units consumed)
Administrative and
8,100 9,300 10,300
public organization/units
Material production 7,400 8,200 9,600
Businesses and service units 13,500 15,200 16,900
Source: Decision No. 103/2009/QD-UBND and Decision No. 24/2016/QD-UBND
Vietnam has relatively low prices and tariffs for water- Given the low tariff and the insufficient revenue to
related services and this generates low revenues across sustain services with appropriate standard, utilities
the water sector. According to ADB (2010), these prices see little incentive to invest in leakage reduction
are low in relation to the full costs of the services effort. Aside from the below-cost pricing strategy that
provided; low in relation to prices charged in comparable has been used, Vietnam has also subsidized most of
countries; and low in relation to the willingness to pay. services in the water sector. Additionally, subsidized
Similarly, World Bank (2014a) reported that the ratio of loans and grants have been provided in rural areas for
the approved tariff to the tariff required by the water clean piped water and sanitation facilities. However,
utility was at 0.87 (privately operated utilities were at there has been no clear aggregate estimate of annual
0.94, state-owned utilities were at 0.87, and equitized subsidy to water supply and sanitation in Vietnam
utilities were at 0.85). There are many supporting (World Bank, 2014b; ODI, 2015).
evidences show that prices for water supply and
wastewater treatment often do not cover the full costs.
The local governments will fill the gap of the range
indicated by the MOF and that proposed by water
utilities to enable the cost recovery.
12Blended Finance Model to reduce Non-Revenue Water
and energy consumption in Vietnam
3. Objectives and scope of the study
The overall objective of the study is to develop the In this way, this study can support the achievement of
innovative blended finance model towards reducing the SDG6, SDG7 and other relevant SDGs in Vietnam. The
NRW level and energy consumption in water distribution study also provides the recommendations for scaling up
networks in Vietnam. To achieve the study’s objective, the developed blended finance model within Vietnam
the key analyses would be performed as the following: with the intention to utilize this experience in other
countries with similar challenges.
1. Assessing the pressure management as an
approach for reducing water leakages and In order to conduct this study, a series of introductory
energy consumption; meetings and interviews with officials and experts in
2. Assessing the magnitude and nature of different the key governmental agencies and organizations have
types of barriers for investing in reduction been performed (See Annex A for a list of individuals who
of NRW and energy consumption in water participated in the interviews). Those interviews have
distribution networks; shown the opportunities and challenges for achieving
3. Financial analysis for developing the blended Vietnam’s water goals and provided the basis for
finance model to promote investments in the developing the blended finance model. The preliminary
water sector; blended finance model has been presented to a group of
4. Identifying the challenges for implementation of invited stakeholders in order to gain their valuable advices
the recommended blended finance model. and feedbacks for further refinement of the model.
13Study activities
and results
Based on the study framework developed, we have collaborated with relevant
governmental agencies and organizations to collect the necessary information
by conducting the questionnaire surveys and interviews. Based on the obtained
data, the research team has performed the data analysis and used the key
findings for developing the blended finance model that recommended for
promoting the investments towards reducing NRW and energy consumption
in water distribution systems in Vietnam. The study activities and results are
presented in the following sections.
1. Pressure management for reducing
water leakages and energy
consumption
Benefits of pressure management
Leakages can be reduced in different ways, and a eliminating transients and faulty level controls,
combination of different approaches is often relevant. all of which cause the distribution system to leak
Among the approaches, pressure management has unnecessarily” (Pressure Management Team of the
been proven to be an effective one for reducing the Water Loss Specialist Group of the International
leakage part of NRW, improving energy efficiency, Water Association).
and reducing operation and maintenance costs.
Pressure management has a great potential to
Pressure management can be defined as “the improve efficiency and alleviate water scarcity
practice of managing system pressures to the concerns. In fact, pressure management is now
optimum levels of service ensuring sufficient and recognized as the foundation for the optimal
efficient supply to legitimate uses and consumers, management of water supply and distribution
while reducing unnecessary or excess pressures, systems.
14Blended Finance Model to reduce Non-Revenue Water
and energy consumption in Vietnam
PRESSURE MANAGEMENT: REDUCTION OF EXCESS
AVERAGE AND MAXIMUM PRESSURES
CONSERVATION BENEFITS WATER UTILITY BENEFITS CUSTOMER BENEFITS
REDUCTED FLOW RATES REDUCED FREQUENCY OF BURSTS AND LEAKES
Fewer
Reduced
Reduced Deferred Reduced cost problems
Reduced excess Reduced flow Reduced and repair and Fewer
liability costs renewals and of active on customer
or unwanted rates of leaks more efficient reinstatement customer
and reduced extended leakage plumbing
consumption and bursts use of energy costs, mains, complaints
bad publicity asset life control and
and services
appliances
Figure 1: Benefits of pressure management
The key benefits of pressure management are described in Figure 1. The proven benefits of pressure management
in distribution systems now include not only the benefits for water conservation by reducing leak flows, but also the
benefits for water utility and customer arising from reduced numbers of bursts and leaks. These are, for examples,
reduced repair and reinstatement costs, reduced public liability and adverse publicity, reduced costs of active leakage
control, deferred infrastructure renewals, and extended asset life of mains and service connections. The benefits also
include fewer problems on customer service connections and plumbing systems which leading to fewer customer
complaints.
15Table 8: Problems and benefits for water utilities’ different
modes of operation
PROBLEMS FACING WATER UTILITIES, AND BENEFITS WITH DIFFERENT
MODES OF OPERATION
OPTIMAL PRESSURE
INTERMITTENT
CONTINUOUS SUPPLY: MANAGEMNT:
SUPPLY: (NOT “24/7”
(EXCESS PRESSURE) (DEMAND DRIVEN
OPERATION)
CONTRIBUTION
Leakage flow rates
reduction due to limited High burst frequencies due
10% reduction of average
time of pressurisation. Very to higher than required
pressure produces 10% to
NRW - HIGH LEAKAGE high burst frequencies on maximum pressures for
20$ reduction in annual
COMPONENT mains and services. Big much of the time. High leak
leakage (depends on pipe
risks of contamination flow rates due to higher than
materials and type of leaks)
when the pipes are not required average pressures.
pressurised.
10% reduction of excess
High energy costs for
Excess energy costs due to average pressure produces
pumping as higher flow
ENERGY EFFICIENCY rates are imposed to move
excess pressurisation from around 10% decrease
pumping. in energy costs from
the same volume.
pumping.
10% reduction of average
High manpower costs for
pressure decreases
valving operations. High repair costs
economic intervention
High liability costs
costs of active leakage
High repair costs.
control by 10%.
10% reduction of average
Active leakage control is Hig active leakage control pressure decreases
difficult due to insufficient costs due to higher rate of economic intervation costs
OPERATION AND pressure. rise of unreported leaks. of active leakage control
MAINTENANCE by 10%
Deferred renewals, residual
asset life extension.
Short asset life time due
Short asset life time due to This benefit can be very
to poor operation and
excess pressure. substantial; prediction
pressure transients.
methodology for pressure
reduction being developed.
In conclusion, pressure management is one of the important approaches to improve the operation of water
distribution networks. To obtain the best pressure management, the network pressure must be measured
and the operation of pumping station should be controlled according to these measurements. Luckily, this is
practically possible without the challenges of digging up and replacing pipes.
16Blended Finance Model to reduce Non-Revenue Water
and energy consumption in Vietnam
Assessing saving potential in the existing networks
As described above, there are numerous benefits depends on the fluctuations of external factors
related to pressure management, and the monetary such as demand, changes in water sources used
value of reducing leakages and energy consumption for supply, etc.
can help cover the needed investments to introduce
pressure management to an existing system. But Therefore, an efficient way forward is to validate
how to assess and validate the potential savings is the calculation results for a period of one year
obviously a key question. by comparing with the detailed measurement
assuming no significant changes are made to the
Based on a thorough technical audit of an existing network during this time. Extending the validation
network including pressure measurement, energy period beyond one year significantly increases the
consumption, flow rates, operation history, etc., risk of external factors influencing the performance
it is possible to calculate the performance of an of the optimized system, which makes it impossible
optimized system. However, proving this in practice to meaningfully compare the performance of the
is challenging as the performance of system also optimized system to the existing one.
In terms of energy saving, the performance of the optimized system can be measured as:
Energy saving = Flow in year 1 * Head in year 1
— Energy consumption in year 1
367 * efficiency of replaced pump(s)
In terms of water saving, the measure is as follows
Lekage reduction = Audited leakage — Head in year 1
* Audited leakage
Audited head
After the first year, the system should obviously be operated so it maintains the same head, and thereby
keeps the benefits of pressure management, which is also included in the performancecontract between the
project company and the utility even though it is not used to calculate the specific saving compared to the
first baseline-year.
17Findings from audits in Vietnam
Based on the pressure management approach described above, the saving potential, in terms of water, energy,
and cost for four water networks in Vietnam has been assessed:
1. Tri Phuong Water Plant, Bac Ninh’s Center for Clean Water and Environmental Sanitation;
2. Quang Tri Town Pump Station, Quang Tri Water Supply Joint Stock Company;
3. Quang Tri River Pump Station, Quang Tri Water Supply Joint Stock Company;
4. Ca Giang Water Plant, Binh Hiep Joint Stock Company.
These networks have been chosen to cover different sizes, locations, and technical set-ups to maximize the
learnings for how to structure a financial model. The description of networks and the key findings are shown
in the Table 9 below.
Table 9: Assessment of saving potential for four water networks in Vietnam
Quang Tri Quang Tri
Tri Phuong Ca Giang
Town Pump River Pump
Water Plant Water Plant
Station Station
Flow p.a 3.24m m³ 1.3m m³ n.a 10.3 m³
Leakage rate 26% 28% n.a.* 20%
Electricity cost
0.08 USD 0.07 USD 0.07 USD 0.08 USD
Description (USD/kWh)
Water
production
0.35 USD 0.34 USD n.a.* 0.12 USD
cost (USD/m³
lost)
Water saving
87,301 m³ 20,985 m³ n.a 216,390 m³
p.a.
Energy saving
69,083 kWh 100,981 kWh 235,517 kWh 793,185 kWh
p.a.
Savings Cost saving
p.a. (water 36,082 USD 14,203 USD 16,940 USD 89,422 USD
and energy)1
Costrecovery² Yes Yes n.a.** Yes
1
Additional savings are likely but site specific, including from O&M costs and ability to invoice more water in
a capacity-constrained situation;
2
Based on a 5-year cost-saving agreement between network owner and contractor;
*The water network was found irrelevant for advanced pressure management in its current state and a water
saving thus requires a larger investment in new piping etc.;
** Close call, needs further assessment.
18Blended Finance Model to reduce Non-Revenue Water
and energy consumption in Vietnam
A number of conclusions can be drawn from this assessment:
• The value of water and energy saving is sufficient to repay the needed investments in most cases,
however, water saving is important to help finance the needed investments as the existing electricity
price is relatively low;
• Even in relatively small networks with leakage rates below 30%, there seems to be a business case in
reducing energy consumption and water leakage;
• There seems to be significant economies-of-scale in water intake and treatment based on these exam-
ples, as the production cost of water is much lower for the larger networks.
2. Identification of barriers for
implementing business models in
water sector
According to the feedback from the Vietnamese water sector, some investments have been made in NRW
and energy optimization in the past, but with the diminishing ability to finance capital expenditure (CAPEX)
investments through public finance or ODA. As a result, utilities today are facing a financing challenge.
As shown in the technical findings above, investments can earn back themselves over a few years in some
networks. However, with little or no budget for CAPEX investments and no opportunity for sovereign
guarantees behind soft loans, utilities struggle to finance even low-hanging fruits. In other words, even when
there is a business case in reducing energy consumption and water leakages without the support of grants,
there is still a need to introduce a performance-based business model whereby external private investors can
provide the CAPEX-investments needed. Based on this model, a grant element can then be introduced for
projects where there is no business case (due to the need for larger investments with longer payback-time for
instance).
19Based on our expert interview results, the key barriers for implementing viable business models in
the water sector in Vietnam are identified in Table 10.
Table 10: Key barriers for implementing business models in water sector
The provincial governments are responsible for planning and budgeting for water
infrastructure in their localities. Projects are then implemented via bid for tender.
Finance However, the provincial governments usually do not have the capital, and thus are
depended on the funding from the central government and international grants (the
latter often requires state-backed guarantees, though).
Private Lack of confidence on the sources of future revenue and in regulatory framework
sector to protect the investment. Insufficient incentives to invest in risky and potentially
participation unprofitable ventures, and thus attract fewer investments.
Vietnam has comparatively low prices and tariffs for water-related services, and thus
generates low revenue across the water sector. The water-related services and tariffs
Water tariff
are controlled by the Provincial People Committees. The tariff levels are set to either
levels
politically accepted or affordable for consumers, but not feasible in perspective of
investments.
The Provincial People Committees who oversee water companies’ activities become
minority shareholders which means that they lose ability to manage and monitor the
Equitization water sector. Also, assets in the water sector are slowly sold to private companies and
process the Government has little involvement in decision-making process. Currently most of
investments are based on relationships, and informal contracts are acceptable for the
Vietnamese investors but constrained for the international investors.
The current coordination strategy is sub-sectoral rather than national; hence there
Institutional
is a risk for the water sector not being invested in locations where needed most or
coordination
regulatory actions are not promoting policy objectives
Source: Information collected by authors, 2018
20Blended Finance Model to reduce Non-Revenue Water
and energy consumption in Vietnam
3. Analysis of financial instruments for
investment in water sector
Financing sources in the water sector include both public borrow money from commercial sources and come
finances (governmental funding, grants, etc.) and private up with a weighted cost of borrowing which is a
finances (donors, etc.). However, governmental financing mix of low-cost funding from the Government and
sources have been restricted recently due to other market prices from domestic banks. The purpose of
competing demands such as health care, education, this blended finance model is to keep the cost of
and transportation. Water sector is one of the few borrowing affordable. Currently there are not any
generating revenue streams that the Government owns available public funds for investment in the water
and earns through tariffs. In the context of decreasing sector and that leads to the privatization in the
governmental finances, private sector becomes an water sector. In addition, co-financing options are
obvious source of assistance, where its involvement can usually preferred by the International Development
be in different forms, ranging from the long-term PPP Association (IDA). However, as Vietnam is now
arrangements to service contracts. moving to the International Bank for Reconstruction
and Development term, it means that less ODA is
This also presents opportunities for the water sector to directed to Vietnam and the cost of borrowing is
expand its financing by using any surplus generated to going to be more expensive.
Public private partnership (PPP) model
The new Decree 63/2018/ND-CP (Decree 63) on PPP • Increased minimum equity requirements for
came into effect since 19 June 2018 has introduced a private investors: Under the Decree 63, the
number of major changes to encourage private sector minimum equity requirement for private investors
to invest in PPP projects. The Decree 63 replaces the is 20% for PPP projects with total investment
Decree 15/2015/ND-CP and a number of PPP-related capital up to 1,500 billion VND (equivalent to
articles in the Decree 136/2015/ND-CP (Decree 136). US$ 66 million). For projects with total investment
The key changes of the Decree 63 which highlighted by capital of more than 1,500 billion VND, the equity
KPMG (2018) are summarized below: of private investors must account for at least 20%
• Additional sources of the Government’s capital: for the capital portion of up to 1,500 billion VND
The Decree 63 recognizes the additional means and at least 10% equity for the remaining capital
from the Government to finance PPP projects portion exceeding 1,500 billion VND.
such as infrastructure assets, rights to operate
construction works or provide services. This
gives grants more flexibility to the ministries
and Provincial People Committees to mobilize
resources for PPP projects.
21• Decentralization of public finance: The application of hybrid contracts is under the approval of the
relevant ministries and Provincial People Committees, and the approval from the Prime Minister is not
required. Ministries also provide guidelines for model PPP project contracts in their respective industries.
This aims to increase level of autonomy and accountability of local governments and reduce investment
preparations. Local governments are also required to assess their financing position and implementation
capacity in applying for financing.
Grants vs loans
The pros and cons analysis for grants and loans are presented in Table 11.
Table 11: Grants vs. loans
Grants Loans
Easy to implement and useful for Encourage water companies to apply
undeveloped markets or cases new financing sources which help them
where end products are costly for off the “addiction” of low-cost or no
the country cost borrowings
Reduce costs of borrowings with
Useful if grants are provided with
PROS blended finance option (a mix of public
links to NRW reduction activities
and private finance)
Provide opportunities for water
Help the Government to target public
companies to re-invest in their
money for projects with maximum
operational and maintenance
impacts at poorest areas
structures
High interest rates provided by
commercial banks
Possibilities of having weak
CONS
commitment from water companies Higher rate of tariff closed to cost
recovery level should be charged to
customers
As mentioned earlier, the water tariffs are currently set by the Provincial People Committee based on the
Circulars 75 and 100 provided by the 3 Departments and this does not give security to private companies.
Ideally, the concessional framework should be in place to set water prices nationally. For example, in the
Philippines, the national water tariff is set by the Government which encourages the investment from private
sector (e.g. the Manila Water supported by IFC).
22Blended Finance Model to reduce Non-Revenue Water
and energy consumption in Vietnam
4. Case studies on investment in water
sector in Vietnam
Sawaco — Manila Water
Recognizing the Government’s equitization program is an opportunity for the implementation of PPP
project, Manila Water entered in the 2008 performance-based leakage reduction and management
services contract for SAWACO Zone 1, Ho Chi Minh City. This project includes 835 km of pipe
network and 139,000 connections with high leakage level of 60% before project implementation. As
a result of this project, the volume of water saved was 121,621 m3
/day which are three times of savings more than the project target.
Dong Nai Plastic Water JSC (DNP Water JSC)
International Finance Corporation (IFC) has secured a convertible loan of US$ 15.3 million to DNP
Water JSC with the aim to provide clean water access for urban households. IFC investment is used
to fund the construction of new bulk water treatment plants and the acquisition of privatized water
supply companies. The financing package may increase to US$ 24.9 million to support further growth
of the company (Vietnam Investment Review, 2018).
5. Recommendation for blended
finance model
In order to implement a viable finance model for • Equitization of the water sector – public
promoting investment in the water sector, there are influence on investment decisions and
key barriers need to be overcome as described earlier: execution diminishing;
• Lack of finance – dependence on public or • Financial standing of water utilities do not allow
donor funding which can be burdensome; them to borrow funds from commercial bank to
• Limited precedence for private financing in invest in financially and environmentally sound
the water sector due to unclear regulatory projects.
framework in some cases;
• Relatively low water tariffs which generate
small revenues and discourage investments
from private sector;
23There are also other aspects that a finance model should take into account in order to make it applicable as
the following:
• Minimum administrative burden and simplicity: • High leverage and maximum impact: The
The finance model should minimize the finance model should ensure the highest
burdensome bureaucratic processes that could possible leverage of donor funding by only
discourage water utilities and technology providing support at the level that utilities
providers from using the model. All utilities, and contractors can establish a business
irrespective of their in-house capacities, should case. That would maximize impact by making
be able to utilize the finance model, which calls room for more investments.
for some level of standardization. • Adjustable to fit all: Where there is a
• Project bundling: Private investors look for willingness for the investment, the finance
investments of a certain size in order to reduce model should be developed in the way that
administration and spread risks. However, for can bridge the financial gap regardless of the
projects with a relatively limited investment network size to ensure that water losses could
size (focus on optimizing and modifying existing be avoided in all types of network.
infrastructure), investments may only be made • Scalability/replicability: The finance model
if more projects are bundled. should be developed in the way that it
• Getting the incentives right for all involved could potentially be scaled and replicated in
stakeholders: The finance model should other types of investments, sectors and/or
address the different relevant criteria that are countries where blended finance is required
of importance for all stakeholders involved, to ensure commercial viability.
i.e. how to ensure a viable business case for
project company, in terms of return and risk,
when providing a project with the best possible
impact; how to ensure that the utilities benefit
from the investment from the beginning to
incentivize the successful implementation and
repayment; how to ensure the alignment with
donor policies and requirements?
24Blended Finance Model to reduce Non-Revenue Water
and energy consumption in Vietnam
Based on the above analyses, the research team recommends the blended finance model as
illustrated in Figure 2.
Figure 2: Recommended blended finance model
25The roles of different stakeholders in this blended finance model are described as the following::
Project company (Contracting company)
A project company is set up between a technology The idea of the performance-based contract in
provider and a development finance institution (DFI) this case is to contract a private company (project
or investor. These partners share the risk on the company) to implement the NRW reduction
project, e.g. the customer’s ability to pay and the program, and the company is paid not only for
performance of the solution provided. In some cases, services rendered but also for meeting contractually
the experienced DFI could also bring the knowhow enforced operational performance measures.
and credibility to the partnership. The project company Throughout the year 1, the performance of the
develops the project and enters into a performance- system is measured and compared to the utility’s
based contract with the water utility(-ies) for providing old system to determine the savings achieved. The
equipment and services with the overall purpose of utility then pays a predetermined percentage of
reducing water loss and energy consumption in water these annual savings to the project company for the
utilities. There is little or no upfront payment, but duration of the contract.
the utility is obligated to pay for the equipment and
services rendered over a pre-defined period (could be 5 According to the findings presented above, there
years). To some extents, this can be compared to a loan seems to be opportunities to repay investments
from the project company to the utility with a x-year with the savings achieved in water networks of
tenor. The utility’s ability to pay does not come from different sizes as long as the conditions are suitable
the budget allocated, however, from part of the savings for pressure management. This can be done in many
achieved through the implementation of the more different ways and business models and will not
advanced technology as well as efficient operation and need a grant – i.e. the right side of Figure 2 will be
management.The concept of the performance-based irrelevant.
contract is illustrated in Figure 3.
26Blended Finance Model to reduce Non-Revenue Water
and energy consumption in Vietnam
Figure 3: Concept of performance-based contract
However, this will not be the case for all networks – especially if the conditions are not suitable for pressure
management and larger investments are needed for piping etc. The administrative processes for acquiring
public or donor funding are typically complicated and slow at present. With the equitization process in the
water sector in Vietnam, the utilities can no longer rely on public funding. However, with a longer time
horizon and/or from a sustainability perspective, the investments could be justified. In this case, to make the
investment viable for project company and water utility, a grant or donor funding is needed to fill the financial
gap as discussed below.
27Grant/donor funding
The purpose of the grant is to bridge the financial that the leverage of donor’s funding is maximized.
gap between the water utility’s ability to pay and The size of the grant will vary depending on the
the minimum required profit margin of the project network size, the magnitude of potential savings,
company. The primary beneficiary of the grant is the and the other characteristics. To ease and simplify
utility who will get access to finance for investments the administration, categories for project should
in sustainable/advanced technologies and knowhow be established and specific grant levels should be
that they would otherwise not be able to acquire. tailored for each category.
And they would have to pay a reduced price for the
equipment and services equal to the grant compared to In order to get the funding from donor, there
the normal competitive pricing. The project company are typically several requirements for relevant
will benefit indirectly as the pool of potential projects stakeholders, e.g. reporting on results (energy/water
where they can ensure an acceptable increased return savings) achieved and money spent. Providing this
from their investment. A threshold for the acceptable information would be the responsibility of the project
return from investment should be established to company, possibly in collaboration with the utility.
ensure that donor’s funding is not utilized to maximize This set-up would help to reduce the burden for the
the profit of the project company. This will also ensure utility who, in some cases, might have limited capacity
28Blended Finance Model to reduce Non-Revenue Water
and energy consumption in Vietnam
Administrative body (ADMIN)
The grant from international donor(s) or the and simplify the approval processes for the project
government/province is provided through an company (and local utility) to acquire the grant.
administrative body (ADMIN), a not-for-profit
entity established and capitalized by donors and In the start-up phase, ADMIN could be a donor
other interested stakeholders, e.g. local sponsors, representative/consultant or other simple set-up
technology providers, or others. ADMIN would handle until the initiative proceeds to a more mature stage.
the administrative work related to channel of funds, However, it represents the possibility for scale-up
ensure good governance and accountability, proper to different sectors/investment types, technology
and timely reporting to donors based on information providers, donors/investors, and potentially other
provided by the project company. ADMIN would countries.
channel the funds received from donor(s) to the
project company based on an assessment of the The approach suggested here can be seen as a
needed subsidy to create a viable business case. As bottom-up approach where project developer does
the individual investments might be rather small (from not sit with the government or donors, however,
donor perspective), ADMIN could pool projects and the project company (or several competing project
handle the needed documentation requirements companies) finds the best possible way forward
and approval processes of donors. ADMIN would knowing what kind of public support is available.
work directly with the project company to follow-up In this case, this approach is similar to the support
the performance, outcomes and impacts achieved, models for renewable energy development in many
and report back to donors according to the agreed countries, where project private developers initiate
procedures and requirements. ADMIN could make projects knowing the level of feed-in-tariff or other
the wellestablished procedures and guidelines to ease kinds of financial support.
29You can also read