SOK: YIELD AGGREGATORS IN DEFI
←
→
Page content transcription
If your browser does not render page correctly, please read the page content below
SoK: Yield Aggregators in DeFi

                                                            Simon Cousaert1 , Jiahua Xu1 , and Toshiko Matsui2
                                                                    1
                                                                        UCL Centre for Blockchain Technologies
                                                                            2
                                                                              Imperial College London
arXiv:2105.13891v3 [q-fin.PM] 14 Sep 2021

                                                    Abstract. Yield farming has been an immensely popular activity for
                                                    cryptocurrency holders since the explosion of Decentralized Finance (DeFi)
                                                    in the summer of 2020. In this Systematization of Knowledge (SoK), we
                                                    study a general framework for yield farming strategies with empirical
                                                    analysis. First, we summarize the fundamentals of yield farming by fo-
                                                    cusing on the protocols and tokens used by aggregators. We then ex-
                                                    amine the sources of yield and translate those into three example yield
                                                    farming strategies, followed by the simulations of yield farming perfor-
                                                    mance, based on these strategies. We further compare four major yield
                                                    aggregrators—Idle, Pickle, Harvest and Yearn—in the ecosystem, along
                                                    with brief introductions of others. We systematize their strategies and
                                                    revenue models, and conduct an empirical analysis with on-chain data
                                                    from example vaults, to find a plausible connection between data anoma-
                                                    lies and historical events. Finally, we discuss the benefits and risks of yield
                                                    aggregators.

                                                    Keywords: DeFi, decentralized finance, yield aggregator, yield farming,
                                                    protocols, pools, strategies, simulation

                                            1     Introduction

                                            1.1    Background
                                            Decentralized Finance (DeFi) is on a serious rise during the past year. In March
                                            2020, the total value locked in DeFi protocols was around 600m USD [12]. That
                                            number exploded in the year coming, kick-started by the so-called “Defi Sum-
                                            mer” where the Total Value Locked (TVL) reached around 11bn USD by the
                                            end of September. At the time of writing3 , TVL numbers have reached more
                                            than 120bn USD on Ethereum alone. Apart from the non-custodial aspect, the
                                            permissionless nature and the openly auditable protocols, a main driver for the
                                            growth of this industry is the composability of financial services. The so-called
                                            “DeFi Stack” or “Money Legos” allow protocols to build and combine func-
                                            tionalities, without the need of having this expertise in-house. This means that
                                            developers can focus on the core business, knowing that key infrastructure is
                                            readily available. The result has been an explosion of innovation.
                                                One of the applications that has come from the above-described movement is
                                            “yield farming”, where investors passively earn yield by transferring tokens to a
                                            3
                                                5 September, 2021
2 C. Simon et al. wide range of yield generating smart contracts. The concept, first introduced by Synthetix [55], started to gain traction on 15 June 2020 [30] with the introduction of COMP. COMP is the governance token of Compound, one of the major DeFi lending protocols. Compound participants get rewarded with newly-minted COMP tokens through both lending and borrowing activities, a process termed “liquidity mining”. Thus, on top of the usual benefit that users get for providing liquidity in different kinds of pools (e.g. interest in the case of lending protocols, or fees in the case of providing liquidity in Automated Market Making (AMM) pools), additional governance tokens are rewarded to users to further encourage their participation in the issuing platform during the early stage of adoption. The basic yield farming idea was born: the search for opportunities in the DeFi ecosystem to squeeze out as much yield as possible across many products, in all its shapes, allowed by tokenizing positions on base assets. As a reaction to the creation of a multitude of platforms returning interests, fees and token rewards, yield aggregators built on top of the DeFi primitives came into existence. 1.2 Contribution This paper presents a systemic analysis of the parts and mechanics behind yield aggregation strategies. We identify the risks of yield farming strategies and the sources of yield. Based on an inspection of the implementation of four major yield aggregator protocols—Idle Finance [27], Pickle Finance [43], Harvest Finance [22] and Yearn Finance [59]—we synthesize a model of the typical workflow in a yield farming strategy. Based on this workflow and three frequently adopted strategies, we simulate the wealth of a yield aggregator in a controlled market environment. Finally, major yield farming protocols are compared against each other on both theoretical and empirical grounds. 2 Fundamentals of yield farming A yield aggregator is a set of smart contracts (called a ‘protocol’) that pools investors’ funds, and reinvests them in an array of yield-producing products or services through interacting with their respective protocols (see 2.2). The process of generating yield and increasing the value of pooled funds is termed “yield farming”, and yield aggregator users are thus also known as “yield farmers”. In essence, a yield aggregator can be deemed as a smart contract-based fund manager, whose investment strategies are pre-programmed and automatically executed. 2.1 Yield Yield, defined as “the total amount of profit or income produced from a business or investment” [7], is often measured in terms of Annual Percentage Yield (APY). Yield is the ultimate goal pursued by farmers, and typically originates from borrowing demand, liquidity mining, as well as revenue sharing (Figure 1).
SoK: Yield Aggregators in DeFi          3

Borrowing demand As the demand Borrowing                                         Revenue
for loans in crypto assets grows, the bor- demand cToken               Uniswap sharing
                                                    (Compound)        LP tokens
rowing interest rate increases, leading to
                                                                          Sushiswap
higher yields for lenders. Particularly in          aToken                LP tokens
                                                    (Aave)
a bullish market, speculators are keen to                              VSP

borrow funds despite a high interest rate,                             SUSHI

in expectation of an appreciation in the                        CRV
                                                                      UNI
assets of their leveraged long position [58].                COMP
Compound and Aave, two major DeFi
                                                           Liquidity mining
lending protocols (see Section 2.2), have
witnessed the borrow APY of USDC rising              Fig. 1: Yield sources
from 2-3% in May 2020 to as high as 10%
in April 2021.4 This specific kind of yield
is incorporated in interest-bearing tokens, such as cTokens from Compound or
aTokens from Aave.

Liquidity mining Another yield source comes from liquidity mining pro-
grams, where early participants receive native tokens representing protocol own-
ership. This incentivizes people to contribute funds into the protocol, and en-
hances decentralization as the protocol ownership is distributed to users. The
native tokens often have a governance functionality attached to them which is
deemed valuable, as the token holders have a say in the future strategic direc-
tion of the project. Native tokens sometimes also entitle holders to a share of
the protocol revenue (see the below).

Revenue sharing Some tokens entitle users to part of the revenue that is
going through the protocol. These can be governance tokens or other kinds of
tokens. One example is the liquidity provider tokens in AMM-based DEXs [57].
By supplying liquidity into an AMM pool, users receive the fees that are paid by
traders within that pool. The higher the volume in that pool, the more fees that
are generated, and the more a liquidity provider profits from this. In Uniswap
[51], a 0.3% fee is charged for every trade within a pool and goes fully to LPs.

    This brings up a second kind of revenue-sharing token, where users have to
actively stake their tokens to receive a share of the revenue. For example, SUSHI
holders that stake their SUSHI will get xSUSHI in return, which represents the
proportional share of a pool that captures 0.05% of all trades on Sushiswap
[47]. Vesper Finance’s governance token, VSP, can also be deposited in a pool,
in return for vVSP, a token that represents the user’s proportional share of a
pool that captures part of the revenue generated throughout the whole Vesper
platform [53].

4
    https://app.defiscore.io/assets/usdc
4 C. Simon et al. 2.2 Related protocols Yield farming relies on other building blocks in the DeFi stack. In this section, we outline the essential types of protocols that are used within yield farming strategies and shortly explain the mechanics behind them. Lending platforms Lending platforms enable lending and borrowing of on- chain assets, with the interest rate set programmatically by a smart contract [17]. On these platforms, funds are pooled together to be borrowed by other users that want to take out a loan in a specific asset. Suppliers of loanable funds receive interest over time, borrowers pay interest. Generally speaking, interest in a given market is accrued through market-specific, interest-bearing derivative tokens [39]. The most prominent lending platforms are Aave [1], Compound [9] and dYdX [14]. Automated Market Makers (AMM) AMMs provide liquidity algorithmi- cally by pooling funds and determining asset prices via a so-called conservation function. In a liquidity pool, reserves of two or more assets are locked into a smart contract. There are two core actors involved in the general mechanism of AMMs. First, there are the liquidity providers, who add funds to the asset pool. In return, they receive liquidity provider (LP) tokens proportionate to their liq- uidity contribution as a fraction of the entire pool. Generally, these LP tokens can be redeemed anytime the liquidity provider wants to get his funds back. The second core actors are the traders, who swap an input asset (what to be spent) for an output asset (what to be received). The exchange rate between the assets is deterministic, depending on the size of the pool and the desired amount to be traded. The most prominent AMMs are Uniswap [51], Balancer [3], Curve [10] and Bancor [4]. Other Next to lending platforms and AMMs, which are the backbone of DeFi, other protocols can offer yield in their own way. This can be through the products they offer, or through liquidity mining programs. Examples of yield offering products that are neither lending platforms, nor AMMs, are Synthethix [48], Lido [31] and Pooltogether [44]. 2.3 Tokens While the protocols in Section 2.2 are smart contracts that pragmatically define the mechanisms behind the concept, tokens are smart contracts that generally follow a standard token interface, representing assets, synthetic assets or deriva- tives [56]. In this section, we discuss the most important tokens in yield farming. Stablecoins Stablecoins are cryptocurrencies that attempt to offer price sta- bility. They are designed to have a stable price with respect to some reference point [37], being another cryptocurrency, fiat money, or even commodities. To- day’s biggest stablecoins, USDT, USDC and BUSD are all pegged to the US Dollar. Stablecoins can be non-custodial or custodial, asset-backed or algorithmically programmed. For a more thorough discussion on stablecoin design, we direct the
SoK: Yield Aggregators in DeFi        5

reader to [29]. The characteristic of potential lower volatility compared to tra-
ditional cryptocurrencies, makes stablecoins a desirable class of assets for yield
farming.
Lending platform interest-bearing tokens As discussed in Section 2.2,
when lenders supply funds in a market pool, they receive interest-bearing tokens
that represent the lender’s share in the pool. Over time, borrowers pay interest
that flows into the pool, increasing the value of the lender’s relative share. This
mechanism ensures that accrued interest in a market is paid out to the fund
providers. Examples of lending platform interest-bearing tokens are aTokens by
Aave and cTokens by Compound.
AMM liquidity provider (LP) tokens Whenever liquidity is deposited into
a pool, liquidity tokens are minted and sent to the liquidity provider. Similar
to interest-bearing tokens in sending platforms, AMM liquidity tokens represent
a proportional share of the pool and the same mint and burn mechanisms are
applied to keep track of liquidity. One key difference is that there are no borrow-
ers, but traders, who pay a fee each time they do a trade. For example, Uniswap
charges a 0.3% fee. Every time a user swaps an asset in a certain pool, 0.3% of
the purchased amount is retained to the pool and thus distributed pro-rata to
all liquidity providers. Sushiswap charges a slightly lower fee of 0.25%.
Native/Governance tokens Liquidity mining is a big part of yield farm-
ing strategies. DeFi projects are in need of liquidity as it signals trust within
the community. Both early and more mature projects therefore launch liquidity
mining programs, incentivizing users to supply liquidity into the protocols of
the project (see 2.1). These incentives often are governance tokens, which enti-
tle holders to shape the future of a protocol. These rewards typically form an
attractive source of yield and it encourages yield farmers to look for the most
attractive strategies in both the short and long term [6]. Examples of governance
tokens as part of a liquidity mining program are COMP from Compound, UNI from
Uniswap, SUSHI from Sushiswap and YFI from Yearn Finance.

3     Yield Farming Strategies
A yield farming strategy is made of a specific set of actions through modular
smart contracts that automates the yield farming process. One pool (also called
“vault” or other names) commonly employs only a single strategy, but more
recent developments allow for multiple strategies within one asset pool, such as
the Yearn v2 vaults discussed in 4.4.

3.1   Pool workflow
A typical yield aggregator pool workflow has three to four phases, depending
on the specific protocol. Figure 2 visualizes the typical workflow within yield
aggregator pools. Note that the steps in this figure are not necessarily sequential,
but can happen in random order once the pool has been bootstrapped.
6                                   C. Simon et al.

                     User

                 Deposit Withdraw
                                                                   Phase22    Claim
                                                                  Phase
                                      Deploy (borrowed) capital Phase
                                                                         -2 generated
                                                                                        Phase 3
                                                                     - -       yield
                   Phase 0                                         Strategy
                                                                  Strategy                  -
                        -      Deposit     Phase 1              Strategy
                                                                  Execution
                                                                 Execution              Re-invest
                                                        Repay Execution
                               collateral       -
                  Pool funding
                                          Collateralize  loan
                               Redeem
                                 collateral

                                               Sell yield for pool asset

                              Fig. 2: Stylized yield aggregator mechanism

Phase 0 In this phase, a yield farming strategy is proposed, created and deployed on
        the blockchain. In more centralized protocols, only internal developers can cre-
        ate strategies; more decentralized protocols also allow other stakeholders such
        as farmers, to have a vote in strategy implementation. Upon approval of the
        strategy—either by the protocol development team, or through a decentralized
        governed voting mechanism, a pool is deployed in order to collect and disperse
        funds. From that moment, yield farmers can deposit funds into the pool or
        withdraw from it. By depositing funds, farmers receive pool shares in forms of
        “liquidity tokens”. By withdrawing funds, they surrender those liquidity tokens
        to redeem funds proportionate to their shares.
Phase 1 In this phase, the funds pooled in Phase 0 are used as collateral to borrow an-
        other asset through lending platforms like Maker [34], Aave [1] or Compound [9].
        The purpose of this phase is to turn miscellaneous assets collected from farm-
        ers into another asset, typically a stablecoin, to prepare for strategy execution
        in Phase 2. Naturally, this phase can be skipped, if the pooled asset already
        satisfies the asset type requirement. For example, if the strategy only accepts
        DAI—a stablecoin pegged to USD—as the deployable capital, then funds in ETH
        and WBTC pools need be deposited to a lending platform (see 2.2) as collateral
        to borrow DAI first before proceeding to Phase 2.
              A critical aspect in this stage is collateral management to avoid liquidation
          (see 5.2) of deposited assets. The yield aggregator manages the collateral risk
          level by directing the flow of funds between smart contracts used in Phase 0
          and Phase 1.
Phase 2 In this phase, funds from Phase 0 and/or Phase 1 are deployed to generate
        yield, by following the pre-programmed strategy (for examples see 3.2). The
        output of Phase 2 is the generated yield. Figure 3 shows how a single strat-
        egy typically works. “Static” assets such as USDC and WETH, represented by red
        coins, constitute the value-denominating underlying of yield-bearing assets such
        as cUSDC and aWETH (see Figure 1), which are represented by green coins. De-
        pending on the pool, assets that are supplied can already be yield-bearing, such
        as LP tokens. These kinds of pools typically skip Phase 1. Note that it is also
SoK: Yield Aggregators in DeFi 7
possible for borrowed assets to flow back to Phase 1, in order to pay back part
of the loan in case of a relatively big fund withdrawal from the original pool.
Phase 3 The goal of Phase 3 is to get the generated yield back to the original fund.
Depending on which assets constitute the yield, they can be exchanged on a
DEX for the original asset and returned to Phase 0, or deposited in Phase 1 as
collateral to borrow more deployable capital, or, when acceptable to the strategy,
reinvested directly in Phase 2. Phase 3 can be triggered after a certain time, or
after a specific smart contract function from which the previous phases is called.
It is executed either automatically or manually, depending on the aggregator
[36] [23].
Phase II - Single strategy
Deployed Static Yield-bearing
Capital assets Invest assets Generate
through SC yield
Yield
- USDC
- aTokens
- ETH
- cTokens
- LINK
- LP tokens
- ...
- ...
Fig. 3: Execution process of a single strategy. SC = Smart Contract
3.2 Common strategies
In this section, we describe three common yield farming strategies: simple lend-
ing, leveraged borrow, and liquidity provision, with illustrations of their mech-
anisms (Figure 4). We additionally simulate the expected performance of each
strategy in a controlled, parameterized environment, by tracking the trajectory
of the total value W of the yield aggregator.5
Assumptions On comparing the three common strategies, for simple demon-
stration purposes without loss of generality, we make the following assumptions:
1. the transaction cost is neglected;
2. the value of the yield aggregator Wt is measured in DAI; at t = 0, the
aggregator contains 1 DAI’s worth of funds, i.e., W0 = 1;
3. the aggregator supplies all funds in the pool to a yield-generating protocol—
either a lending platform or an AMM, and the funds represent 1% of the
protocol’s total assets held at t = 0;
4. the yield-generating protocol—either a lending platform or an AMM—distributes
0.01 governance token per day to its users proportionately to their stake in
the protocol:
a. for a lending platform, half of the governance tokens are distributed to
lenders proportionate to their deposits, and half to borrowers propor-
tionate to their loans,
5
The code repository can be found here.8 C. Simon et al.
b. for an AMM, the governance tokens are distributed proportionately to
LPs;
5. the governance token price remains constant during the simulation period;
6. the lending platform has a fixed borrow APY of 10% and a collateral factor
of 80%, meaning for each DAI deposited, the depositor is allowed to take 0.8
DAI’s worth of loan; at t = 0, 70% of the funds in the lending platform pool
is lent out, and all other market participants’ additional borrow and repay,
as well as deposit and withdraw cancel each other out on an aggregate level
during the simulated period;
7. the AMM has a fixed exchange fee of 5% and applies a Uniswap-like constant-
product conservation function;6 the fee is charged by retaining 5% of the
theoretical fee-free purchase quantity within the AMM pool.
Mechanism and simulation results
Simple lending With this strategy, the aggregator earns yield through lending
interest and governance tokens distributed by the lending platform (Figure 4a).
In our simulated en-
vironment, at t = 0 the
yield aggregator deposits Lending Generate interest
Interest
Platform + Native token
1 DAI to a lending plat- Deployed
Capital
+ Native
token
Interest-
Stable
form, and receives in re- coin
bearing
stablecoin
turn some interest-DAI (a) Simple lending
as a certificate of de- Supply in lending Net interest +
Native token Interest
posit. According to As- Deployed platform
+ Native
Capital
token
sumption 3., the aggrega- Stablecoin Stablecoin
tor owns 1% of the to- Borrow in
lending platform
tal circulating supply of
interest-DAI.
The interest-DAI hold- (b) Leveraged borrow
ing of the aggregator is
worth exactly 1 DAI at Static
assets Provide
Yield-bearing
assets Generate trading
t = 0, and increases in Deployed
Capital
Liquidity fees + Native token Native
token
value due to interest ac- Stable
LP Token
crued with the passage of coin
time. In addition, the ag- (c) Liquidity provision
gregator is rewarded with
the lending platform gov- Fig. 4: Classic Yield Aggregator strategies
ernance tokens owing to
its contribution to the
lending platform, and the value of the governance token holding is counted to-
wards the total value of the aggregator.
The simple lending strategy is a low-risk one, and losses usually do not occur.
Figure 5a shows that the value held by the aggregator Wt is floored at 1 DAI,
6
We refer the reader to [2] for detailed description and analyses on AMMs with
constant-product conservation function.SoK: Yield Aggregators in DeFi 9
with the worst-case scenario when the lending APY is 0 and the governance
token distributed by the PFL has 0 value. Intuitively, Wt increases with lending
APY and governance token price.
Leveraged borrow According to Assumption 4.a and in line with practices of
major lending platforms such as Compound [9], governance tokens are rewarded
to both lenders and borrowers. The leveraged borrow strategy thus aims to
maximize the amount of governance tokens received by the lending platform
through leveraging spirals (Figure 4b).
In our simulated environment, at t = 0 the yield aggregator first deposits 1
DAI to a lending platform; with this initial deposit as collateral, the aggregator
then takes a loan worth 70% of its deposit, i.e. 0.7 DAI. To further augment its
deposit and borrow amount for the entitlement of larger rewards, the aggregator
re-deposits the borrowed funds, and use them as collateral to borrow again 70%
of the new deposit; and so on and so forth. Obviously, the more spirals the
aggregator undertakes, the higher shares it holds at both the lending and the
borrowing sides of the lending platform.
As an asset’s
borrow APY al-
ways exceeds its governance token price: 0 DAI governance token price: 1 DAI governance token price: 2 DAI
Yield farming pool value
Yield farming pool value
Yield farming pool value
1.4 Lending APY 1.4 Lending APY 1.4 Lending APY
1.3 0 1.3 0 1.3 0
lending APY, the 1.2
0.03
0.08 1.2
0.03
0.08 1.2
0.03
0.08
1.1 1.1 1.1
aggregator’s loan 1.0 1.0 1.0
0.9 0.9 0.9
accrues interest ex- 0 50 100 150 200 250 300 350 0 50 100 150 200 250 300 350 0 50 100 150 200 250 300 350
Day t Day t Day t
ponentially faster (a) Simple lending
than its deposit. governance token price: 0 DAI governance token price: 1 DAI governance token price: 2 DAI
Yield farming pool value
Yield farming pool value
Yield farming pool value
1.4 number of spirals 1.4 number of spirals 1.4 number of spirals
0 0 0
Assume a borrow 1.3
1.2
2
8
1.3
1.2
2
8
1.3
1.2
2
8
APY of 10% (as 1.1 1.1 1.1
1.0 1.0 1.0
per Assumption 6.) 0.9 0.9 0.9
0 50 100 150 200 250 300 350 0 50 100 150 200 250 300 350 0 50 100 150 200 250 300 350
Day t Day t Day t
and a supply APY (b) Leveraged borrow
of 3%, we observe governance token price: 0 DAI governance token price: 1 DAI governance token price: 2 DAI
Yield farming pool value
Yield farming pool value
Yield farming pool value
1.4 volume (buy, sell) 1.4 volume (buy, sell) 1.4 volume (buy, sell)
from Figure 4b that 1.3 (0, 0) 1.3 (0, 0) 1.3 (0, 0)
(45, 55) (45, 55) (45, 55)
1.2 (50, 50) 1.2 (50, 50) 1.2 (50, 50)
(55, 45) (55, 45) (55, 45)
sufficiently valuable 1.1
1.0
1.1
1.0
1.1
1.0
governance tokens 0.9
0 50 100 150 200 250 300 350
0.9
0 50 100 150 200 250 300 350
0.9
0 50 100 150 200 250 300 350
Day t Day t Day t
can make the strat- (c) Liquidity provision
egy profitable, but
losses occur when Fig. 5: Simulation results
the value of the
governance tokens
received is insufficient to offset the negative net interest revenue. In addition,
a high degree of leverage, measured by the number of spirals, can amplify both
the profit—in case of high-value governance tokens, as well as the loss—in case
of low-value governance tokens.
Liquidity provision With this strategy, the aggregator supplies funds to an
AMM in order to profit from both trading fees and governance tokens rewarded
by the AMM (Figure 4c).10 C. Simon et al.
In our simulated environment, at t = 0 the aggregator deposits 1 DAI’s
worth of funds in the DAI-ETH pool of an AMM, and receives in return some
DAI-ETH-LP tokens, representing its share in the AMM pool. According to As-
sumption 3., the aggregator owns 1% of the total circulating supply of DAI-ETH-LP.
Given that DAI is the denominating asset (Assumption 2.), and that the DAI-ETH
pool applies a constant-product conservation function (Assumption 7.), the DAI-ETH
pool always contains DAI and ETH with equivalent value, and the total pool value
thus equals twice the DAI quantity in the pool.7
We additionally assume that, on an aggregate level, further liquidity provi-
sion and withdrawal cancel each other out. Hence, the aggregator’s ownership
of the AMM pool is neither diluted nor concentrated; that is, the value of the
aggregator’s DAI-ETH-LP holding remains 1% of the DAI-ETH pool’s value. Nat-
urally, all other things equal, the value held by the aggregator increases with the
value of the AMM governance token.
We further test scenarios with different market movements. Specifically, we
illustrate in Figure 5c when during the entire simulation period (i) there is 0
trading volume (blue line), (ii) the buy and sell volume of ETH is respectively
45 DAI and 55 DAI (orange line), (iii) the buy and sell volume of ETH is each 50
DAI (green line), (iv) the buy and sell volume of ETH is respectively 55 DAI and
45 DAI (orange line). We assume that the trading volume is evenly spread out
throughout the simulation period.
Absent any trading activity—as in Scenario (i), the aggregator’s yield solely
comes from governance token reward. The yield difference between Scenarios (i)
and (iii) lies in the trading fee. By comparing the blue line and the green line
in Figure 5c, we clearly see that (iii) results in higher yield with the presence of
5% trading fee.
Scenario (ii) describes a market situation with higher selling pressure and
consequently falling ETH prices. The leads to an increase in the quantity of the
depreciated ETH and a decrease in the quantity of the denominating asset DAI
in the AMM pool, diminishing the AMM pool’s value. When the trading fee
revenue and governance token reward are insufficient to offset this value loss,
the yield would be negative.
In contrast to Scenario (ii), Scenario (iv) describes an opposite market situ-
ation where a higher demand in ETH drives up its price. The leads to a decrease
in the quantity of the appreciated ETH and an increase in the quantity of the
denominating asset DAI in the AMM pool, raising the AMM pool’s value.
Note that in both Scenarios (ii) and (iv), liquidity providers suffer from di-
vergence loss [57], that is, they could have been better off by just holding their
DAI and ETH, as opposed to supplying them to the AMM pool.
The simulation shows that the liquidity provision strategy also entails risk,
associated with market movements of the assets within the AMM pool. Higher
volatility of the AMM pool assets implies higher uncertainty in yield.
7
We refer the reader to [57] for a formal derivation on the pool value of a constant-
product AMM.SoK: Yield Aggregators in DeFi 11
Summary There is no free lunch—the same applies to yield farming. In this
section, we demonstrate that investment strategies with the potential to generate
remarkably high yield also bear high risks. While our simulation only illustrate
return courses in a deterministic fashion, through various simulated scenarios
one can easily extrapolate that the ever-changing market conditions—including
volatile price movements and trading activities—lead to return instability, and
sometimes even losses. We discuss risks further in Section 5.2.
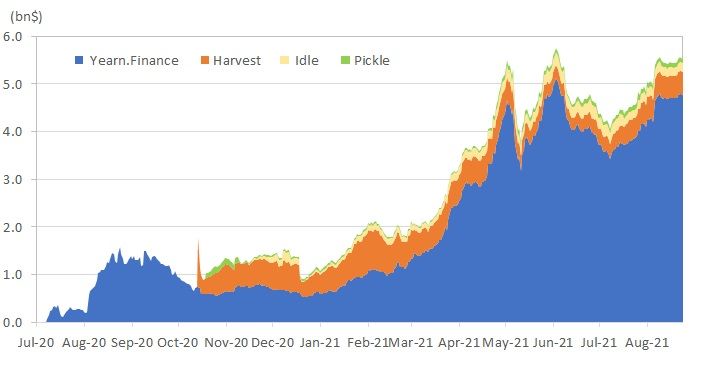
4 Major yield aggregators in DeFi
Figure 6 charts the evolution
of total value locked (TVL)
for major protocols since July
2020. To date, yield aggregators
have collected billions of dollars
worth of liquidity. This section
compares four major yield ag-
gregator protocols with a focus
on strategies, performance and
fee mechanism.
Table 1 shows the character-
istics of the major protocols and
Fig. 6: Total value locked (bn$).
a few more. The data was col- Data collected from https://defillama.com/home - Assets.
lected on 5 September 2021.
Table 1: Overview of major existing Yield Aggregators
Phase 0 Phase 2
Supported Pool Assets Strategies
Protocol Single LP Multiple SL1 LB2 LP3 Pool # of Gov. MCap* TVL Token
Asset Token Assets name pools token (mm$) (mm$) holders
Idle Finance [25] # # # # Pool 10 IDLE 118.3 187.8 3,595
Pickle Finance [42] # # # # pJar 19 PICKLE 19.1 101.9 6,799
Harvest Finance [20] # # Vault 53 FARM 168.3 481.1 10,142
Yearn Vaults [60] # Vault 50 YFI 1,520.8 4,787.7 40,089
Vesper [52] # # # # Grow Pool 4 VSP 136.0 439.8 5,996
Rari Capital Earn [46] # # # Pool 3 RGT 157.5 196.9 9,559
Data fetched on 5 September 2021. In phase 0, some protocols only accept single assets, others accept LP tokens
and others accept more than one ERC20 token. Some protocols provide more than one category of vaults. In phase
1, some protocols focus on lending strategies, other focus on leveraged borrowing or liquidity provision strategies.
Some protocols employ multiple strategy groups.
1 = Simple Lending, 2 = Leveraged Borrowing, 3 = Liquidity provision
* Fully diluted market cap - theoretical market cap which is calculated by assuming all the tokens were already in
circulating supply.
4.1 Idle Finance
Launched in August 2019, Idle is a yield aggregator that automatically allocates
and aggregates interest-bearing tokens [26].12 C. Simon et al.
Strategies Idle Finance only distributes single-asset pools over different lend-
ing protocols. In Phase 0, users’ funds are pooled together and depending on
the strategy that the pool employs, assets are allocated over different lending
platforms, currently8 limited to: Compound, Fulcrum, Aave, DyDx and Maker
DSR. There is no need for Phase 1 in Idle Finance, as the currently supported
pools can be deposited directly into the above lending platforms. When any user
interacts with Idle or if no interactions are made for 1 hour, rebalancing of the
assets takes place according to the rates of supported providers.
Currently, Idle uses two different allocation strategies:
– Best-Yield: this strategy seeks the best interest rates across multiple lending
protocols.
– Risk-Adjusted: this strategy automatically changes the asset pool allocation
in order to find an allocation with the highest risk-return score, compared
to the highest return score of the “Best Yield” strategy. It does this by
incorporating a framework for quantifying risk, developed by DeFiScore [13],
which outputs a 0-10 score that represents the level of risk on a specific
lending platform (0 = highest risk, 10 = lowest risk).
Return for users Idle uses IdleTokens to represent the farmers’ proportional
ownership of the asset pool, which should accrue yield over time. In addition,
farmers are rewarded with IDLE governance tokens for participating in the pools
as part of Idle’s liquidity mining program. In January 2021, a two-year liquidity
mining program started to reward liquidity providers depending on the amount
of funds deposited and the utility generated by a certain pool [24].
Protocol fees A performance fee 10% of the generated yield is charged.
4.2 Pickle Finance
Launched in September 2020, Pickle offers yield on deposits through two prod-
ucts: Pickle Jars (pJar) and Pickle Farms. Jars are yield farming robots, earning
returns on users’ funds, while farms are liquidity mining pools where users can
earn PICKLE governance tokens by staking different kinds of assets. Proportional
shares in pJars are represented by pTokens.
Strategies Each Pickle Jar employs a specific strategy to earn yield. Cur-
rently, two main versions of pJar strategy are in existence, pJar 0.00 and pJar
0.99, of which the 0.99 version is most important. There is no Phase 1 involve-
ment in either version, pooled funds are directly utilized to farm rewards in
Phase 2, after which they are sold in Phase 3 to re-invest the accrued yield.
– pJar 0.00: These pJars involve a user depositing LP tokens acquired by
supplying liquidity on Curve Finance [10], an AMM-based DEX (see 2.2).
The strategy employed in pJar 0.00 earns and re-invests CRV rewards by
8
September 15, 2021SoK: Yield Aggregators in DeFi 13 selling CRV into the market for stablecoins and re-depositing those into the Curve pools to get more LP tokens. Effectively, pJars 0.00 generate yield by accruing (1) LP fees from Curve and (2) generating CRV tokens because of Curve’s liquidity mining program [11]. – pJar 0.99: These pJars utilize LP tokens from Uniswap and Sushiswap, earn- ing yield by accruing (1) LP fees from Uniswap/ Sushiswap and (2) gener- ating SUSHI or other native tokens because of liquidity mining programs. Return for users Return of Pickle users is generally composed of (1) the fees accrued by providing liquidity to AMM pools, (2) earning tokens distributed through external liquidity mining programs, and—if the yield farmer makes use of the Farm products—(3) extra PICKLE tokens. The return is thus dependent on underlying market forces, liquidity programs and token values. For example, the Pickle emission schedule defines how much PICKLE will be distributed over time [41]. Protocol fees Most Pickle Jars have a 20% performance fee on the generated yield. 4.3 Harvest Finance Harvest Finance gives FARM holders the opportunity to share in the revenue model of the protocol. By staking FARM, users are entitled to receive part of the revenue that is collected by the protocol. Harvest Finance went live in August 2020, and currently has more than 70 pools/vaults in its offering. Strategies Harvest Finance has two main categories of yield farming strate- gies [21]: – Simple single-asset Strategies: Users deposit single assets such as USDC, USDT, DAI, WBTC, renBTC or WETH into a Harvest Vault, which then deposits those assets into another yield generating protocol, including Compound and Idle Finance. – LP token Strategies: Users deposit LP tokens from Uniswap, Sushiswap or Curve into Harvest which automatically collects liquidity mining rewards and re-invests them into LP tokens. Return for users Depending on the vault used, return of Harvest users is composed of (1) the fees accrued by providing liquidity to AMM pools or other yield-bearing assets, (2) earning tokens distributed through external liquidity mining programs and (3) extra FARM tokens as part of the liquidity mining pro- gram. These returns are dependent on underlying market forces, liquidity pro- grams and token values. For example, the Harvest emission schedule defines how much FARM will be distributed over time [19].
14                                C. Simon et al.

Protocol fees Harvest Finance does not charge withdrawal fees and does not
claim a direct “fee” on the yield farming revenue. However, during liquidation of
the yield, 30% of the profits is used to buy the FARM token on the market, which
is then distributed to users who stake FARM in the profit-sharing FARM pool [23].9

4.4     Yearn Finance

Yearn Finance offers a multitude of products in Decentralized Finance (DeFi),
providing lending aggregation, yield generation and others [35]. The services
discussed here are Yearn Earn, a lending aggregator, and Yearn Vaults, a more
comprehensive yield aggregator. Yearn Finance launched in July 2020.
Strategies

 – Earn pools: The strategy of the Earn pools is to collect a certain asset and
   deposit it either in dYdX, Aave or Compound, depending on where the high-
   est interest rate of that asset is found. Yearn will withdraw from one protocol
   and deposit to another automatically as interest rates change between pro-
   tocols. Earn pools thus omit Phase 1 and go directly to Phase 2, in a
   strategy that is slightly similar to the Idle Finance “Best-Yield” Strategy.
   Proportional shares in Earn pools are commonly represented by yTokens.
 – Vaults: A Yearn Vault uses an asset as liquidity, deposits that liquidity as
   collateral (accounting for risk levels) to borrow stablecoins. Then, it uses
   those stablecoins to generate yield, after which that yield is re-invested in
   the stablecoins to generate more yield. Vaults thus employ all phases as
   illustrated in Figure 2, and allows for more complex strategies compared to
   Earn pools. Proportional shares in Yearn Vaults are commonly represented
   by yvTokens or other yTokens.

   Yield farming strategies (Phase 2) in Yearn v2 Vaults can be complex,
involving flash loans, leveraged borrowing, staking on specific protocols (for ex-
ample HegicStaking) and more.
Return for users Yearn Finance distributed the YFI governance token over
a 9-day period after launch. Liquidity providers in the Earn pools or Vaults are
thus not incentivized by a Yearn liquidity mining program, so current yield only
comes from the returns that the product strategies reap. Those returns can be
straightforward, as is the case for Earn pools, and can be complex to calculate,
as is the case for v2 Vaults that can have up to 20 strategies working at once.
Some Yearn vaults accept LP tokens, other accept single asset tokens.
Protocol fees v1 Vaults have a 20% performance fee and a 0.5% withdrawal
fee (in case funds need to be pulled from the strategy in order to cover the with-
drawal request). v2 Vaults have also a 20% performance fee, but no withdrawal
fee. Instead, they charge a 2% management fee. Performance fees are split 50:50
9
     This type of buyback reduces the supply of governance tokens in the secondary
     market to the benefit of existing tokenholders.
SoK: Yield Aggregators in DeFi 15
1e8 vaultDAI: total_supply 1e8 vaultUSDC: total_supply 1e7 vault3crv: total_supply
7 yearn 6 yearn 4 yearn
6 harvest
idle
5 harvest
idle
harvest
pickle
5 4 3
4 3 2
3 2
2 1
1 1
0 0 0
p ov n ar ay Jul p ov n ar ay Jul ov n ar ay Jul
0 Se 020 N 2021 Ja 021 M 021 M 2021 0 Se 020 N 2021 Ja 021 M 021 M 2021 0N 202
1 Ja 1 M 021 M 2021
202 2 2 2 202 2 2 2 202 202 2
Date Date Date
(a) Total pool shares
vaultDAI: price_per_share vaultUSDC: price_per_share vault3crv: price_per_share
1.05 1.05 1.05
1.00 1.00 1.00
yearn
0.95 0.95 harvest
idle
0.95
0.90 yearn 0.90 0.90 yearn
harvest harvest
0.85 idle 0.85 0.85 pickle
p ov n ar ay Jul p ov n ar ay Jul ov n r y
1 Ja 021 Ma 21 Ma 2021 Ju
l
0 Se 0 N 2021 Ja 021 M 021 M 2021 0 Se 020 N 2021 Ja 021 M 021 M 2021 0N 202
202 202 2 2 202 2 2 2 202 2 20
Date Date Date
(b) Price per share
Fig. 7: Empirical data
between the Treasury and the Strategist, the official creator of the strategy. The
management fee is assigned fully to the Treasury.
4.5 Empirical performance
By fetching on-chain data of the above mentioned four main protocols, we visual-
ized the evolution of selected vaults for comparison purposes. The evolution of a)
total supply, and b) price per share are plotted for the DAI vault, USDC vault, and
3crv vault for aggregators where these specific pools are available. 3crv is the
LP token name for the Curve Finance 3pool. The name “vaultTokens” is used to
represent the share of the corresponding Token-pool in a specific protocol. The
price per share represents the ratio of underlying tokens and vaultTokens, which
should be 1-to-1 pegged to a certain currency in the beginning.
Generally, the value of the vaultTokens then increases relatively compared
to the underlying token as yield is accrued and added to the pool. Results are
shown in Figure 7.
Regarding the total pool supply, Yearn shows an overall increase till June
2021 for all vaults, while those of the other protocols are either stable or volatile
(especially in vault3crv). Meanwhile, the surge in total supply for Harvest vaul-
tUSDC in the middle of October 2020, followed by the drop at the end of the
same month coincides with the surge in TVL of Harvest by 21st October (TVL
achieved $704.1 million on 21st October, up 110% from $334.41 million a week
earlier), and the Harvest flash loan attack on 26th October, respectively. In the
attack, an attacker stole funds from the USDC and USDT vaults of Harvest Finance.
A malicious actor had exploited an arbitrage and temporary loss, allowing this
actor to obtain vault shares for a beneficial price, after which they were burned
for profit [18]. Looking at the vault3crv, drops in total supply of Harvest Finance16 C. Simon et al.
are observed at the beginning of January 2021 and towards the end of February
2021 as well.
Concerning price per share, the number steadily increases overall, aside from
the sharp declines observed for Harvest vaultDAI and vaultUSDC at the end of
October 2020. These are again attributed to the flash loan attack that occurred
on 26th October, where funds were drained out of the pool without equally
affecting the number of vaultDAI. Further, the graph shows that the Yearn
vaults update their contract relatively often, resulting in a short lifespan of
plots—otherwise, a sharp decrease in price per share might have been observed
after the attack against Yearn Finance on 4 February 2021, in which an unknown
entity stole $2.8 million, resulting in Yearn’s DAI vault losing $11.1 million [8].
The hacker(s) exploited the vault using Aave—a complex exploit with over 160
nested transactions and 8.6 million gas used (around 75% of the block) reportedly
resulted in a loss of $2.7 million [15].
4.6 Other Aggregators
The four main yield aggregators above are deemed the most mature, but a
new wave of yield aggregating protocols is coming up. In general, there seems
to be a tendency where more recent yield aggregators aim to be a one-stop-
shop, providing additional functionalities such decentralized exchanges, lending
and borrowing and risk-managing services. This enhances user experience and
introduces more revenue streams for the protocols.
Below we list more recently launched protocols and products that are still
being tested.
Vesper Finance Vesper [52] focuses on institutional adoption of the DeFi yield
market. Currently, only Vesper Grow Pools are available, which are compara-
ble to the traditional yield products. In future developments, Vesper plans to
integrate Vesper Labs [52] where external users can build their own strategy in
return for part of the reaped profits.
Rari Capital Rari Capital [46] is a roboadvisor that attempts to provide in-
vestors with the highest yield, beyond just lending. It has multiple products,
including Earn, Tranches, Fuse and Tanks. The Earn product can be consid-
ered a traditional yield farming service, while the other products are extending
the number of functionalities on the Rari Capital platform, such as lending and
borrowing, and yield farming within certain risk boundaries, called “tranches”
[32].
Alpha Homora Alpha Homora provides leveraged yield farming and leveraged
liquidity provision. Users can participate in various roles in Alpha Homora,
including Yield Farmers, Liquidity Providers, ETH Lenders, Liquidators, and
Bounty Hunters [38]. This protocol does not specifically focus on extending the
number of functionalities in one application, but more on allowing users to lever-
age their positions.SoK: Yield Aggregators in DeFi 17 5 Discussion 5.1 Benefits of using yield aggregators The aggregation level offered by yield aggregators typically has a number of ad- vantages. First, yield farmers do not have to actively compose their own strategy, but they can make use of the workflows invented by other users (called strate- gists), turning their investment strategy from active to a more passive approach without the need for extensive knowledge about the underlying protocols. Strat- egy creators, whether those are employed by the protocol or external stakehold- ers are constantly in search of new strategies that better captures the current DeFi opportunities. Second, because cross-protocol transactions are happening through a smart contract, capital shifts are done automatically, removing the need for the user to transfer funds manually between protocols. Finally, because funds are pooled in a strategy contract, the gas costs are socialized, resulting in fewer and thus lower interaction costs. 5.2 Risks of using yield aggregators Traditionally, high rewards come with high risk and this is no different with yield farming. The composability of strategies allows creation of endless possibilities, yet in every element and layer of the stack, there are potential risks that should be accounted for. This section discusses the prominent risks in yield farming strategies. Lending and borrowing risks Yield farming strategies might use lending and borrowing transactions as part of creating yield. Both come with risks. Liquidity risk In lending platforms, the Utilization rate U is generally defined as T otalAmountBorrowed/T otalLiquidity. A utility ratio of U = 0 means that there is no demand for the supplied funds and there are no borrowers. We speak of “under-utilization”, which is bad for business, as there is low interest. In this situation, there is no real risk. When utility ratio is close to U = 1, nearly all funds supplied in a pool are being borrowed. While this results in high interest rate, it also creates a so-called “liquidity risk”: if many lenders withdraw at the same time, a certain amount of them will have to wait until some of the borrowers have paid back their outstanding loans. Both lenders and borrowers are incentivized to get funds back into the pool because of a high premium rate, but in an high utilization scenario, there might be insufficient funds available for withdrawal. Liquidation risk When a strategy borrows tokens, there is a risk of liquidation, which happens when the value of the collateral falls below a pre-determined liq- uidation threshold [39]. In that case, the deposited collateral is no longer deemed valuable enough to cover the amount of the loan that was taken. At liquidation, the borrower losses part of all of the collateral, which the lending protocol au- tomatically places for sale in the market at a discount with the proceeds used
18                               C. Simon et al.

for loan repayment [56]. As should be clear from the above, using assets that
are volatile relative to the loaned assets potentially increases the chance of liqui-
dations. This is why stablecoins are an important asset class in the mechanism
of borrowing, as they potentially reduce the chance of liquidation by decreasing
volatility in the assets used as collateral, the loaned assets or both.

Composability risks Even though the composability factor of DeFi is what
makes yield farming possible in the first place by allowing for complex, intercon-
nected financial protocols, it does bring along the danger of smart contract risk
as more and more money legos are plugged into a strategy. Both technical and
economic weaknesses give rise to attractive exploit opportunities for malicious
hackers. Funds in every step along the way can be compromised, potentially
leading to huge losses for yield seekers.
   Individual smart contracts have the potential of containing software bugs,
which could lead to unwanted behaviour when interacting with the application.
Many protocols try to mitigate such kinds of vulnerabilities by undergoing se-
curity audits by an external party or by launching bug bounty programs for
community members.
    Even if contracts are secure on an individual level, the combination of mul-
tiple smart contracts may not. The attack surface of a set of interacting smart
contracts might be greater than the sum of its parts. Also, the effect of failure
in one of the core components can cause a ripple effect throughout the whole
ecosystem. Using a yield aggregator, the risk not only lies in smart contract risks
of that aggregator, but also in all of the underlying protocols in lower layers.

Examples On 26 October 2020, an attacker executed a theft of funds from two
Harvest Finance vaults. The exploit included a flash loan to open an arbitrage
opportunity and was able to steal 3.2% of the total value locked in the protocol,
worth $33.8 million at that time [18]. Then, on 21 November 2020, Pickle Finance
suffered from a $19.7 million dollar exploit after a hacker used a fake jar to swap
funds with the real cDAI jar [49]. This hack was possible after several design
issues within the Pickle contracts.

APY instability Market forces can lead to instabilities in the returns, making
the advertised APYs unreliable. This decreases the user experience.

Volatile lending returns While in Section 3.2 we assume a stable APY for
deposits, the returns offered by lending protocols can be volatile in reality. It
is important to note that interacting with a lending protocol can affect the
utilization ratio, the key variable of an interest rate model. In the case of a yield
aggregator, where funds are aggregated and moved in significant volume, lending
returns can change by changing the active strategy to or away from the lending
protocol.

Divergence loss A commonly known risk of providing liquidity in AMMs is
divergence loss, also known as impermanent loss (IL), caused by price volatility
SoK: Yield Aggregators in DeFi 19
of the assets that were used to obtain LP tokens. Xu et al [57], explain this
concept more in depth.
Low trading activity When the strategy supplies part of the funds in a liquidity
pool, it is subjective to the activity within that pool for its trading fees. Low
activity in the pool results in lower trading fees, decreasing APY.
Price fluctuations in liquidity incentives As discussed in Figure 2.1, protocols
might reward users with liquidity incentive tokens. Demonstrated in Section 3.2,
strategies making use of this reward system are subject to the value of those
incentives. Price fluctuations in those tokens cause APYs to be unstable and
thus unreliable.
5.3 The sustainability of yield
Yield aggregators have been and still are an attractive way to collect yield in
DeFi. But how sustainable is this yield? Discussed in Section 2.1, yield comes
from three main sources. While research on the sustainability of yield deserves
a separate examination, it could be argued that yield coming from native token
distribution is relatively short-lived. Once emission schedules are finished, this
yield source is depleted. Even though new protocols can blossom with their
newly started emission schedules, it seems unlikely that this source of yield is
sustainable. The demand for borrowing could be more sustainable in that regard,
but it is highly dependent on market sentiment, especially for non-stablecoins.
Yield from revenue sharing tokens seems to be the most durable, especially if
DeFi is able to hold on to recent growth rates.
In the end, investors choose a yield aggregator that offers the most advan-
tages while simultaneously diminishing the risks attached to this. This generally
requires a trade-off between the costs of using a strategy, the security risks and
the offered yield.
6 Related work
The investigation of DeFi protocols is a fairly new field, there is a paucity of
existing works related to DeFi, especially the ones associated with yield aggre-
gating protocols. [37] and [40] systematically study the general designs of DeFi
platforms by decomposing the structure into diverse elements, i.e., peg assets,
collateral amount, price and governance mechanism, they investigate the pros
and cons of DeFi platforms to spot future directions.
On the other hand, recent existing works mainly focus on particular types of
DeFi protocols or explore unusual behaviours observed. For instance, Liu et al.
[33] conduct a comprehensive measurement study of DeFi oracles of four prime
DeFi platforms to find the operational issues intrinsic in oracles and common
divergence between the real and achieved prices.
There are various papers relating to flash loans. Wang et al. [54] reveal a
structure that enables the identification and classification of speculative flash20 C. Simon et al.
loan transactions. Within the scope of the analysis of financial attack vectors that
involve a flash loan, [45] study the existing flash loan-based attacks and propose
optimizations that significantly improve the ROI of these attacks. Further, [16]
shows with specific focus on the leading DeFi project by market share, that it
is feasible for attackers to combine crowdfunding and flash loans to execute a
successful attack.
The mechanics and properties of DeFi lending protocols are investigated in
several studies [17,5,39,50,28]. Gudgeon et al. [17] coin the phrase Protocol for
Loanable Funds (PLFs), to name protocols that form distributed ledger-based
markets for loanable funds. Further, they study the structure used to settle
interest rates on three major PLFs, and provide several empirical analysis on
the interest rate movements and the market efficiency.
Structured models for lending protocols and the relevant pools are developed
in the following papers [5,39,50]. Bartoletti et al. [5] present the major proper-
ties of lending pools and their synergies with other DeFi protocols. An empirical
analysis of liquidations on lending platforms is conducted by Perez et al. [39], by
utilizing the abstract model of Compound. This work employs a more generic
model of a pool, enabling both lending and DEX protocols to be formalized.
Tolmach et al. [50] further set formal definitions for the dominant DeFi compo-
nents and propose a formal process-algebraic technique to model DeFi protocols
to enable efficient property verification.
With regards to studies that utilise simulation and stress tests, Kao et al. [28]
employ agent-based modelling and simulation-based stress tests, in order to eval-
uate the economic security of the Compound protocol. Lewis et al. [16] explore
how design weaknesses in DeFi protocols can trigger a decentralized financial
crisis, by for instance conducting stress tests with Monte Carlo price simulation
to show how a DeFi lending protocol may find itself under-collateralized.
Further, for building financial models specifically of blockchain protocols and
applications, a simulation platform is provided by Gauntlet.10
7 Conclusion
In this SoK, we propose a general framework for yield farming strategies. First,
we explain where yield comes from and describe a number of primitives in yield
farming. We study protocols and tokens used by aggregators to generate yield,
after which we combine this information to create a general workflow of yield
farming strategies. Second, we draft three examples of frequently used strategies
and simulate yield farming performance under a set of assumptions. Third, we
compare four major yield aggregators by summarizing their strategies and rev-
enue models and by evaluating on-chain data on three specific vaults. Finally,
we discuss the benefits and risks of yield aggregating protocols, together with
related work in the DeFi industry.
While yield farming has been exploding since 2020, an important question
remains if current yields will be sustainable in the long term. Higher rewards
10
https://gauntlet.network/SoK: Yield Aggregators in DeFi 21 also imply higher risks, and DeFi attacks might prove that the safest and most robust yield provider might win the race. New industry developments focus on building one-stop-shop solutions, in pursuit of aggregating more than just yield and facilitating the on-boarding of new DeFi users.
22                                 C. Simon et al.

References
 1. Aave: Open Source DeFi Protocol (2021), https://aave.com/
 2. Angeris, G., Kao, H.T., Chiang, R., Noyes, C., Chitra, T.: An
    Analysis of Uniswap markets. Cryptoeconomic Systems (11 2020).
    https://doi.org/10.21428/58320208.c9738e64, https://cryptoeconomicsyst
    ems.pubpub.org/pub/angeris-uniswap-analysis
 3. Balancer: Balancer (2021), https://balancer.finance/
 4. Bancor: Bancor Network (2021), https://app.bancor.network/eth/data
 5. Bartoletti, M., Chiang, J.H.y., Lluch-Lafuente, A.: SoK: Lending Pools in Decen-
    tralized Finance (12 2020), http://arxiv.org/abs/2012.13230
 6. Berenzon, D.: Liquidity Mining: A User-Centric Token Distribution Strategy (10
    2020), https://medium.com/bollinger-investment-group/liquidity-mining
    -a-user-centric-token-distribution-strategy-1d05c5174641
 7. Cambridge English Dictionary: YIELD (2021), https://dictionary.cambridge
    .org/dictionary/english/yield
 8. Coindesk: Yearn Finance DAI Vault ‘Has Suffered an Exploit’; $11M Drained
    (2021), https://www.coindesk.com/yearn-finance-dai-vault-exploit
 9. Compound: Compound (2021), https://compound.finance/
10. Curve Finance: Curve Finance (2021), https://curve.fi/
11. Curve Finance: Understanding Tokenomics (2021), https://resources.curve.fi
    /base-features/understanding-tokenomics
12. DeFi Pulse: DeFi - The Decentralized Finance Leaderboard at DeFi Pulse (2021),
    https://defipulse.com/
13. DeFi Score: DeFi Score (2021), https://defiscore.io/
14. dYdX: dYdX (2021), https://dydx.exchange/
15. Etherscan: Transaction Details - block 11792334, https://etherscan.io/tx/0x
    6dc268706818d1e6503739950abc5ba2211fc6b451e54244da7b1e226b12e027
16. Gudgeon, L., Perez, D., Harz, D., Livshits, B., Gervais, A.: The Decen-
    tralized Financial Crisis. In: Crypto Valley Conference on Blockchain
    Technology (CVCBT). pp. 1–15. No. February, IEEE (6 2020).
    https://doi.org/10.1109/CVCBT50464.2020.00005, h t t p s : / / i e e e x p l o r e . i
    eee.org/document/9150192/
17. Gudgeon, L., Werner, S., Perez, D., Knottenbelt, W.J.: DeFi Protocols for
    Loanable Funds. In: Proceedings of the 2nd ACM Conference on Advances
    in Financial Technologies. pp. 92–112. ACM, New York, NY, USA (10 2020).
    https://doi.org/10.1145/3419614.3423254, https://dl.acm.org/doi/10.1145
    /3419614.3423254
18. Harvest Finance: Harvest Flashloan Economic Attack Post-Mortem (10 2020),
    https://medium.com/harvest-finance/harvest-flashloan-economic-attack
    -post-mortem-3cf900d65217
19. Harvest Finance: FARM Token Info (2021), https://farm.chainwiki.dev/en/su
    pply
20. Harvest Finance: Harvest Finance (2021), https://harvest.finance/
21. Harvest Finance: Harvest Finance Yield Farming Strategies (2021), https://farm
    .chainwiki.dev/en/strategy
22. Harvest Finance: Harvest implementation (2021), https://github.com/harvest
    -finance/harvest-strategy
23. Harvest Finance: Harvest Vault (2021), https://farm.chainwiki.dev/en/educ
    ation/vault
You can also read