DIRECT LENDING: POSITIONING FOR THE 'END OF THE CREDIT CYCLE'? - HERMES SPECIALIST CREDIT Institutional Money Insurance Day

Page created by Monica Jacobs
 
CONTINUE READING
DIRECT LENDING: POSITIONING FOR THE 'END OF THE CREDIT CYCLE'? - HERMES SPECIALIST CREDIT Institutional Money Insurance Day
HERMES SPECIALIST CREDIT

          DIRECT LENDING: POSITIONING FOR
          THE ‘END OF THE CREDIT CYCLE’?
          Institutional Money Insurance Day

Patrick Marshall, Head of Private Debt and CLOs
10 September 2019
For professional investors only
DIRECT LENDING: POSITIONING FOR THE 'END OF THE CREDIT CYCLE'? - HERMES SPECIALIST CREDIT Institutional Money Insurance Day
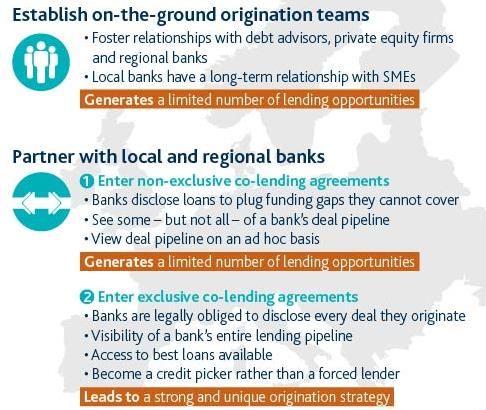
Agenda

1. Direct Lending – Definition and Appeal

2. Different Lenders, Different Strategies

3. Current Market Conditions

4. Impact of Different Investment Parameters
DIRECT LENDING: POSITIONING FOR THE 'END OF THE CREDIT CYCLE'? - HERMES SPECIALIST CREDIT Institutional Money Insurance Day
DIRECT LENDING – DEFINITION
AND APPEAL
DIRECT LENDING: POSITIONING FOR THE 'END OF THE CREDIT CYCLE'? - HERMES SPECIALIST CREDIT Institutional Money Insurance Day
Direct lending landscape
Seeking attractive yield through direct business lending
The opportunity
►       Asset managers, pension funds, insurers, SWFs and hedge funds lend to businesses without bank intermediation
►       Most loans are provided to SMEs, which are structurally unable to access the capital markets
►       Opportunities to structure secured and strong-yielding loans with floating-rate coupons

A growing market1
►       Quantitative easing has driven the yields from government bonds and other asset classes to all-time lows, prompting investors to target higher-yielding alternatives
►       As at June 2018, approximately 200 direct lending funds accounted for aggregate commitments of US$90bn globally. Almost 60 of these funds operate in Europe, compared to 12 funds in 2012
        −     Providing debt at different points in the capital structure for different returns
►       The UK is the largest market for private debt funds, accounting for 38% of all deals undertaken in Europe in last 22 quarters

Huge demand for loans as banks retreat from the market
        −     About €300bn of dry powder held by Europe-focused private equity funds seeking investments

Fundraising trends2

►       Fundraising activity has been strong for the past 24 months: 2017 was a record year for Direct Lending fundraising in both Europe and North America.
        −     For example, since January 2017 four funds raised a combined total of €19.5bn
►       “Gorilla” funds under significant pressure to deploy capital, forcing them to accept high levels of leverage, borrower-friendly legal terms and high portfolio concentration
        −     Competing against CLO and high-yield capital markets

1, 2   Source: “Direct Lenders: seizing opportunity in an uncertain world,” published by Deloitte in Q3 2018.
Attractiveness of direct lending
Benefits of investing in SME loans
Attractive yield in a low-yield environment                                                                                  Spread per unit of leverage1
►    Stable returns despite the financial crisis                                                                              180 bps

►    Illiquidity premium                                                                                                      130 bps
                                                                                                                               80 bps
►    Offer better risk-return characteristics
                                                                                                                               30 bps
      ̶ Spread per unit of leverage has remained strong, reducing pricing risk
                                                                                                                               -20 bps
      ̶ European loans offer attractive spreads compared to US loans, which are often subject

                                                                                                                                         4Q98
                                                                                                                                         3Q99
                                                                                                                                         2Q00
                                                                                                                                         1Q01
                                                                                                                                         4Q01
                                                                                                                                         3Q02
                                                                                                                                         2Q03
                                                                                                                                         1Q04
                                                                                                                                         4Q04
                                                                                                                                         3Q05
                                                                                                                                         2Q06
                                                                                                                                         1Q07
                                                                                                                                         4Q07
                                                                                                                                         3Q08
                                                                                                                                         2Q09
                                                                                                                                         1Q10
                                                                                                                                         4Q10
                                                                                                                                         3Q11
                                                                                                                                         2Q12
                                                                                                                                         1Q13
                                                                                                                                         4Q13
                                                                                                                                         3Q14
                                                                                                                                         2Q15
                                                                                                                                         1Q16
                                                                                                                                         4Q16
                                                                                                                                         3Q17
                                                                                                                                         2Q18
        to weaker documentation and higher loss rates
Low volatility with high recovery rates                                                                                                                                Europe                                            U.S.

►    Low mark-to-market volatility provides stability to a diversified portfolio                                             Average European Term Loan B primary spread by deal size2
►    Average historical recovery rate of more than 70% in the event of default for senior                                       E+550
     secured loans                                                                                                              E+450
Inflation Hedge                                                                                                                 E+350
►    Floating-rate coupons provide a hedge against inflation
                                                                                                                                E+250
►    Most loans will have LIBOR or EURIBOR floors
                                                                                                                                E+150

                                                                                                                                           2001

                                                                                                                                                  2002

                                                                                                                                                         2003

                                                                                                                                                                2004

                                                                                                                                                                        2005

                                                                                                                                                                               2006

                                                                                                                                                                                      2007

                                                                                                                                                                                             2008

                                                                                                                                                                                                    2009

                                                                                                                                                                                                           2010

                                                                                                                                                                                                                  2011

                                                                                                                                                                                                                         2012

                                                                                                                                                                                                                                2013

                                                                                                                                                                                                                                       2014

                                                                                                                                                                                                                                              2015

                                                                                                                                                                                                                                                     2016

                                                                                                                                                                                                                                                            2017

                                                                                                                                                                                                                                                                   2018
A level of protection against downside risk
►    Advantageous terms and covenants can be negotiated, providing controls and detailed                                                     Deals of less than €250M                                               Deals of €250M to €499M
     information on borrowers                                                                                                                Deals of €500M to €999M                                                Deals of €1B or more

1 Source:S&P Global Market Intelligence as at December 2018. 2 Source: S&P Capital IQ as at December 2018. Chart shows performance of first-lien bullet term loans.
Past performance is not a reliable indicator of future results.
DIFFERENT LENDERS, DIFFERENT
STRATEGIES
Direct lending strategies
Not all private debt funds compete against each other
            15%

            14%
                                Payment-in-kind (PIK)
            13%

            12%

            11%
                          Mezzanine / Subordinated debt

            10%
                                                                                                       Different target returns drive
                                                                                                       different strategies
            9%
   Margin

            8%
                                                                Unitranche                             Direct lenders entering the market
                                                                                                       either adopt a niche strategy (by
            7%
                                                                                                       exercising industry or geographical
            6%
                                                                                                       expertise) or aim to meet a broad
            5%                                                                                         range of financing needs by sourcing
                                                            Senior-secured debt
            4%                                                                                         loans across the capital structure
            3%                                            Mid-cap private placements
                                                                                                       with different security rankings and
                                                                                                       recovery potential (as a means of
            2%
                                                                                                       maximising origination opportunities
            1%
                                                                                                       and achieving returns)
                       €50m                     €100m   €150m               €200m      €250m   €300m
                                                                Debt size
Source: Deloitte Alternative Tracker Q4 2015.
Returns and positioning within the capital structure
► Senior-secured loans – classic 1st Lien debt (i.e. at the top of the capital structure) with attractive yield

► Unitranche loans – bespoke instrument providing strong returns (blending senior and subordinated debt into single tranche)

                                                     Enterprise value
                                                       8.0 – 10.0x

                                                                                                                                                  Secured debt

                                                                                                                                                  Full access to
                                                      Senior debt                                                                                 security package
                                              50%
                  Multiple through security

                                                       3.5 – 5.0x       1st lien                                                                  ►   1st ranking:
                                                                                                                          Unitranche   1st lien       senior debt or
                                                                                                                                                      unitranche
                                                                                                                                                  ►   2nd ranking:
                                                                                                                                                      subordinated
                                                                                                                                                      debt

                                              10% Subordinated debt
                                                                        Mezzanine, second lien, PIK Gross IRR of 10-15%
                                                      1.0 – 1.5x        2nd lien

                                                                                                                          4.0 – 6.5x
                                                                                                                                                  Equity ‘cushion’
                                                                                                                                                  Approximately 40%
                                              40%       Equity          Target gross IRR above 20%                                                headroom over the
                                                       3.5 – 5.0x       Uncapped returns but no security                                          value of the
                                                                                                                                                  company for the
                                                                                                                                                  subordinated debt

                                                        x EBITDA
What are the current direct lending strategies?
How direct lenders differentiate themselves

           Product offering                                          Sourcing via co-lending agreements
           ► “Story” unitranche                                      ► Formal and legally binding

           ► 1st loss or 2nd loss unitranche                            −   Hermes, DZ Bank, RBS/Natwest, Danske and KBC
           ► Asset-based lending/unitranche                          ► Formal but not legally binding

           ► Lower down the capital structure (with buckets for      ► Informal
               Mezzanine, Subordinated and Distressed debt as well
               as quasi-equity)

         Sponsors, sectors, jurisdictions, cov-lite                  Ancillary products, hold Levels, leverage
         ► Lending to sponsor-less companies                         ► Revolving credit facility

         ► Lending to more cyclical industries (‘Special sits’)      ► Increasing loan hold strategies (with large debt hold
                                                                        levels)
         ► Lending to less lender-friendly jurisdictions (Southern
            Europe)                                                  ► Use of fund leverage

         ► No cap on cov-lite transactions
Direct lending strategies: deal sourcing
Accessing European SME loans
►      Despite ongoing disintermediation in the European market, direct lending accounts for only 10% of Europe’s business loan market1. Companies still source all or part of their
       financing from banks that have fostered long-term relationships in specific regions where companies are located

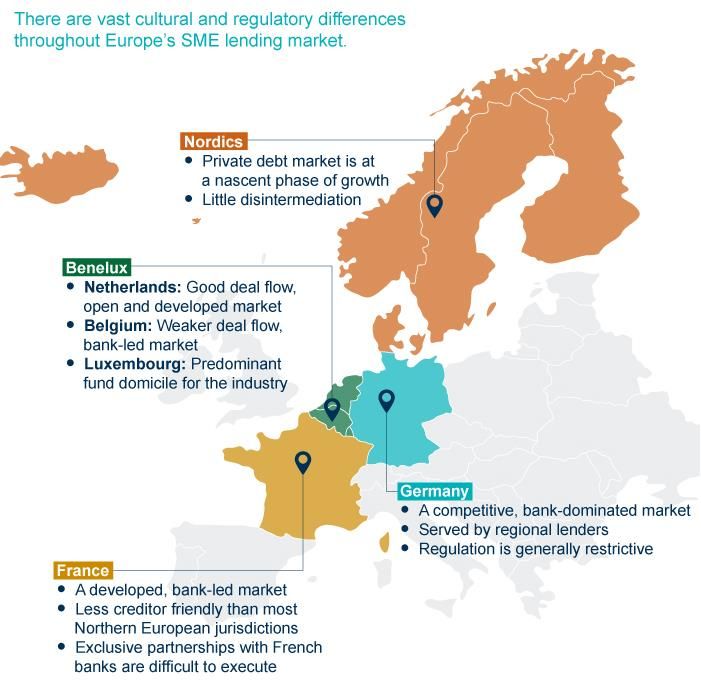
►      Vast regulatory and cultural differences across Europe’s business landscape has hindered the pace of disintermediation

►      Strong origination agreements with banks continue to be vital to access high-quality loans, particularly in the mid-market space
                                 Regulatory and cultural differences                                                  How can Direct Lenders unlock the SME loan market?

                                                                            Different Lenders, Different Strategies

1   "LCD Global Review – US/Europe”, published by S&P Global Market Intelligence in April 2017
CURRENT MARKET CONDITIONS
Certain indications of a ‘hot’ market
Fuelled by strong CLO issuance and the need for direct lenders to deploy capital

► Increasing preponderance of cov-lite loans, even in the mid-cap space – accounts for 87% of the large-cap market1
► Unitranche loans with leverage >8x for certain sectors
► Higher covenant headroom, flatline covenants
►      Looser legal terms, including:
       −    Generous structuring EBITDA add-backs, watering down the effectiveness of covenant tests
       −    Use of EBITDA cures
       −    Increased flexibility of incrementals (“Freebie” baskets etc.) and large acquisition facilities for very small borrowers
       −    Leakage of assets outside the group
       −    Increased level of portability
       −    Restrictions on transferability

► Junior debt being paid back before more-senior debt
► Increasing loan hold strategies (with large debt hold levels), thereby increasing portfolio concentration
► Higher use of fund leverage
► Lending to more cyclical industries
► Increased level of direct lending in less lender-friendly jurisdictions (Southern Europe)

1   LCD European Leveraged Lending Review, October 2018
Direct lending strategies: cov-lite loans
The rise of cov-lite loans
Cov-lite loans
►      Cov-lite loans (senior loans with weaker investor protections) dominate large-cap segment of the European market
       ►    In 2007, cov-lite loans accounted for
Market overview
Leverage and cash interest coverage levels

► Total leverage multiples remain in the 4.5x-5.0x range – still below peak 6.0x multiples. This is supported by:
  − High levels of equity contribution
  − Conservative EBITDA/Cash interest ratios – which are at their highest level for the past 10 years

Average debt/EBITDA in Europe                                                                        Average EBITDA/cash interest in Europe
 7.0 x                                                                                                6.0x

 6.0 x
                                                                                                      4.5x
 5.0 x

 4.0 x
                                                                                                      3.0x
 3.0 x

 2.0 x                                                                                                1.5x

 1.0 x
                                                                                                      0.0x

                                                                                                                2004

                                                                                                                        2005

                                                                                                                               2006

                                                                                                                                      2007

                                                                                                                                             2008

                                                                                                                                                    2009

                                                                                                                                                           2010

                                                                                                                                                                  2011

                                                                                                                                                                         2012

                                                                                                                                                                                2013

                                                                                                                                                                                        2014

                                                                                                                                                                                               2015

                                                                                                                                                                                                      2016

                                                                                                                                                                                                             2017

                                                                                                                                                                                                                    2018
 0.0 x
         2001 2002 2003 2004 2005 2006 2007 2008 2009 2010 2011 2012 2013 2014 2015 2016 2017 2018

                First Lien/EBITDA             Second Lien/EBITDA       Other Debt/EBITDA                               Average               3rd Quartile                1st Quartile                 Median
                                                                                                     Excludes Broadcasting, Cable & Telecom loans prior to 2002.
Source: S&P Global Market Intelligence as at 31 December 2018.                                       Includes only transactions for which Pro Forma financials were made available.
IMPACT OF DIFFERENT INVESTMENT
PARAMETERS
ESG Integration
ESG integrated into the investment process
Why we analyse ESG risk
►    ESG risks can impact investments as heavily as financial risks
     − Corporate governance and culture
     − Operational performance, labour relations and productivity
     − Sustainability of supply chains
     − Environmental impact
►    Good ESG practices reduce risk and improve long-term returns, supporting our aim of preserving capital and capturing yield

ESG scoring methodology1
                                                                                                      ESG due diligence on loan
                                                                             Fundamental research involving Hermes EOS and the Hermes Responsibility team

                                                                                                                Social analysis                                                        Governance analysis
                      Environmental analysis
                                                                                           Including workplace health and safety. Labour relations and              Including board structure, risk controls and procedures, and
    Including energy efficiency, pollution and waste management
                                                                                                           supply-chain management,                                                     transparent reporting

                     E score              (high risk – low risk)                                          S score               (high risk – low risk)                           G score          (high risk – low risk)

                                                                                                               ESG score on loan
                                                                                                    Weighted towards the highest E, S or G score

Source: Hermes. 1 This applies to companies that are not in our list of excluded industries. To see this list, please refer to the appendix of this presentation.
Plethora of ESG resources under one roof
Supports dynamic ESG Integration
                                                                                             EOS
                                                                                     Engagement specialists

► Responsibility team consults credit team
    on policy and integration
► Collaboration with EOS in engagement at
    highest of management and board levels
    − Serves to deliver holistic returns
    − Allows for “real-time” ESG analysis
► Internal, proprietary QESG scores allows
                                                                                     Hermes
    for pricing of ESG risks                                                          Credit
                                                                Responsibility                                    QESG Scores
                                                               Sets ESG policies                              Proprietary quantitative
                                                               and consults with                                   ESG scores
                                                           investment teams on ESG
                                                                  integration1

1Source:   ESG research. For illustrative purposes only.
Sponsor-backed deals
Private Equity skin in the game – it’s important!

► Equity cushion in LBO transactions
     ̶ Continues to provide valuable cushion should a loan underperform
► Discipline among private-equity firms evident in average purchase price multiple for acquisitions
     ̶ Provides lenders with added security in the underlying valuations of the businesses financed

Average equity contribution 1

  PPM                        LTM           2017 (%)          2016 (%)           2015 (%)   2014 (%)    2013 (%)   2012 (%)   2011 (%)   2010 (%)   2009 (%)   2008 (%)   2007 (%)
                          3/31/18
  5.0x to 7.9x                  40                 41                43              38         39          40         49         44         43         51         46         33

  8.0x to 9.9x                  40                 41                47              41         36          45         50         45         51        N/A         45         34

  10.0x to                      44                 44                54              46         45          44         54         53         55        N/A         45         33
  11.9x
  12.0x or                      55                 53                52              48         57         N/A         62         55         60        N/A         48         34
  greater

                                                                                                      It is important that private equity sponsors have skin in the
                                                                                                                                      game in downside scenarios
Source: S&P Global Market Intelligence as at Capital IQ as at end March 2018.
Equity cushion
A second lien buffer can help to protect the senior piece of the loan

                                                                                                                  Avg Purchase Price Multiple Trailing EBITDA

                   2018 Total EV                      50% Senior                     70% Unitranche   2004 Total EV           70% Unitranche             50% Senior

                                                     5.45x EBITDA                                                                                        5.45x EBITDA
                                                                                      7.6x EBITDA      7.6x EBITDA               7.6x EBITDA

                    10.9x EBITDA
                                                                                                                                                         2.15x EBITDA

                                                     5.45x EBITDA
                                                                                                                                 0.0x EBITDA
                                                                                      3.3x EBITDA

Source: Hermes, S&P Global Market Intelligence as at Capital IQ as at end YE 2018.
Direct lending strategies: jurisdictions
Default and recovery

► European default levels remain persistently low                                                                            European default rates: 1st lien leveraged loans, 2005 to Sep 20151

        ̶ 1st lien default rate of 3% from 2005 to 20151                                                                                     8%
                                                                                                                                                                                                         7.00%
                                                                                                                                             7%                                  6.64%
► Mean 1st lien recoveries were 74% in 2014 and have
       consistently been above 70% across the whole of Europe in                                                                             6%
       recent years2

                                                                                                                              Default rate
                                                                                                                                             5%                                          4.67%

        ̶ Outcomes for second-lien and mezzanine debt are typically                                                                          4%                                                                  3.45% 3.38%
          binary, with zero recovery more likely                                                                                             3%
                                                                                                                                                                       2.24%
                                                                                                                                                          1.97%                                                                1.82%
                                                                                                                                             2%
► Smaller debt issuers benefit from higher mean 1st lien                                                                                                                                         1.02%
                                                                                                                                                  0.87%
       recoveries                                                                                                                            1%
                                                                                                                                                                  0%
                                                                                                                                             0%
        ̶ Mean of 76% v 71% for larger debt issuers2                                                                                              2005 2006 2007 2008 2009 2010 2011 2012 2013 2014 LTM
                                                                                                                                                                                                                          Sep
                                                                                                                                                                                                                          2015
                                                                                                                                                                            Trend in 1st lien default rate
                                                                                                                                                       1st lien default rate                Poly. (1st lien default rate)

1   Source: “Leveraged finance default review” by Jonathan Blau et al. Published by Credit Suisse Fixed Income Research, Global Leveraged Finance Strategy on 14 October 2015.
2 “2014  European Empirical and Recovery Rating Performance Update Shows Continued Strong First Lien Recoveries”, published by S&P Ratings Service on 20 May 2015.
Direct lending strategies: jurisdictions
Europe v USA: Insolvency and recovery timeframes
► Compared to US-focused direct lenders, investors in the majority of North European countries benefit from:
  −  Stronger recovery rates in insolvency situations
  −  Shorter restructuring periods
► Southern Europe has presented less-favourable recovery conditions. It has:
  −  Lower recovery rates.
  −  Longer restructuring periods.
Recovery rates in an insolvency: Europe v USA                                                                                                  Average restructuring periods: Europe v USA
       100                                                                                                                                             2.5

                                                                                                                                                        2
        90

                                                                                                                                               Years
                                                                                                                                                       1.5
%

        80
                                                                                                                                                        1
        70
                                                                                                                                                       0.5

        60                                                                                                                                              0
                                                                                   USA

                                                                                                             Sweden

                                                                                                                      Spain
               Norway

                        Netherlands

                                      Belgium

                                                          Finland

                                                                                         Germany
                                                                              UK

                                                                                                   Austria

                                                                                                                              France

                                                                                                                                       Italy
                                                Denmark

                                                                    Ireland

                                                                                                                                                                                                                                                           Sweden
                                                                                                                                                             Norway

                                                                                                                                                                      Netherlands

                                                                                                                                                                                    Belgium

                                                                                                                                                                                                                                 USA

                                                                                                                                                                                                                                                                    Spain
                                                                                                                                                                                                        Finland

                                                                                                                                                                                                                                       Germany
                                                                                                                                                                                                                            UK

                                                                                                                                                                                                                                                                                     Italy
                                                                                                                                                                                                                                                 Austria
                                                                                                                                                                                              Denmark

                                                                                                                                                                                                                                                                            France
                                                                                                                                                                                                                  Ireland
The World Bank as at May 2019.
Summary
End-of-cycle Direct Lending

Benefits of Direct Lending                                       Process / Philosophy
► Attractive yield, low volatility                               ► Origination strategy can impact portfolio quality
► High recovery rates, downside protection                       ► Jurisdictional focus affects recovery rates
► Inflation / deflation hedge                                    ► ESG integration influences outcome
                                                                 ► Product features impact losses

Benefits of sponsored lending
► Equity support, professional management teams                  Investment Team
► Equity commitments forge alignments of interest with lenders   ► Adding value through sourcing strategy
► Superior quality of information, additional due diligence      ► Adding value in credit analysis and monitoring

                                                                 ► Adding value through experience and recovery process

Gross Yield Fallacy … Adjust for Expected Loss
HERMES SPECIALIST CREDIT

          HERMES DIRECT LENDING FUND
          Q3 2019

For professional investors only
OUTCOMES BEYOND PERFORMANCE

                Our approach to holistic returns means
                we are committed to delivering excellent
                long-term investment performance and
                stewardship, while improving the lives of
                many
Table of contents

1.   Executive summary
2.   Hermes Investment Management
3.   Hermes Direct Lending Fund
4.   Investment team and process
5.   Market overview
6.   Summary
7.   Appendix
Executive summary
Hermes Direct Lending Fund
                                ► Diversified portfolio of attractive 1st lien European senior-secured and unitranche loans
                                ► Customisable investment Fund
         Clear and                 − European Direct Lending (EUR) – targeting EURIBOR + 5-6% gross annualised returns
     customisable Fund             − UK Direct Lending (GBP) – targeting LIBOR + 6% gross annualised returns
                                   − Co-investment vehicle allows higher bespoke return targets
                                ► Intensive fundamental credit analysis prioritising downside protection

                                ► Full spectrum of loan-investing skills
         Experienced            ► Through-the-cycle experience
            team
                                ► Average of 15 years’ credit experience within the Investment Team

                                ► Four co-lending agreements: KBC (Benelux), NatWest (UK), Danske Bank (Nordics) and DZ Bank (Germany)
     Unique origination            − Exclusive access to high-quality loans to European mid-market businesses
         capability                − Partner banks are legally bound to invite Hermes to participate in deals
                                ► Complemented by independent origination through the team’s contacts in Europe

                                ► Natural alignment of interests with investors
        Organisational          ► Hermes is a significant European private equity investor with strong sponsor relationships
           strength
                                ► Direct lending is a strategic growth initiative backed by significant seed capital

Targets cannot be guaranteed.
HERMES INVESTMENT MANAGEMENT
Aiming to deliver excellent, long-term investment returns – responsibly
Hermes Investment Management
A diversified platform

                                               Total AUM (millions)            USD         GBP         EUR

      8%
              9%
                                                   Equity

                                                   Real Estate
                                                                             25,630      20,138      22,507
                                                                                                                               508STAFF
                                                                                                                               Located in:
                                                                              8,099       6,364       7,112
  9%     US$45.8bn                                                                                                                                                      DENMARK
                                                                                                                                              DUBLIN
              £36.0bn              56%             Infrastructure             4,033       3,169       3,541
                                                                                                                                                                        FRANKFURT
              €40.3bn
    18%                                            Fixed Income               3,732       2,932       3,277                                                           LONDON

                                                   Private Equity             4,347       3,416       3,818                      NEW YORK

                                                                                                                                                                SINGAPORE

 US$637.8                                  bn
                                                                                                                                 219
 £501.1bn / €560.0bn                                                                                                             Investment and
 Under stewardship                                                                                                               stewardship staff

Please note the total AUM figure includes US$8.4bn / £6.6bn / €7.4bn of assets managed or under an advisory agreement by Hermes GPE LLP (“HGPE”), a joint venture between Hermes Fund
Managers Limited ("HFM") and GPE Partner Limited. HGPE is an independent entity and not part of the Hermes group. US$30.0m / £23.6m / €26.4m of total group AUM figure represents HFM
mandates under advice. Source: Hermes as at 30 June 2019.
CHARACTERISTICS
Hermes Direct Lending Strategy European Fund
Seeking attractive and stable returns from high-quality senior loans, while offering the
flexibility to target higher yields
  Key Characteristics                                                                                EUR Fund
                                                                                                     EURIBOR + 5-6% on a gross annualised basis1
  Performance objective
                                                                                                     Co-investment vehicle allows for higher bespoke return targets
                                                                                                     Senior loans to European mid-market businesses
  Universe                                                                                           – European loans: >65%
                                                                                                     – UK loans: up to 35%
                                                                                                     Senior-secured loans: >65%
  Eligible instruments
                                                                                                     Unitranche loans: up to 35%
  Management fee                                                                                     75bps on NAV
                                                                                                     10% of returns exceeding EURIBOR + 3.5% net per annum, compounded annually
  Performance fee
                                                                                                     Calculated when all loans in the portfolio have been repaid
  Maximum industry concentration                                                                     Maximum of 20% of portfolio in any industry (with any two at 25%)
  Base currency                                                                                      Euros, with hedging on foreign currency exposure

  Investment Period                                                                                  3.5 years post First Closing, with the ability to extend by 1 year with Investor Committee consent

  Investment Term                                                                                    7 years from Final Closing, with the ability to extend by 2 years with investor consent
  Concentration                                                                                      Highly diversified pool of loans
The value of investments and income from them may go down as well as up, and you may not get back the original amount invested. Any investments
overseas may be affected by currency exchange rates. Past performance is not a reliable indicator of future results and targets are not guaranteed.
1 This   return target has been revised upwards from that stated in the product offering document.
Hermes Direct Lending Fund
Desired loan characteristics

Key transaction features                                             Investment universe

 Company          ► First-class sponsor or shareholder
                                                                                                                              Self-originated
 profile          ► European SME focus                                Bank-originated senior- secured loans
                                                                                                                                   loans
                    − EBITDA ranging from €5m to €75m
                    − Enterprise value ranging from €50m to €750m
                  ► Leverage below 5.5x for senior-secured loans
                  ► Covenant package and first-ranking securities
                  ► No cov-lite instruments

 Eligible         ► Senior loans                                                                 Hermes Direct Lending Fund
 instruments        – Preferably ‘club’ deals
                  ► Unitranche loans
                  ► Equity owned only as a result of restructuring

 Key terms        ► 1st lien loans
                  ► Term loan B – bullet repayment                                                     Secondary market
                  ► Typical maturity of 6-8 years                                                           loans
                  ► No rating constraints
Hermes Direct Lending Platform

Source: Hermes as at July 2019.
INVESTMENT TEAM AND PROCESS
Investment team
Expert team with institutional support
                                                                   Patrick Marshall                                                                               Hermes Credit
                                                              Head of Private Debt & CLOs
                                                                                                                                                                  Mitch Reznick, CFA
     Laura Vaughan, CFA                  Alexandra Trapes                 Maria van der Veer                 Carina Spitzkopf                  Kevin Roche        Co-Head and Head of
     Head of Direct Lending                   Director                         Director                          Director                        Director         Research, plus 5
                                                                                                                                                                  analysts
Team characteristics
                                                                                     Full range of loan-investing               Alignment of interests with       Providing research on
              Experience                      Credit-focussed investing
                                                                                                skills                                 investors                  industry sectors:
                                                                                                                                                                  ► Financials
 ►    Core team of 6 investment           ►   Intensive bottom-up                   ►   Strategic origination                   ►   Substantial seed investment
      professionals with an                   credit analysis                           agreements with lenders                     from parent shareholder       ► Energy
      average of 15 years’
                                          ►   Focus on high-quality                 ►   Independent origination                 ►   Remuneration linked with      ► Utilities
      experience1
                                              instruments, not chasing                  through extensive contacts                  returns to clients
 ►    Experience at leading mid-              yield                                                                                                               ► Healthcare
                                                                                    ►   Structuring, execution,                 ►   Hermes Investment Office
      market lending institutions                                                                                                                                 ► Automotive
                                          ►   Conservative investment                   monitoring, restructuring,                  independently reviews
      and in European credit
                                              style provides downside                   work-out                                    performance
      markets                                                                                                                                                     ► Retail and leisure
                                              protection
                                                                                    ►   Hermes GPE enhances
 ►    Invested in loans throughout
                                          ►   Monitoring investments is                 firm’s reputation among
      the full extent of credit cycles
                                              equally as important as                   sponsors
                                              execution

Organisational support

                                 Legal                                         Hermes Investment Office                                                  Operations
Source: Hermes as at 31 July 2019.
Investment process
Investment philosophy

Return of capital is more important than return on capital

► Aiming for capital preservation coupled with yield capture                          ► Buy-and-hold investment approach
    − Return of capital has primacy over additional yield                                −  Flexibility to invest in senior-secured
►   Proactive, fundamental, bottom-up research                                              and unitranche loans, aiming to
►   Focus on defensive characteristics:                                                     maximise investment and yield
                                                                                            opportunities
    − High barriers to entry
    − Resilient and diversified cash flows                                            ► Yield capture driven by contractual
    − Established and experienced                              Downside     Yield       performance
         management teams                                                               − Outperformance driven by minimising
                                                               protection   capture         defaults and maximising recoveries
►   Prescriptive loan documentation maximises
    protection and establishes controls                                               ► Constant assessment of the relative value
    over borrowers                                                                      of new opportunities
►   Independent due diligence
►   Floating-rate coupons hedge the impact of
    rising interest rates
►   Active management and portfolio monitoring
Investment process
Overview

                                                Company                       Transaction
                  Origination                                                                               Monitoring                       Exit
                                                evaluation                     structure

           ► Loans sourced through        ► Fundamental bottom-up        ► Risk-return analysis,       ► Measuring borrowers’      ► Repayment or
             bank co-lending                analysis: business risk,       including comparison of       performance against         refinancing
             agreements:                    financial risk, structural     relative value                expectations, with in-    ► Sale or restructuring of
               − KBC Bank                   risk                         ► Evaluation of capital         depth review                underperforming
                                          ► Review of third-party          structure, security           discussions with            assets with an
               − Danske Bank                                                                             management teams
                                            due diligence                  package and legal                                         understanding of
               − NatWest                                                   arrangements, including     ► Assess compliance with      market dynamics and
                                          ► Meetings with
               − DZ Bank                    management                     loan documentation            covenants and               liquidity of the
           ► Self-origination through                                    ► Review of ‘club’ or other     assumptions in recovery     underlying loan
             market contacts:                                              participants in               analysis
               − Financial                                                 transactions                ► Manage any impaired
                 intermediaries                                          ► Transaction fees given        loans and defaults
               − Sponsors                                                  to the strategy
               − Banks
               − Corporate treasurers
           ► Secondary acquisitions
             when favourable yields are
             available
Investment process
Origination strategy
Transaction type                Sourcing                                 Transaction strategy                                   Targeted return
European senior-secured         ► Origination agreements with European   ► Co-lending agreement provides transaction volume          >4%
loans                             banks:                                 ► Lender of record in bank-originated transactions
                                  − KBC Bank
                                                                         ► Input on structure and pricing
                                  − Danske Bank
                                                                         ► Independent credit analysis and asset selection
                                  − Royal Bank of Scotland/NatWest
                                  − DZ Bank

Corporate and                   ► Sponsors                               ► Self-origination with an aim to enhance yield             5-8%
European private debt           ► Debt advisory groups                   ► UK corporate and pan-European senior-secured loans
                                ► Banks                                  ► UK and pan-European unitranche loans
                                ► Corporate management teams             ► Higher yields for bespoke financing solutions

Secondary loans                 ► Banks                                  ► Broad investment universe                                 3-5%
                                ► Debt funds                             ► Access to partner banks’ back books
                                ► Independent brokers                    ► Relative-value positioning
                                                                         ► Focus on high-performing instruments

                                                           Our co-lending partnerships with leading banks, combined with our own
Targets cannot be guaranteed.
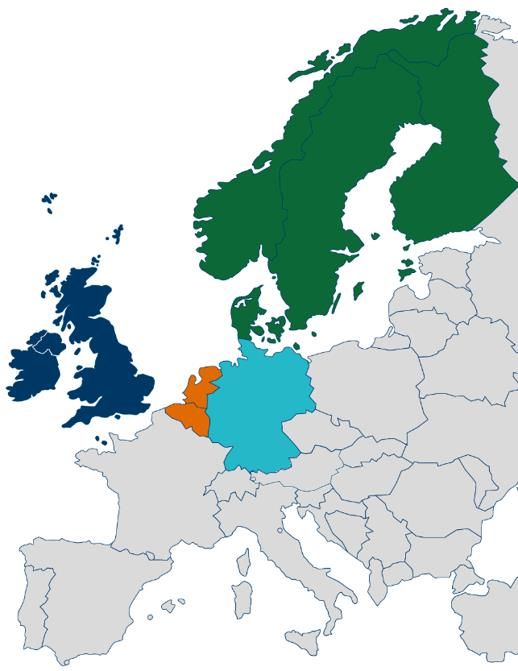
                                                                    origination skills, sustain a strong pipeline of high-quality loans
Investment process
Strong origination through exclusive co-lending agreements

Danske Bank                                              KBC Bank
► #1 SME lender in Denmark                               ► #1 SME lender in Belgium
► #2 SME lender in Sweden & Finland                      ► #2 SME lender in Luxembourg
► #3 SME lender in Norway                                ► #5 SME lender in the Netherlands

NatWest                                                  DZ Bank
► #2 SME lender in the UK                                ► #3 SME lender in Germany
► #3 SME lender in Ireland
   (through Ulster bank)

Key terms
► Formal agreements providing Hermes with exclusive access to high-quality loans
► Partner banks are legally bound to invite Hermes to participate in deals
► Hermes exercises full discretion over which loans it invests in

Source: Danske Bank, DZ Bank, NatWest and KBC Bank as at July 2017. GCA Altium MidCapMonitor Q4 2016.
Investment process
Fundamental analysis

 Economic and industry                                                     Company evaluation                                                         Structural considerations
 ► Macroeconomic view and jurisdictional risks                             ► Strategy and future growth prospects                                     ► Key terms of the proposed loans
 ► Market position and location in                                         ► Management team experience and depth                                     ► Eligibility and relative-value analysis
   the value chain                                                         ► Profitability and cash flow sustainability and diversification           ► Proposed security package
 ► Industry dynamics, including cyclical and regulatory issues             ► Balance sheet stability                                                  ► Jurisdictional matters
 ► Product and business analysis, including barriers to entry              ► Capital structure
                                                                           ► Going concern valuation and break up value
                                                                           ► Ownership and track record of sponsor

 Receive loan request                  1st Investment       Fundamental credit                       2nd Investment        Final review                     Board                             Investment
                                       Committee            analysis                                 Committee                                              approval
 ► Prepare screening paper
                                       meeting                                                       meeting
 ► Identify key risks                                       ► Business risk                                                ► Review loan terms
 ► Present loan terms                                       ► Financial and legal risk                                     ► Review legal
                                                            ► Structural analysis                                              documentation
                                                            ► Loan terms                                                   ► Address all
                                                            ► Model, projections and stress                                    outstanding points
                                                              analysis                                                         raised at Investment
                                                            ► Eligibility criteria and relative-                               Committee
                                                              value analysis
                                                            ► Management and due
                                                              diligence meetings
Investment process
Monitoring process

Monitoring and managing loans is equally as important as the          Deal pipeline
initial investments                                                   Consists of potential investments nominated by analysts. All actions regarding
►    Track underlying performance of borrowers against expectations    the instruments and underlying borrowers are subject to Investment Committee
                                                                      approval
►    Relative value of loans against similar instruments

    Daily monitoring                                                  Quarterly portfolio review
    ► News flow                                                       ► Formal review of all portfolio instruments
    ► Company-specific and industry developments                         − Changes in business fundamentals and management
                                                                         − Review of performance to date and forecasts for underlying borrowers
    Weekly monitoring                                                    − Portfolio diversification
    ► Pipeline review and market conditions
                                                                      ► Review of watch list – course of action agreed
    ► New investment activity
    ► Review watch list and other material credit issues              ► Recovery analysis on all work out credits, and review of work-out strategy

    Monthly monitoring
    ► Monthly accounts versus expectations and annual performance
    ► Review of KPIs, covenant headroom and liquidity
    ► Management meetings if necessary
Investment process
Work-out and restructuring expertise

Investment team is experienced in loan restructuring and work-outs across Europe
Contacts among lawyers, restructuring advisors, accountants, and the restructuring units of major banks and distressed-debt funds

          Portfolio Manager led the restructuring team in Europe and Asia for Lehman Brothers prior to its bankruptcy
          Media (Netherlands)                                 Specialist packaging company (Germany)                        Telecoms company (Spain)
          Steering Committee                                  Advisor to Syndicate                                          Advisor to Syndicate
          Hospitality company (UK)                            Meat packaging company (Netherlands)                          Other transactions
          Bilateral                                           Advisor to Syndicate                                          Business directory (Italy),
                                                                                                                            Industrial (Netherlands), gambling (UK),
          Steel company (UK)                                  Financial institution (Austria)                               entertainment (UK), motoring services (UK),
          Advisor to Syndicate                                Steering Committee                                            media (UK), heavy manufacturing (Germany),
          Financial services company (UK)                     Petrol station operator (Belgium)                             retail (France), construction (Denmark),
          Bilateral                                           Advisor to Syndicate                                          chemical (Hungary), aircraft loans (USA),
                                                                                                                            resources (Ghana and Kyrgyzstan),
          Telecoms company (Germany)                          Financial institution (Sweden/Iceland)                        conglomerate (Saudi Arabia and Switzerland)
          Steering Committee                                  Chair, Steering Committee                                     and a number of Russian loans

                                                          Portfolio Manager oversaw the work-out of the Lehman Brothers European
                                                                                            corporate and real estate loan portfolio
Source: Hermes.
Investment process
ESG integration
Why we analyse ESG risk
►   ESG risks can impact investments as heavily as financial risks
    − Corporate governance and culture
    − Operational performance, labour relations and productivity
    − Sustainability of supply chains
    − Environmental impact
►   Good ESG practices reduce risk and improve long-term returns, supporting our aim of preserving capital and capturing yield

ESG scoring methodology1
                                                                                                      ESG due diligence on loan
                                                                             Fundamental research involving Hermes EOS and the Hermes Responsibility team

                                                                                                                Social analysis                                                        Governance analysis
                      Environmental analysis
                                                                                           Including workplace health and safety. Labour relations and              Including board structure, risk controls and procedures, and
    Including energy efficiency, pollution and waste management
                                                                                                           supply-chain management,                                                     transparent reporting

                     E score             (high risk – low risk)                                           S score              (high risk – low risk)                            G score          (high risk – low risk)

                                                                                                              ESG score on loan
                                                                                                   Weighted towards the highest E, S or G score

Source: Hermes. 1 This applies to companies that are not in our list of excluded industries. To see this list, please refer to the appendix of this presentation.
SUMMARY
Executive summary
Hermes Direct Lending Fund
                                ► Diversified portfolio of attractive 1st lien European senior-secured and unitranche loans
                                ► Customisable investment Fund
         Clear and                 − European Direct Lending (EUR) – targeting EURIBOR + 5-6% gross annualised returns
     customisable Fund             − UK Direct Lending (GBP) – targeting LIBOR + 6% gross annualised returns
                                   − Co-investment vehicle allows higher bespoke return targets
                                ► Intensive fundamental credit analysis prioritising downside protection

                                ► Full spectrum of loan-investing skills
         Experienced            ► Through-the-cycle experience
            team
                                ► Average of 16 years’ credit experience within the Investment Team

                                ► Four co-lending agreements: KBC (Benelux), NatWest (UK), Danske Bank (Nordics) and DZ Bank (Germany)
     Unique origination            − Exclusive access to high-quality loans to European mid-market businesses
         capability                − Partner banks are legally bound to invite Hermes to participate in deals
                                ► Complemented by independent origination through the team’s contacts in Europe

                                ► Natural alignment of interests with investors
        Organisational          ► Hermes is a significant European private equity investor with strong sponsor relationships
           strength
                                ► Direct lending is a strategic growth initiative backed by significant seed capital

Targets cannot be guaranteed.
APPENDIX
Sponsor-backed deals
High average multiples paid for businesses
Average purchase price multiple
  Year                                                                      All buyouts    Secondary buyout    Corporate divestiture   Public to private
  2004                                                                              7.6x                7.3x                    7.5x                7.4x
  2005                                                                              8.3x                8.6x                    7.7x                8.7x
  2006                                                                              8.8x                8.8x                    8.2x                9.8x
  2007                                                                              9.7x               10.4x                    9.0x               10.4x
  2008                                                                              9.7x                9.9x                    9.0x               10.3x
  2009                                                                              8.9x                N/A                     9.9x                 N/A
  2010                                                                              9.2x                9.7x                    7.4x                 N/A
  2011                                                                              8.8x                8.8x                    8.6x                 N/A
  2012                                                                              9.3x                9.4x                    8.7x                 N/A
  2013                                                                              8.7x                9.0x                    8.0x                8.7x
  2014                                                                              9.7x                9.8x                    9.3x                8.7x
  2015                                                                              9.2x                8.9x                    9.9x               10.7x
  2016                                                                             10.0x                9.7x                    8.4x               12.8x
  2017                                                                             10.3x               10.6x                    8.9x                9.4x
  LTM 31/03/2018                                                                   10.3x               10.6x                    9.4x                9.3x

Source: S&P Global Market Intelligence as at Capital IQ as at end March 2018.
Hermes UK Direct Lending: illustrative cash flows
                        (in £m)                              Total                Year 1               Year 2               Year 3              Year 4           Year 5              Year 6               Year 7               Year 8
Capital invested                                             (750)                 (250)                 (250)               (250)
Arrangement fees                                              18.6                  6.2                    6.2                 6.2
Cash interest received                                       169.7                  4.9                   18.1                31.1                39.7              36.2               25.3                 12                   2.3
Investment repayments                                        766.3                   0                      0                   0                  0               183.8              255.4                255.4                71.7
Opening cash                                                                         0                  (238.9)             (464.6)             (677.1)           (637.4)            (417.4)              (136.7)              130.7
Gross cash flow                                                                   (238.9)               (225.7)             (212.5)               39.7              220               280.7                267.4                73.9
Closing cash                                                                      (238.9)               (464.6)             (677.1)             (637.4)           (417.4)            (136.7)               130.7               204.6

Capital invested and repaid (£m)1                                                 Interest and fee income (£m)                                                   Fund gross cash flow (£m)
  1,000                                                                            45                               39.7                                         400
                                                                                   40                                       36.2                                                                                 280.7 267.4
                          (750.0) (750.0) 183.8 439.2 694.7          766.3                                                                                       300                                     220.0
    800                                                                            35                       31.3
                                                                                                                                                                 200
                                                                                   30                                                 25.3
    600              (500.0)                                                                                                                                     100                                                            73.9
                                                                                   25                                                                                                             39.7
                                                                                   20              18.1
    400                                                                                                                                                             0
           (250.0)                                                                 15                                                        12.0
                                                                                                                                                                 -100
    200                                                                            10       4.9
                                                                                    5                                                                  2.3       -200
                                                                                                                                                                                      (212.5)
       0                                                                            0                                                                            -300 (238.9) (225.7)
            Yr1 Yr2 Yr3             Yr4    Yr5 Yr6      Yr7 Yr8                             Yr1     Yr2     Yr3    Yr4    Yr5     Yr6        Yr7      Yr8               Yr1    Yr2     Yr3 Yr4           Yr5     Yr6    Yr7      Yr8
             Capital invested             Investment repayments                                              Cash interest received                                                            Gross cash flow
                           Fund term assumptions                                                               Senior loan assumptions                                                         Unitranche assumptions
Fund size:                                                        £750,000,000               Expected % of total:                                         75%           Expected % of total:                                            25%
Management fee:                                                           0.75%              Arrangement fee:                                           2.14%           Arrangement fee:                                              3.50%
Performance fee:                                             10% over L + 4.50%              Loan margin:                                           L + 4.75%           Current loan margin:                                      L + 4.00%
Upfront fee:                                                           £750,000              3m GBP LIBOR:                                           0.5000%            3m GBP LIBOR:                                              0.5000%
Admin cost:                                                               0.03%              Loan maturity:                                          4.0 years          Loan maturity:                                             5.0 years
                                                                                             LIBOR floor:                                               0.00%           LIBOR floor:                                                  1.00%
                                                                                                                                                                        PIK rate:                                                     3.50%
For illustrative purposes only. Cash flows cannot be guaranteed. 1 Payment-in-Kind interest included in investment repayments.
Hermes European Direct Lending: illustrative cash flows
                       (in €m)                               Total                Year 1               Year 2               Year 3              Year 4           Year 5             Year 6              Year 7         Year 8
Capital invested                                            (1,000.0)             (333.3)              (333.3)              (333.3)
Arrangement fees                                               25.7                 8.6                   8.6                  8.6
Cash interest received                                        181.2                 5.2                  19.1                 33.0                41.9             38.5               27.4                 13.3         2.8
Investment repayments                                        1,021.7                0.0                   0.0                  0.0                 0.0            228.7              340.6                340.6        111.8
Opening cash                                                                        0.0                (319.6)              (625.3)             (917.0)          (875.1)            (607.9)              (240.0)       113.9
Gross cash flow                                                                   (319.6)              (305.7)              (291.7)               41.9            267.2              367.9                353.9        114.7
Closing cash                                                                      (319.6)              (625.3)              (917.0)             (875.1)          (607.9)            (240.0)               113.9        228.6

Capital invested and repaid (€m)1                                                    Interest and fee income (€m)                                                 Fund gross cash flow (€m)
  1,200                                                                                50                                                                           500
                            (1,000)       569.3       1,021.7
                                    228.7                                                                     41.9                                                  400                                  367.9 353.9
                    (1,000)                     909.9                                                                        38.5
  1,000                                                                                40                                                                                                         267.2
                                                                                                         33.0                                                       300
     800                                                                                                                                                            200                                              114.7
                   (666.6)                                                             30                                             27.4
                                                                                                                                                                    100                      41.9
     600
                                                                                                     19.1                                                             0
                                                                                       20
     400 (333.3)                                                                                                                             13.3                  -100
                                                                                       10                                                                          -200
     200                                                                                      5.2
                                                                                                                                                      2.8          -300
                                                                                                                                                                                        (291.7)
        0                                                                               0                                                                          -400 (319.6) (305.7)
             Yr1 Yr2 Yr3             Yr4 Yr5 Yr6        Yr7 Yr8                               Yr1     Yr2     Yr3 Yr4 Yr5 Yr6                Yr7      Yr8                 Yr1 Yr2 Yr3 Yr4 Yr5 Yr6               Yr7 Yr8
            Capital invested            Investment repayments                                                 Cash interest received                                                     Gross cash flow
                         Fund term assumptions                                                                Senior loan assumptions                                                         Unitranche assumptions
Fund size:                                                  €1,000,000,000                  Expected % of total:                                          70%          Expected % of total:                                    30%
Management fee:                                                      0.75%                  Arrangement fee:                                            2.17%          Arrangement fee:                                      3.50%
Performance fee:                                        10% over E + 3.50%                  Loan margin:                                            E + 4.15%          Current loan margin:                              E + 4.00%
Upfront fee:                                                      €750,000                  3m EURIBOR:                                                0.000%          3m EURIBOR:                                          0.000%
Admin cost:                                                          0.03%                  Loan maturity:                                           4.0 years         Loan maturity:                                     5.0 years
                                                                                            EURIBOR floor:                                              0.00%          EURIBOR floor:                                        0.00%
                                                                                                                                                                       PIK rate:                                             3.00%
For illustrative purposes only. Cash flows cannot be guaranteed. 1 Payment-in-Kind interest included in investment repayments.
Hermes Direct Lending: RoC considerations
Offering a higher RoC than other assets that insurers typically invest in

                                                                                                                                             Indicative
 Asset class                                                                                     Duration                                                  Indicative Capital Charge6   Return on Capital1,4,6
                                                                                                                                             Return1,4,6

 Hermes notional Direct Lending fund
                                                                                                 4.3 years                                     5.5%                 12.7%                       43.3%
 – legal maturity2

 Hermes notional Direct Lending fund
                                                                                                 3.5 years                                     5.5%                  12.2%                      45.1%
 – average maturity3

 A rated corporate bond                                                                          3.6 years                                     1.8%                  5.0%                       35.5%

 BBB rated corporate bond                                                                        3.4 years                                     2.6%                  8.5%                       30.3%

 Equity (Type 1)                                                                                      --                                       7.0%                 32.66%5                     21.4%

 Equity (Type 2)                                                                                      --                                       7.0%                 42.66%5                     16.4%

Sources: Market data, Markit, Hermes.
1 Target returns based on £108 million portfolio of 10 senior secured loans within Hermes’ direct lending portfolio as of 11 January 2019.
2 “Legal maturity” assumes that loans are held to maturity.
3 “Average maturity” assumes that loans are held for 3.5 years.
4 Neither indicative returns, nor stated Returns on Capital (“RoC”), nor future performance of any kind can be guaranteed.
5 The equity capital charges (Type 1 and Type 2) include a symmetric adjustment which was -6.34% on 31 December 2018.
6 Calculated on Hermes’ assumptions of Solvency II requirements as of 11 January 2019.
Hermes Direct Lending Fund
ESG guidelines

                                       Excluded industries                                                   Areas requiring enhanced due diligence

 ► Gambling, casinos, tobacco, alcohol, pornography                                               ► Due diligence involves greater contributions from the Hermes
                                                                                                    Responsibility team and Hermes EOS as appropriate:
 ► Weapons and munitions, including cluster bombs
                                                                                                    − Energy: oil and gas and power generation
 ► Genetically modified organisms, the fur trade and cosmetic
      products tested on animals                                                                    − Chemicals
 ► Ship breaking, shark finning and other destructive fishery                                       − Forestry and agricultural commodities
      practices
                                                                                                    − Manufacturing
 ► Businesses damaging primary or tropical forests, wetlands and
      critical natural habitats                                                                     − Mining and metals

Source: Hermes Private Debt & Direct Lending’s Environmental, Social and Governance Guidelines.
Hermes Investment Office
Acting in the interests of clients

Investment teams supported by a robust and transparent risk framework

     Responsible for delivering               Clear and independent       Remuneration aligned with long-
                                                                                                                 Aligned with clients’ interests
      investment performance                philosophies and processes         term performance

 Hermes Investment Office

 ► Ensuring managers are always acting in clients’ interests             ► Providing independent performance and risk oversight

 ► Objectively challenging managers’ positions and views                 ► Promoting a focus on risk-adjusted returns
Senior-secured loans
Top of the capital structure with attractive yield

► Classic 1st lien debt

► Historically a banking product

                                                                Expected returns               4.0%-5.5%

                                                                Key investment criteria        Capacity to reimburse the debt / LTV

                                 Fees +
                              cash coupon                       Terms                          Cash coupon: EURIBOR (+ potential floor 0%-0.5%) + margin 3.0%-5.0%
                               4.5%-5.5%
  Target IRR
                                                                Security                       1st ranking
  5.0%-6.0%
                               EURIBOR
                           (+ possible floor)                   Value creation                 Interest received + nominal repaid

                                                                Arranging/ underwriting fees   2.0%-3.5% upfront or offers in discount in case of syndication

                                                                                               4-7 years
                                                                Usual main features
                                                                                               Amortising and bullet

For illustrative purposes only. Targets cannot be guaranteed.
Unitranche loans
Bespoke instruments providing strong returns

► Blending of the entire debt financing tranches into a single tranche combining senior and subordinated debt

                                                                  Expected returns               6.5%-9.0% (including warrants)
                                  Warrants
                                                                  Key investment criteria        Capacity to reimburse the debt / LTV, Capex and acquisition strategy
                                  (optional)

                                                                                                 Cash coupon: EURIBOR ( with floor 0.5%-1.0%) + margin 3.5%-5.0% & Potential PIK: 2.5%-5.0% +
                                                                  Terms
                                                                                                 Warrants (optional)
                                PIK1 coupon
                                                                  Security                       1st ranking
                                 2.5%-5.0%
 Target IRR                                                       Value creation                 Interests received + nominal repaid [+ warrants]
  7%-10%
                               Cash coupon                        Arranging/ underwriting fees   2.5%-3.5%
                                  + Fees
                                4.5%-5.5%                                                        6-8 years
                                                                  Usual main features            Non-call for 2 years
                                                                                                 Bullet debt
                                 EURIBOR
                           (+ floor 0.5%-1.0%)                    Involvement in management of
                                                                                                 Observer seat
                                                                  the companies

1 Payment   in kind. For illustrative purposes only. Targets cannot be guaranteed.
Private Debt team
Biographies

                                    Patrick Marshall
                                    Head of Private Debt & CLOs, Senior Portfolio Manager and Member of the Investment Committee
                                    Patrick joined Hermes in June 2015 to launch and manage the Hermes Direct Lending Strategy, which invests in senior loans to UK and European mid-market
                                    businesses. In this role, Patrick is responsible for the day-to-day management of the Hermes Direct Lending Funds and has ultimate authority on which transactions to put
                                    forward for investment by the fund, subject to Investment Committee approval. He was previously Head of Direct Lending in London at Tikehau Capital, and Partner at
                                    WCAS Fraser Sullivan Investment Management, where he established the firm’s European loan business. Prior to that, Patrick managed loan portfolios in excess of $4bn
                                    and $10bn as managing director at the Lehman Brothers Estate and head of European and Asian loan portfolio management and restructuring at Lehman Brothers
                                    respectively. He has a Bachelor of Commerce in Business Administration and French from the University of Edinburgh.

                                    Stephane Michel, CFA
                                    Senior Portfolio Manager
                                    Stephane joined Hermes in April 2018 as Senior Portfolio Manager. He is assisting the development of the multi-asset credit offering, with particular focus on the illiquid and
                                    unrated universe. Stephane has extensive credit experience, having worked both on the buy-side and sell-side. Prior to joining Hermes he was a consultant for institutions
                                    exploring portfolio transactions, risk transfer trades and establishing asset management platforms. Previously, he was Global Head of Complex Structured Products and Regional
                                    Head of Non-Core & Legacy at UBS. Prior to that, he was Head of Research at Cairn Capital and co-head of credit research at Barclays Capital, and analyst/portfolio manager at
                                    Green T Asset Management and Cabot Square Capital. Stephane started his career as a financial analyst at Goldman Sachs, primarily working on corporate rating advisories. He
                                    holds a BSc degree in Economics from the University of Pennsylvania (Wharton School of Business) and is a CFA charterholder.

Source: Hermes as at 30 June 2019.
CFA® is a trademark owned by the CFA Institute.
Private Debt team
Biographies

                                     Laura Vaughan, CFA
                                     Head of Direct Lending
                                     Laura joined Hermes in November 2015, when the private debt platform was being established. Her role has developed from analysing potential fund investments to now also
                                     include managing the Direct Lending team. Laura joined from GE Capital, where she was an associate in its mid-market leveraged finance execution team. At GE, Laura focused
                                     on arranging financings for European private equity-backed acquisitions funded through senior, second lien, mezzanine and unitranche facilities. Prior to this, Laura worked for
                                     three years at Bank of Tokyo-Mitsubishi in its acquisition finance team in London, focusing on opportunities in European large-cap leveraged finance transactions and on
                                     portfolio management. Her previous role was at Allied Irish Bank in Dublin in its Corporate Banking North America division, in which she analysed US large-cap and middle-
                                     market leveraged finance transactions, and performed portfolio management functions. Laura has an Economics degree from University College Dublin. She is a CFA
                                     charterholder.

                                     Alexandra Trapes
                                     Director
                                     Alexandra joined Hermes in October 2015 from GE Capital in London, where she was a director in the leveraged finance division. In this role, Alexandra was a key member of
                                     the team that managed a European leveraged loan portfolio of more than $4.7bn and was mandated lead arranger for mid-cap, club and unitranche transactions. She managed
                                     loans extended to companies operating in a broad range of sectors, including business services, retail, food, education and construction. Prior to this, Alexandra worked for six
                                     years in the leveraged finance underwriting business of Royal Bank of Scotland, where she focused on UK mid-market leveraged and acquisition finance deals after working on
                                     European large-cap private equity-backed transactions. A French national, she holds a Specialised Masters in Corporate Finance from the EM Lyon School of Management and
                                     a Master of Science in Management from the ESC Grenoble School of Management.

Source: Hermes as at 30 June 2019.
Private Debt team
Biographies

                                     Maria van der Veer
                                     Director
                                     Maria joined Hermes in March 2018 as a Director in the Private Debt team. She is responsible for executing and monitoring transactions in the UK and Northern Europe for the
                                     Hermes Direct Lending Funds. Previously she was a Director in the Kaupthing Singer & Friedlander Leveraged Finance team in London. Within her role she was originating,
                                     structuring and executing mid-market sponsor- and non-sponsor-led leveraged transactions in the UK, Benelux and Nordics. Prior to that she worked at Fortis Bank in the
                                     Acquisition and Leverage finance team in Rotterdam, focusing on mid-market European syndicated loans. In addition, Maria has worked in strategic fundraising, market
                                     intelligence consultancy and account management with multinational companies in the UK and Finland. A Finnish national, she holds a Master of Science degree from Hanken
                                     School of Economics in Helsinki, with fluent knowledge of Dutch, Swedish and Finnish.

                                     Carina Spitzkopf
                                     Director
                                     Carina joined Hermes in January 2019 as a Director in the Private Debt team. She is responsible for analysis and execution of transactions in the UK and Europe for the Hermes
                                     Direct Lending Funds. Previously, she was a Director in the UBS Leveraged Finance Risk team, covering leveraged underwriting and lending across EMEA. Prior to UBS, Carina
                                     worked at Barclays Capital as part of the team responsible for the firm’s global debt underwriting and bridge financing activity. She started her career with Dresdner Kleinwort in
                                     Frankfurt where she was involved in both lending and restructuring of SME and large cap corporates across Europe. A German national, she holds a degree in Business
                                     Administration from Passau University, Germany.

Source: Hermes as at 30 June 2019.
Private Debt team
Biographies

                                     Kevin Roche, CFA
                                     Director
                                     Kevin joined Hermes in May 2019 as a Director working in the Private Debt investment team. Previously, he worked as a Director in AIB’s Leveraged Finance team where he
                                     was responsible for originating and executing loans to mid-market, private-equity backed companies. Prior to AIB, Kevin spent seven years working in a variety of structured
                                     finance roles within RBS/NatWest; including Loan Markets, Corporate Acquisitions, Financial Institutions, Asset Finance and Portfolio Management. Kevin started his career as
                                     an analyst within Commerzbank AG’s Market Risk division. He holds a bachelor’s degree in Business with Arts Management from IADT, Dublin and a Master’s of Science from
                                     UCD Michael Smurfit Graduate Business School. Kevin is an Irish national and CFA charterholder.

Source: Hermes as at 30 June 2019.
Hermes disclaimer

For professional investors only. This document does not constitute a solicitation or offer to any person to buy or sell any related securities, financial instruments or products; nor does it constitute an offer to
purchase securities to any person in the United States or to any US Person as such term is defined under the US Securities Exchange Act of 1933. It pays no regard to an individual’s investment objectives or
financial needs of any recipient. No action should be taken or omitted to be taken based on this document. Tax treatment depends on personal circumstances and may change. This document is not advice on
legal, taxation or investment matters so investors must rely on their own examination of such matters or seek advice. Before making any investment (new or continuous), please consult a professional and/or
investment adviser as to its suitability. This All figures, unless otherwise indicated, are sourced from Hermes. Further information on the Fund is available in the Information Memorandum.

The value of investments and income from them may go down as well as up, and you may not get back the original amount invested. Any investments overseas may be affected by currency
exchange rates. Past performance is not a reliable indicator of future results and targets are not guaranteed. This portfolio contains illiquid assets. Due to the nature of these assets, being typically
private, unique and bespoke, these portfolio investments will not be as easily sold in the market as publicly traded securities. Ability to redeem from this investment is limited and may be
significantly deferred, or impossible.

Issued and approved by Hermes Fund Managers Ireland Limited (“HFM Ireland”) which is authorised and regulated by the Central Bank of Ireland. Registered address: The Wilde, 53 Merrion Square, Dublin 2,
Ireland. Telephone calls will be recorded for training and monitoring purposes. HFM Ireland appoints Hermes Investment Management Limited (“HIML”) to undertake distribution activities in respect of the fund in
certain jurisdictions. Hermes Investment Management Limited is authorised and regulated by the Financial Conduct Authority. Registered address: Sixth Floor, 150 Cheapside, London EC2V 6ET. Telephone
calls will be recorded for training and monitoring purposes. Potential investors in the United Kingdom are advised that compensation may not be available under the United Kingdom Financial Services
Compensation Scheme.

BD004103
National Westminster disclaimer

This document has been prepared using information which is confidential and proprietary to National Westminster Bank plc (“we”, “us” and “our”). This document and any dispute arising under or in connection therewith is to be governed by and
construed in accordance with English law.

This document is being issued to you (the “Recipient” or “you” or “your”) by Hermes Investment Management Limited (“Hermes”) solely in connection with your potential investment in a direct lending fund being established by Hermes (the
“Specified Purpose”).

National Westminster Bank plc and Hermes (the “Institutions”) are separate institutions each acting on their own behalf and not as agent or for the benefit of any other person. Nothing in this material is intended to, or shall be deemed to: (i)
establish or represent any partnership or joint venture between the Institutions; (ii) constitute any Institution as the agent of the other Institution; or (iii) constitute any Institution making or entering into any representation, commitment or assurance of
any kind for or on behalf of any other Institution.

Any information in this document which relates to or refers to National Westminster Bank plc and/or its Financial Sponsors business (“National Westminster Bank plc Confidential Information”) is confidential and must not be disclosed in a manner
inconsistent with the Specified Purpose. Where you have entered into a confidentiality agreement with Hermes in respect of this document and/or the National Westminster Bank plc Confidential Information you must comply at all times with the
terms of any such confidentiality agreement(s) and the use restrictions therein.

This document does not constitute an offer or invitation by National Westminster Bank plc in respect of the Specified Purpose or any financing or any other sale or purchase of securities. The National Westminster Bank plc Confidential Information
is not intended for distribution to, or use by any person or entity in any jurisdiction or country where such distribution or use would be contrary to local law or regulation and must not be reproduced or disclosed (in whole or in part) to any other
person without our prior written consent.

The National Westminster Bank plc Confidential Information is not and does not purport to be comprehensive and we have no obligation to update it. Any information in this document provided by National Westminster Bank plc has not been
verified independently. The National Westminster Bank plc Confidential Information is provided on a strictly non-reliance basis and should not be relied upon as the basis for an investment decision. In compiling the National Westminster Bank plc
Confidential Information we have relied upon and assumed, without verification, the accuracy and completeness of all information available to us. No representation or warranty, express or implied, is or will be made and no responsibility or liability is
or will be accepted by National Westminster Bank plc or any of its affiliates or by any of its respective officers, employees or agents in relation to the accuracy or completeness of any part of this document or any other written or oral information
made available to you, your affiliates, connected companies, employees or advisers (and any such liability is expressly disclaimed). In particular, but without prejudice to the generality of the foregoing, no representation or warranty is given as to the
achievement or reasonableness of any returns, projections, estimates, valuations or prospects contained in any part of this document or in such other written or oral information.

The Recipient acknowledges and agrees that no person has, nor is held out as having any authority to give any statement, warranty, representation, or undertaking on behalf of National Westminster Bank plc in respect of the National Westminster
Bank plc Confidential Information. We give no undertaking to provide the Recipient with access to any additional information, to determine the accuracy or reasonableness of information or assumptions, to update this document or any additional
information, or to correct any inaccuracies in it which may become apparent. Any views expressed in this document in respect of National Westminster Bank plc Confidential Information (including statements or forecasts) constitute the judgment of
National Westminster Bank plc as of the date given and are subject to change at any time without notice (continued).
National Westminster disclaimer (continued)

You are solely responsible for compliance with law and regulations which may apply to this document and the Specified Purpose in jurisdictions applicable to you and your affiliates. This document does not constitute an offer to sell or an invitation
to purchase securities in any jurisdiction. The National Westminster Bank plc Confidential Information is not to be construed as legal, tax, regulatory, accounting, investment or business advice, and is not intended to form the basis of any
investment decision. You should consult your own advisers on such matters as you deem appropriate.

This document is provided to you on the basis that you understand that National Westminster Bank plc is not providing you with any "investment advice" within the meaning of Article 53 of the FSMA 2000 (Regulated Activities) Order 2001 and as a
result, National Westminster Bank plc is under no obligation to assess the suitability of the information provided in light of your knowledge and experience, financial situation and/or investment objectives. A consequence of the above is that National
Westminster Bank plc will not provide you with advice on the merits of buying, selling, subscribing for or underwriting (or exercising rights to acquire, dispose of or underwrite) any particular investment instrument. As such, you acknowledge that
you are capable of interpreting the information provided in this document and using that information to take decisions as regards the merits of investing in particular investment instruments.

By accepting this document, you agree to be bound by the foregoing limitations.

National Westminster Bank Plc. Registered in England & Wales No. 929027. Registered Office: 135 Bishopsgate, London EC2M 3UR. National Westminster Bank Plc is authorised by the Prudential Regulation Authority, and regulated by the
Financial Conduct Authority and the Prudential Regulation Authority.

The Royal Bank of Scotland plc. Registered in Scotland No. 83026. Registered Office: 36 St Andrew Square, Edinburgh EH2 2YB. The Royal Bank of Scotland plc is authorised by the Prudential Regulation Authority and regulated by the Financial
Conduct Authority and the Prudential Regulation Authority.

The Royal Bank of Scotland plc and National Westminster Bank Plc are authorised to act as agent for each other.
You can also read