Satellite altimetry detection of ice-shelf-influenced fast ice
←
→
Page content transcription
If your browser does not render page correctly, please read the page content below
The Cryosphere, 15, 4099–4115, 2021
https://doi.org/10.5194/tc-15-4099-2021
© Author(s) 2021. This work is distributed under
the Creative Commons Attribution 4.0 License.

Satellite altimetry detection of ice-shelf-influenced fast ice
Gemma M. Brett1 , Daniel Price1 , Wolfgang Rack1 , and Patricia J. Langhorne2
1 Gateway   Antarctica, University of Canterbury, Christchurch, New Zealand
2 Department  of Physics, University of Otago, Dunedin, New Zealand

Correspondence: Gemma M. Brett (gemma.brett@canterbury.ac.nz)

Received: 1 October 2020 – Discussion started: 22 October 2020
Revised: 10 May 2021 – Accepted: 9 July 2021 – Published: 26 August 2021

Abstract. The outflow of supercooled Ice Shelf Water from        1   Introduction
the conjoined Ross and McMurdo ice shelf cavity augments
fast ice thickness and forms a thick sub-ice platelet layer in
McMurdo Sound. Here, we investigate whether the CryoSat-         Ice shelves are the floating extension of the grounded Antarc-
2 satellite radar altimeter can consistently detect the higher   tic ice sheet and buttress the flow of the grounded ice streams
freeboard caused by the thicker fast ice combined with the       (Fürst et al., 2016). Ice shelves and outlet glaciers comprise
buoyant forcing of a sub-ice platelet layer beneath. Free-       74 % of the Antarctic coastline (Bindschadler et al., 2011),
boards obtained from CryoSat-2 were compared with 4 years        presenting an enormous interface where the ocean can di-
of drill-hole-measured sea ice freeboard, snow depth, and sea    rectly interact with the grounded ice sheet. Ocean-driven
ice and sub-ice platelet layer thicknesses in McMurdo Sound      basal melting near the grounding zones of outlet glaciers and
in November 2011, 2013, 2017 and 2018. The spatial dis-          the frontal zones of large ice shelves drives half of the net
tribution of higher CryoSat-2 freeboard concurred with the       mass loss of ice shelves (Rignot et al., 2013; Depoorter et al.,
distributions of thicker ice-shelf-influenced fast ice and the   2013). Cold and relatively fresh meltwater from ice shelves
sub-ice platelet layer. The mean CryoSat-2 freeboard was         reduces the temperature and the density of the upper surface
0.07–0.09 m higher over the main path of supercooled Ice         ocean, stabilising the upper water column and enhancing the
Shelf Water outflow, in the centre of the sound, relative to     thickness of sea ice near ice shelves (Hellmer, 2004; Gough
the west and east. In this central region, the mean CryoSat-     et al., 2012; Purdie et al., 2006).
2-derived ice thickness was 35 % larger than the mean drill-        Fast ice is attached to the coast via land, ice shelves,
hole-measured fast ice thickness. We attribute this overesti-    glacier tongues or between shoals or grounded icebergs
mate in satellite-altimeter-obtained ice thickness to the ad-    (Massom et al., 2010). When fast ice attaches to ice shelves
ditional buoyant forcing of the sub-ice platelet layer which     or outlet glaciers it forms an important interface between the
had a mean thickness of 3.90 m in the centre. We demon-          ice sheet and open ocean/pack ice (Giles et al., 2008; Mas-
strate the capability of CryoSat-2 to detect higher Ice Shelf    som et al., 2018). Fast ice affects ice sheet mass balance
Water-influenced fast ice freeboard in McMurdo Sound. Fur-       by providing mechanical stability and by buttressing glacier
ther development of this method could provide a tool to iden-    tongues (Massom et al., 2010) and ice shelves from the im-
tify regions of ice-shelf-influenced fast ice elsewhere on the   pacts of ocean swell (Massom et al., 2018).
Antarctic coastline with adequate information on the snow           Coastal polynyas play a critical role in transporting heat
layer.                                                           energy from the ocean surface to the Antarctic ice sheet mar-
                                                                 gin in the grounding zones of ice shelves and outlet glaciers
                                                                 (Silvano et al., 2018). Sea ice formation and brine rejection
                                                                 within coastal polynyas form a highly saline and dense water
                                                                 mass called High Salinity Shelf Water (HSSW) (Ohshima et
                                                                 al., 2016). HSSW is maintained at the surface freezing tem-
                                                                 perature (∼ −1.9 ◦ C) (Foldvik et al., 2004) and is sufficiently
                                                                 dense to circulate at depth into the cavities of adjacent outlet

Published by Copernicus Publications on behalf of the European Geosciences Union.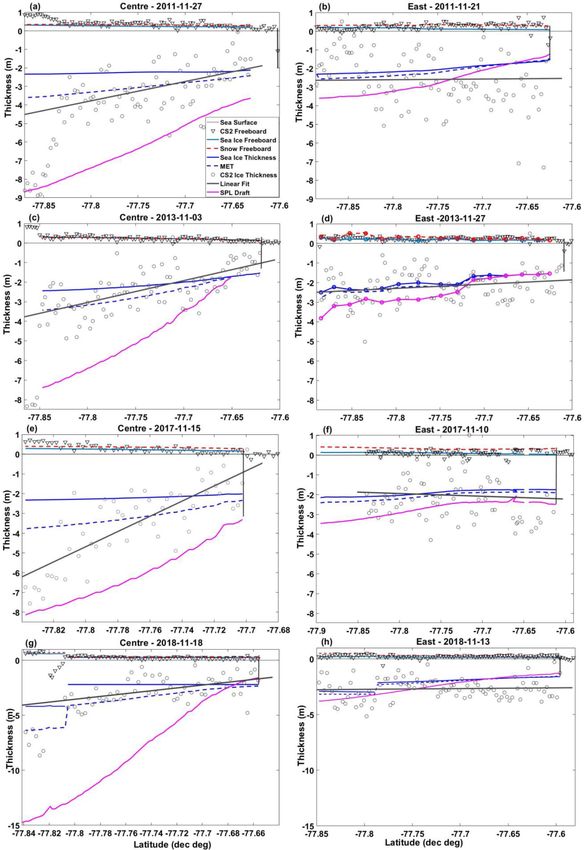
4100                                            G. M. Brett et al.: Satellite altimetry detection of ice-shelf-influenced fast ice

glaciers and ice shelves where it can drive basal melting in
the grounding zone (Jacobs et al., 1992) forming Ice Shelf
Water (ISW) (Macayeal, 1984). ISW is characterised as be-
ing potentially supercooled (i.e. potential temperature below
the surface freezing point) (Jacobs et al., 1985) and can rise
in buoyant plumes along the base of ice shelves (Jenkins and
Bombosch, 1995).
   As ISW rises from depth, it can become in situ super-
cooled (Foldvik and Kvinge, 1974; Jenkins and Bombosch,
1995) (henceforth referred to as “supercooled” for brevity),
and frazil ice crystals can form (Holland and Feltham, 2005).
The frazil ice can grow into larger platelet ice crystals
(Langhorne et al., 2015; Leonard et al., 2011; Smith et al.,
2001) which can freeze into the base of nearby sea ice to
form consolidated platelet ice (Smith et al., 2012; Smith et
al., 2001). The consolidation of platelet ice augments sea ice      Figure 1. (a) Antarctic inset map showing locations of positive
formation (Eicken and Lange, 1989) and increases the sea ice        occurrences of frazil or platelet ice (adapted from Langhorne et
thickness (Gough et al., 2012; Purdie et al., 2006). An uncon-      al., 2015, and updated by Hoppmann et al., 2020) showing the loca-
                                                                    tion of (b) the McMurdo Sound study area (red square) in the west-
solidated mass of platelet ice crystals called a sub-ice platelet
                                                                    ern Ross Sea with CryoSat-2 tracks from multiple years included
layer (SPL) can form beneath the sea ice once the conductive
                                                                    in the analysis in Table 1 and Figs. 3 and 4 for the west (three
heat flux from the sea ice to the atmosphere becomes suf-           tracks) (grey), centre (seven tracks) (blue) and east (four tracks)
ficiently low or the supply of frazil and platelet ice crystals     (red) displayed on a spline-interpolated map of drill-hole-measured
becomes abundant enough to overtake thermodynamic sea               SPL thickness in November 2013 (satellite image: NASA MODIS,
ice growth (Dempsey et al., 2010; Hoppmann et al., 2015;            19 November 2013).
Gough et al., 2012). The signature of in situ supercooled ISW
can thus be identified from thicker sea ice with incorporated
platelet ice and by the presence of an unconsolidated SPL           reaches the upper surface ocean in McMurdo Sound (Hughes
(Langhorne et al., 2015).                                           et al., 2014; Lewis and Perkin, 1985; Mahoney et al., 2011;
   In addition to the thicker ice-shelf-influenced sea ice, the     Robinson et al., 2014) where it significantly influences fast
buoyant forcing of the SPL increases the sea ice freeboard          ice formation and forms a thick SPL.
(i.e. the height of the sea ice surface above sea level) (Gough        The outflow of supercooled ISW from the McMurdo Ice
et al., 2012; Price et al., 2014). Sea ice thicknesses obtained     Shelf cavity augments fast ice formation (Robinson et al.,
through satellite altimetry assumed to represent consolidated       2014), fast ice thickness (Gough et al., 2012; Langhorne
sea ice thickness are consequently overestimated (Price et al.,     et al., 2015; Leonard et al., 2006) and forms a thick SPL
2014). The magnitude of the SPL buoyancy is dependent on            in McMurdo Sound (Dempsey et al., 2010; Gough et al.,
the thickness of the layer and the solid ice fraction, i.e. the     2012; Langhorne et al., 2015). In the central-western region
fraction of solid ice per unit volume (Price et al., 2014). The     of the sound, a consistent yearly pattern of thicker ice-shelf-
buoyant forcing of a SPL with a thickness of 1 m and a solid        influenced fast ice with a substantial SPL (Fig. 1b) beneath
fraction of 0.25 has the potential to induce a 1–2 cm increase      has been observed in proximity to the ice shelf margin in
in freeboard height for typical first-year fast ice in McMurdo      multiple studies (e.g. Brett et al. 2020; Price et al., 2014).
Sound (Gough et al., 2012).                                         This pattern is driven by the outflow of supercooled ISW
   The conditions of ice shelf geometry and sub-ice shelf cir-      from the centre and west of the McMurdo Ice Shelf cavity
culation required for ISW to reach the upper surface ocean          and its subsequent circulation along the Victoria Land coast-
are not satisfied at all ice shelves (Langhorne et al., 2015),      line (Hughes et al., 2014; Lewis and Perkin, 1985; Robin-
and the distribution of ice shelf meltwater in the Southern         son et al., 2014). The effect of supercooled ISW is most
Ocean is not well known (Kusahara and Hasumi, 2014).                pronounced within ∼ 30 km of McMurdo Ice Shelf (Brett et
Langhorne et al. (2015) collated observations of frazil and         al., 2020; Hughes et al., 2014) but could extend up to 200–
platelet ice in the upper surface ocean in Antarctic coastal        250 km north (Stevens et al., 2009; Hughes et al., 2014). ISW
regions and found positive occurrences where the water tem-         circulation has been modelled to increase fast ice growth by
perature at 200 m depth was less than 0.5 ◦ C above the sur-        9 ± 4 cm yr−1 100 km north of the ice shelf edge (Hughes
face freezing point (refer to Fig. 1a for a map of locations        et al., 2014). Indeed, thicker ice-shelf-influenced fast ice
updated by Hoppmann et al., 2020). In the western Ross Sea,         (> 2 m) and SPLs (0.1–0.2 m) were measured in drill holes
an interactive system is at play between coastal polynyas, the      ∼ 85 km north of the McMurdo Ice Shelf in 2013, 2016 and
conjoined McMurdo and Ross Ice Shelf, and fast ice in the           2017 (Brett et al., 2020; Price et al., 2014). Brett et al. (2020)
field study area in McMurdo Sound (Brett et al., 2020). ISW         demonstrated a correlation of SPL thickness and volume in

The Cryosphere, 15, 4099–4115, 2021                                                     https://doi.org/10.5194/tc-15-4099-2021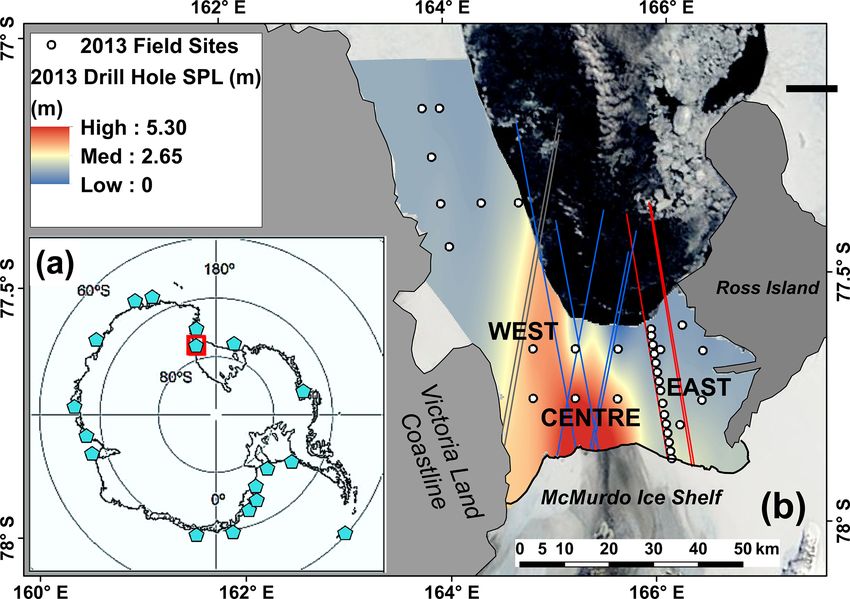
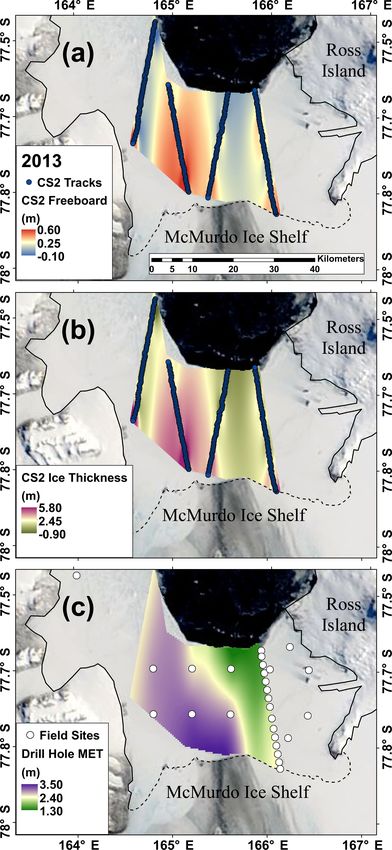
G. M. Brett et al.: Satellite altimetry detection of ice-shelf-influenced fast ice                                            4101

McMurdo Sound in late spring with a higher frequency of             equilibrium. Fast ice thicknesses derived from sea ice free-
strong southerly wind events in the western Ross Sea which          board in McMurdo Sound were overestimated on average by
drive polynya activity, HSSW production, and ISW forma-             12 % and up to 19 % primarily due to the buoyancy effect
tion and circulation within the McMurdo–Ross Ice Shelf cav-         of the SPL. Price et al. (2015) developed the method applied
ity over winter.                                                    in this study to assess CS2 fast ice freeboard in McMurdo
   Given the difficulty of accessing fast ice in Antarctic          Sound in 2011 and 2013, and the relevance of this work to
coastal regions and the logistical constraints of carrying out      this study is described in more detail in Sect. 2.2.
field observations with ground-based methods, it is possible           For the first time, we investigate whether the CS2 satel-
that other unobserved regions are influenced by the outflow         lite radar altimeter can detect the influence of ISW on fast
of ISW in the upper surface ocean. A means to identify these        ice in McMurdo Sound by consistently identifying the higher
regions in large-scale satellite assessments is highly desirable    ice freeboard caused by thicker ice-shelf-influenced fast ice
and, if effective, has the potential to provide a satellite-based   and the buoyant forcing of the SPL beneath. Multiple years
method to monitor the interactive system at play between the        of field observations and a highly detailed knowledge of
atmosphere, coastal polynyas and circulation within ice shelf       the spatial distributions of snow, fast ice and SPL thick-
cavities with further development. The detection of ISW in-         nesses, and the circulation of the supercooled ISW recom-
fluence on fast ice via satellite altimetry is in theory possible   mend McMurdo Sound as an ideal location for this study.
through the identification of regions with higher freeboard         CS2 measurements of freeboard obtained using a supervised
driven by thicker ice-shelf-influenced sea ice and, if present,     retrieval procedure were compared with 4 years of drill-hole-
the buoyant forcing of a SPL (Price et al., 2014), which to         measured freeboard, fast ice and SPL thickness, and snow
date has not been assessed.                                         depth over the fast ice in McMurdo Sound. We assess and
   The pulses emitted from satellite laser altimeters reflect       compare spatial trends in CS2 freeboard and CS2 ice thick-
from the ice–air or snow–air interface and thus measure             ness in a region with significant ISW influence (centre) and
the height of the sea ice freeboard plus the addition of a          another region with less pronounced ISW influence (east)
snow layer, if present (henceforth referred to as snow free-        (Fig. 4). We describe the study area and in situ datasets, and
board). Microwave radar waveforms emitted from satellite            we summarise the technical specifications of the CS2 satellite
radar altimeters penetrate into the snow layer. The penetra-        radar altimeter and CS2 data product in Sect. 2. We describe
tion depth of radar waves into the snow layer is dependent on       the methods applied in Sect. 3 and the results in Sect. 4.
the backscattering properties of the snow (Kwok, 2014; Price        In Sect. 5, we discuss the results and provide an outlook
et al., 2015; Willatt et al., 2011). The dominant backscatter-      for satellite altimetry assessments of ice-shelf-influenced fast
ing surface for radar waveforms can thus be some uncon-             ice.
strained interface between the top of the snow and the sea ice
freeboard (Price et al., 2015; Price et al., 2019).
   Satellite altimetry assessments of fast ice freeboard have       2     Study area and datasets
previously been carried out in McMurdo Sound with the
ICESat-1 laser altimeter (Price et al., 2013) and the CryoSat-      2.1    Ground validation with drill hole measurements
2 (CS2) radar altimeter (Price et al., 2015, 2019). In the
ICESat-1 study, a peak in multi-year snow freeboard, cen-           McMurdo Sound is geographically delineated by the Victo-
tred around longitude 165◦ E, was observed in the south of          ria Land coastline in the west, Ross Island in the east and
McMurdo Sound between 2003 and 2009, when ocean circu-              the McMurdo Ice Shelf in the south (Fig. 1). The fast ice in
lation in the region was altered by the passage of large tabular    McMurdo Sound is predominately smooth and undeformed
icebergs (Robinson and Williams, 2012). The peak in multi-          first-year ice that typically forms between April and Decem-
year fast ice snow freeboard coincided with the thickest SPL        ber and then breaks out in the following summer (Kim et al.,
and the main path of ISW outflow. Substantial multi-year fast       2018). Ground validation for the CS2-measured freeboard
ice thicknesses (∼ 10–55 m) measured with ICESat-1 beside           and derived ice thickness was provided by extensive drill
the Mertz Glacier Tongue was proposed to be augmented by            hole measurements made at field sites distributed at ∼ 5–
supercooled ISW and basal accretion of marine ice (Massom           10 km spacing on the fast ice in McMurdo Sound in Novem-
et al., 2010).                                                      ber 2011, 2013, 2017 and 2018. At each site, five drill holes
   The SPL contribution to satellite-altimeter-derived fast ice     were made in the sea ice at the centre and end points of two
thickness in McMurdo Sound was quantified using surface             30 m cross-profile lines. Sea ice freeboard, snow depth, and
elevation measurements obtained with a Global Navigation            the thicknesses of sea ice and the SPL were measured at each
Satellite System (GNSS) rover (Price et al., 2014). GNSS            drill hole using the technique described in Price et al. (2014)
surface elevation (calibrated to local sea level) is analo-         and then averaged to give a representative value over the 30 m
gous to satellite-altimeter-measured snow freeboard and was         by 30 m area.
thus a comparable means to assess the effects of the SPL               In 2011 and 2018, measurements were respectively made
on freeboard-to-thickness conversion assuming hydrostatic           at 43 (Langhorne et al., 2021a) and 14 (Brett et al., 2021)

https://doi.org/10.5194/tc-15-4099-2021                                                  The Cryosphere, 15, 4099–4115, 2021
4102                                           G. M. Brett et al.: Satellite altimetry detection of ice-shelf-influenced fast ice

sites distributed over an area of ∼ 1500 km2 in the south of       Murdo Sound in late spring. Multiple ice core studies carried
McMurdo Sound. Fast ice in the northwest was additionally          out in the region over winter and in late spring revealed no
assessed in 2013 and 2017 with 34 (Rack et al., 2021) and 21       contribution of meteoric ice to the fast ice cover in McMurdo
(Langhorne et al., 2021b) sites, respectively, distributed over    Sound (e.g. Dempsey et al., 2010; Gough et al., 2012).
an area of ∼ 3000 km2 . Interpolated maps of snow depth, fast         A combined mass equivalent thickness (MET) was calcu-
ice and SPL thicknesses, and sea ice and snow freeboard at         lated according to Price et al. (2019) to sum the consolidated
field sites were generated for each year. In multiple field sea-   sea ice thickness and the unconsolidated SPL thickness times
sons in McMurdo Sound, we observed smooth gradients in             the solid fraction, i.e. the thickness of the solid mass of ice in
the thickness of sea ice, SPL and the snow layer. We thus          the SPL. It is difficult to physically measure the solid fraction
applied a minimum-curvature (i.e. thin plate) first-derivative     without disturbing the natural state of the SPL. Numerous
spline interpolation which passes through data points and no       methods to indirectly derive the solid fraction of the SPL in
smoothing. Coincident interpolated values for each param-          McMurdo Sound have been applied including the hydrostatic
eter were then extracted for each CS2 measurement point            equilibrium assumption (0.16) (Price et al., 2014) and ther-
along the track. Interpolated drill hole snow and ice freeboard    mistor probe data (0.25) (Gough et al., 2012) with a range
could not capture small-scale variability given that drill hole    values from 0.16 to 0.5 derived (Gough et al., 2012). We as-
measurements were 1–10 km apart. However, it was expected          sumed an intermediary solid fraction value of 0.2 between
that the interpolations would represent the smooth gradients       that derived by Gough et al. (2012) and Price et al. (2014) to
in sea ice, SPL and snow thicknesses observed in McMurdo           calculate MET from the interpolated drill hole measurements
Sound well enough on the large-scale to facilitate a com-          for each year.
parison with the CS2 footprint (∼ 300 m along the track and
∼ 1.5 km across the track).                                        2.2   CryoSat-2 satellite radar altimeter
   Brett et al. (2020) provide a detailed description of the
thickness distributions of ice-shelf-influenced fast ice, the      The principle payload of CS2 is the combined synthetic aper-
SPL and snow in McMurdo Sound in November of 2011,                 ture radar (SAR) and interferometric radar altimeter which
2013 and 2017. Here, we summarise those descriptions to            operates in three modes: (1) low-resolution mode, (2) SAR
show general patterns and also include the fast ice condi-         mode, and (3) combined SAR and interferometer (SARIn)
tions in 2018. The spatial distributions of fast ice and the       mode (Bouzinac, 2012; Wingham et al., 2006). CS2 predom-
SPL were characteristic of McMurdo Sound with thicker              inantly operates in SARIn mode over coastal fast ice regions
ice-shelf-influenced fast ice and a very thick SPL near the        including McMurdo Sound. The number of measurements
McMurdo Ice Shelf in the south, in the main path of ISW            obtained in SARIn mode decreases by a factor of 4 relative
outflow. The fast ice and SPL thinned to the east, north-          to SAR mode (Wingham et al., 2006). Highly specular re-
east and more gradually to the northwest. The SPL distri-          flectors such as leads significantly off-nadir can dominate the
bution observed each year is exemplified in Fig. 1b with a         returning radar echo or “snag” introducing a range error and
spline-interpolated map from drill hole measurements made          an underestimate in surface elevation. However, in SARIn
in November 2013. Higher drill-hole-measured freeboard             mode this range error can be corrected by determining the
concurred with the distributions of thicker fast ice and SPL.      across-track angle to off-nadir returns, and more data can
The snow distribution was consistent each year with more           thus be retained relative to SAR mode (Armitage and David-
substantial deposition in the east and southeast (∼ 0.2–0.4 m)     son, 2014). Depending on the surface geometry and satellite
and a sparse dusting (0–0.10 m) in the centre and west where       orbit, the radar footprint of CS2 is ∼ 300 m along the track
the influence of ISW is greatest. In November 2018, the fast       and ∼ 1.5 km across the track (Wingham et al., 2006).
ice consisted of a 7–15 km wide band of 2-year-old multi-              The ESA Level 2 retracking point is found using a model-
year ice that ran parallel to the McMurdo Ice Shelf in the         fitting approach and is defined relative to the entire echo
south and first-year ice in the north. The SPL beneath the         waveform (Bouzinac, 2012; Price et al., 2015). The domi-
second-year fast ice in 2018 had a maximum thickness of            nant backscattering surface assumed for this retracker is the
11 m near the ice shelf in the south.                              snow–ice interface. However, an assessment of the influence
   In McMurdo Sound, the anomalously higher sea ice free-          of the snow layer on the radar waveform by comparison with
board is driven by the combined upward (positive) buoyancy         coincident in situ measurements of freeboard and snow layer
of the thicker ice-shelf-influenced fast ice and the ice mass      depth in McMurdo Sound by Price et al. (2015) showed that
within the SPL beneath. The addition of a snow layer, if           the ESA retracker tracked between the surface of the snow
present, provides an opposing downward (negative) forcing.         and the snow–ice interface. Price et al. (2019) assessed the
The weight of the snow can depress sea ice freeboard and           sensitivity of sea ice thicknesses derived from the CS2 Level
result in flooding of the sea ice surface and the formation        2 SARIn product to variable penetration depths into the snow
of meteoric ice which can contribute to freeboard (Maksym          layer in McMurdo Sound using the same in situ measure-
and Markus, 2008). Snow-depressed negative freeboard or            ments from late spring November 2011. They found the clos-
surface flooding were not observed at drill hole sites in Mc-      est agreement with in situ measurements when the pene-

The Cryosphere, 15, 4099–4115, 2021                                                    https://doi.org/10.5194/tc-15-4099-2021
G. M. Brett et al.: Satellite altimetry detection of ice-shelf-influenced fast ice                                              4103

tration depth into the snow layer was assumed to be 0.05–           3     Method
0.10 m. In this study, we compare CS2-obtained freeboard
with in situ measurements to identify the best-matching free-       3.1    Supervised CryoSat-2 retrieval of ISW-influenced
board interface or penetration depth for each individual CS2               freeboard
track according to Price et al. (2019).
   Geolocated Baseline C Level 2 SARIn data generated               By assessing individual CS2 track profiles, significant CS2
from the CryoSat-2 ice processor were used for this as-             height outliers (i.e. WGS84 −54 m ≤ CS2 height ≤ −60 m)
sessment. The Level 2 SARIn data product provides a sur-            were identified and removed. Surface elevation was then ob-
face height relative to the WGS84 ellipsoid for each loca-          tained by applying the MSS and all ocean/tidal corrections
tion along the track with geophysical corrections applied to        and then de-trending for the EGM 2008 geoid (refer to Ap-
the range measured by the satellite (Wingham et al., 2006;          pendix A for further information). A supervised retrieval pro-
Bouzinac, 2012). Applied geophysical corrections vary ac-           cedure, according to Price et al. (2015), was applied to obtain
cording to the surface type classification and are described        freeboard from the Level 2 CS2 surface elevations by identi-
in detail with their sources in Bouzinac (2012) and Webb            fying the relative SSH manually with satellite imagery. The
and Hall (2016). Atmospheric propagation corrections (iono-         fast ice edge and open water along the track were identified
spheric and dry/wet tropospheric) are always applied to ac-         in NASA Moderate Resolution Imaging Spectroradiometer
count for the time delay introduced as the altimeter pulse          (MODIS) optical images acquired on the day of the CS2
passes through the Earth’s atmosphere. Satellite-altimeter-         overpass. The relative SSH was defined as the median value
derived surface height must additionally be corrected for the       of the CS2 surface elevation retrievals over 25 km of adjacent
shape of the geoid, tidal height, inverse barometric effect and     open water along the track. The median value was chosen be-
dynamic ocean topography before freeboard can be obtained           cause the mean was skewed by significant noise in the CS2
(Price et al., 2015; Ricker et al., 2016). However, the level       measurement. This distance provided ∼ 80 CS2 surface ele-
of accuracy required for these corrections is difficult to attain   vation measurements to obtain a representative median value
with models. In satellite altimetry sea ice assessments, free-      from the CS2 measurement and was also applied by Price
board is generally determined relative to a local reference         et al. (2015) in their supervised freeboard retrieval. The dis-
sea surface height (SSH) obtained over open water along the         tance on the fast ice to open water did not exceed ∼ 25 km in
satellite track.                                                    all study years.
   The fast ice region in McMurdo Sound is within the sur-             Supervised retrievals of fast ice freeboard were applied to
face type mask of open ocean where ocean surface and tidal          20 CS2 tracks between latitudes 77.4 and 78◦ S in McMurdo
corrections are applied. Ocean surface corrections (sea state       Sound over the 4 study years. CS2 freeboards derived rela-
bias and dynamic atmospheric) account for the effect of the         tive to the median SSH were then compared with coincident
atmosphere on SSH. Tidal corrections (ocean tides and long-         spline-interpolated drill-hole-measured snow and ice free-
period equilibrium tide) are applied to adjust the range so that    boards along the track. Fourteen out of the 20 (70 %) tracks
it appears to originate from the mean tide-free sea surface.        produced CS2 freeboard magnitudes relative to the median
Tidal-induced deformation of the Earth’s crust is accounted         SSH that aligned with the drill hole measurements. The 14
for with the ocean loading, solid Earth and geocentric polar        CS2 tracks consisted of four in the east, seven in the centre
corrections. The mean sea surface (MSS) is a combination            and three in the west (refer to Fig. 1 for regional locations).
of the geoid and the mean dynamic topography and is ac-             Figure 2 shows an along-track profile of spline-interpolated
counted for over open ocean (Ricker et al., 2014; Skourup et        drill-hole-measured sea ice and snow freeboard, as well as
al., 2017). To provide confidence in CS2-derived freeboard,         sea ice and SPL thicknesses and combined MET in the cen-
an assessment of the spatial distribution and magnitude of the      tre of the sound with CS2 freeboard measurements from an
geophysical corrections applied to the CS2 Level 2 SARIn            overpass on the 15 November 2017. CS2 freeboard increased
product and the effect of de-trending for the geoid using the       towards the ice shelf in the south with increasing fast ice and
Earth Gravitational Model 2008 (EGM 2008) (Pavlis et al.,           SPL thicknesses and combined MET.
2012) was carried out over ice-free open ocean in McMurdo              Sea ice thickness (Ti ) was calculated from freeboard as-
Sound in late summer of 2011 to 2017. This is described in          suming hydrostatic equilibrium which asserts that the ratio
detail in Appendix A.                                               of freeboard (Fb) to total ice thickness is proportional to the
                                                                    ratio of the densities of sea ice (ρi ) and seawater (ρw ) (Zwally
                                                                    et al., 2008). The addition of the snow layer (Ts ) to free-
                                                                    board height, the snow density (ρs ) and the buoyancy effect
                                                                    of the SPL, if present, must be taken into account (Price et
                                                                    al., 2014). Constant values for ρw , ρi and ρs of 1027 kg m−3 ,
                                                                    925 and 385 kg m−3 were respectively assumed to facilitate
                                                                    inter-comparison with and to adhere to the rationale and er-
                                                                    ror propagation of Price et al. (2014), where a range of snow

https://doi.org/10.5194/tc-15-4099-2021                                                   The Cryosphere, 15, 4099–4115, 2021
4104 G. M. Brett et al.: Satellite altimetry detection of ice-shelf-influenced fast ice
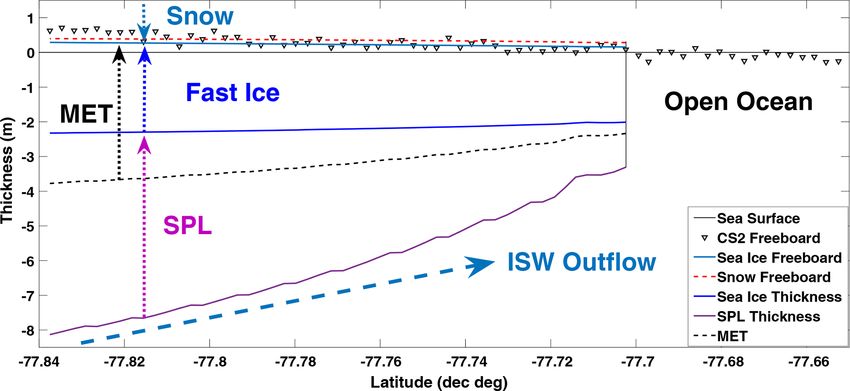
Figure 2. Spline-interpolated drill-hole-measured sea ice and snow freeboard, as well as fast ice, SPL and mass equivalent thicknesses
(METs) relative to the zero-level reference sea surface from November 2017 with CS2 freeboard on the 15 November 2017. The McMurdo
Ice Shelf is located in the south (left-hand side) of this profile at an approximate latitude of −77.84◦ .
and sea ice density measurements made in McMurdo Sound the CS2 ice thickness and drill hole MET was selected ac-
were assessed. cording to Price et al. (2019).
CS2 ice thickness was calculated from CS2 freeboard by The sea ice surface was the dominant freeboard interface
assuming that the dominant backscattering surface for the in the west and centre, except for 2011 and 2017, which
ESA Level 2 retracker is either (1) snow freeboard, (2) sea ice had deeper snow coverage across the sound. In the east, the
freeboard or (3) some penetration factor (Pf) into the snow best-matching freeboard interfaces were the sea ice surface
layer by respectively applying Eqs. (1), (2) and (3) from Price in 2017, the snow surface in 2013, and penetration depths
et al. (2019). A correction for the propagation of the radar of 0.11 and 0.12 m into the snow layer in 2011 and 2018,
wave through the snow layer was applied according to Kurtz respectively. If sea ice freeboard or a penetration depth was
et al. (2014). determined for a CS2 track, a correction for the propagation
of the radar wave through the snow was applied according to
ρw
ρw − ρs
Kurtz et al. (2014).
Ti = Fb − Ts (1)
ρw − ρi ρw − ρi
ρw ρs 4 Results
Ti = Fb + Ts (2)
ρw − ρi ρw − ρi
4.1 Supervised CryoSat-2 retrieval of ISW-influenced
ρw ρw − ρs ρw
Ti = Fb − Ts + Pf (3) freeboard
ρw − ρi ρw − ρi ρw − ρi
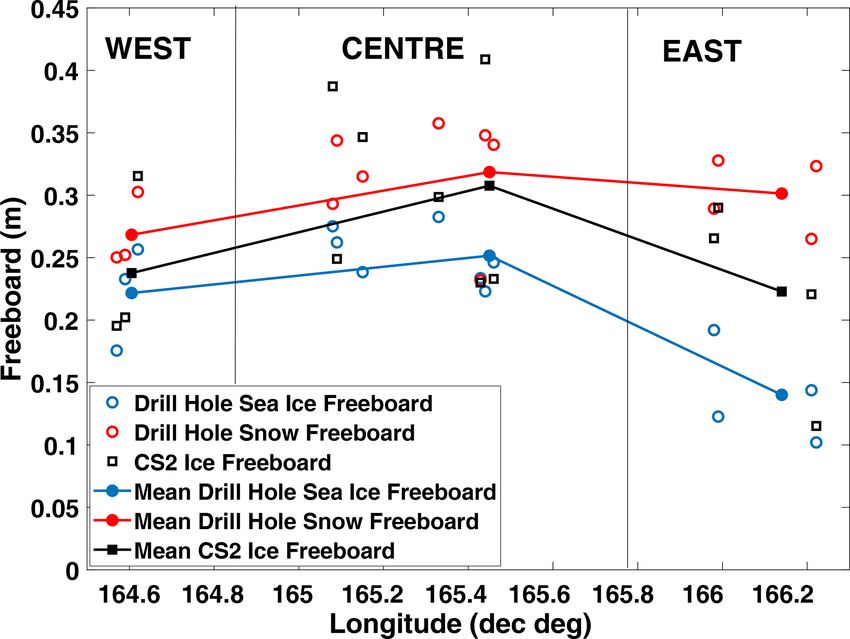
The mean drill hole sea ice and snow freeboards and snow-
To select the best-matching freeboard interface for each corrected CS2 freeboard for first-year fast ice were calculated
track, the profiles of CS2 ice thicknesses obtained from (over equivalent distances) for each CS2 track and then aver-
Eqs. (1) and (2) were compared with interpolated drill hole aged regionally for the three tracks in the west, seven in the
METs along the track. The freeboard interface that produced centre and four in the east (refer to Fig. 3 and Table 1). The
the closest matching CS2 ice thickness and drill hole MET mean regional drill hole sea ice and snow freeboards were
was then selected. This was assessed by (1) comparing along- highest in the centre at 0.25 and 0.32 m, respectively, and
track profiles of interpolated in situ MET with CS2 ice thick- slightly lower in the west at 0.22 and 0.27 m. In the east,
nesses visually (this was evident if the best interface was sea the mean drill hole sea ice and snow freeboards were 0.14
ice or snow freeboard), (2) linear regression analyses (if there and 0.30 m, respectively. The mean regional CS2 freeboard
was a gradient in freeboard with increasing fast ice and SPL followed the same trend of higher freeboard in the centre
thickness) or (3) comparing mean values along the track ac- (0.31 m), decreasing to the west (0.24 m) and east (0.22 m).
cording to Price et al. (2019). For two tracks in the east, nei- In the centre of McMurdo Sound, we estimate a mean CS2-
ther snow freeboard (Eq. 1) nor sea ice freeboard (Eq. 2) pro- derived freeboard difference of 0.07 and 0.09 m relative to
duced aligning drill hole MET and CS2 ice thickness profiles, the west and east, respectively. This difference is 28 %–36 %
and thus variable penetration depths were applied in 0.01 m of the mean drill-hole-measured sea ice freeboard. The re-
increments (Eq. 3). The penetration factor which produced gional mean interpolated drill hole sea ice, SPL thicknesses
the smallest mean difference (summed along track) between and combined MET of the seven CS2 tracks in the centre
The Cryosphere, 15, 4099–4115, 2021 https://doi.org/10.5194/tc-15-4099-2021G. M. Brett et al.: Satellite altimetry detection of ice-shelf-influenced fast ice 4105
Table 1. Mean interpolated drill hole (DHint ) measured sea ice and
snow freeboards (Fb) and CS2 freeboards for first-year fast ice only
(over equivalent distances) for individual CS2 tracks in the west,
centre and east. Regional mean values for tracks in the west, centre
and east are given, and these statistics are used in Figs. 3 and 4. If
sea ice freeboard or a penetration depth was determined for a CS2
track, a correction for the propagation of the radar wave through the
snow was applied according to Kurtz et al. (2014).
CS2 track ID Mean DHint Mean DHint Mean CS2
(yyyymmdd) sea ice Fb (m) snow Fb (m) Fb (m)
West
20171117 0.18 ± 0.01 0.25 ± 0.01 0.20 ± 0.23
20131105 0.23 ± 0.00 0.25 ± 0.01 0.20 ± 0.14
20181120 0.26 ± 0.00 0.30 ± 0.00 0.32 ± 0.14
Figure 3. Comparison of all drill-hole-measured sea ice and snow Regional mean 0.22 0.27 0.24
freeboards with CS2 freeboard over first-year fast ice only for the Centre
three tracks in the west, seven in the centre and four in the east
(refer to Fig. 1 for locations and values given in Table 1). The mean 20131129 0.28 ± 0.03 0.29 ± 0.00 0.39 ± 0.11
regional values for the tracks in the west, centre and east are shown 20111123 0.26 ± 0.03 0.34 ± 0.00 0.25 ± 0.12
with a solid line to illustrate the mean freeboard distribution across 20111127 0.24 ± 0.03 0.32 ± 0.03 0.35 ± 0.12
McMurdo Sound. The longitudes are taken from where each CS2 20181115 0.28 ± 0.01 0.36 ± 0.02 0.30 ± 0.16
track crossed latitude 77.7◦ S. 20131103 0.23 ± 0.05 0.23 ± 0.05 0.23 ± 0.11
20171115 0.22 ± 0.04 0.35 ± 0.03 0.41 ± 0.18
20181118 0.25 ± 0.14 0.34 ± 0.14 0.23 ± 0.12
of McMurdo Sound were 2.26 m, 3.90 m and 3.08 m, respec- Regional mean 0.25 0.32 0.31
tively. The mean CS2 ice thickness for these seven tracks
East
was 3.04 m, corresponding to a 0.78 m overestimate relative
to the drill-hole-measured sea ice thickness in this region. 20131127 0.19 ± 0.04 0.29 ± 0.10 0.27 ± 0.11
The regional mean snow depth in the centre was 0.07 m over 20111121 0.12 ± 0.04 0.33 ± 0.02 0.29 ± 0.21
the 4 study years. We interpret the CS2 freeboard distribu- 20181113 0.14 ± 0.01 0.27 ± 0.04 0.22 ± 0.13
tion across the main path of supercooled ISW outflow as 20171110 0.10 ± 0.03 0.32 ± 0.03 0.12 ± 013
being largely due to the thickness change of the ice-shelf- Regional mean 0.14 0.30 0.22
influenced fast ice with a SPL beneath rather than due to gra-
dients in snow thickness.
Along-track profiles of CS2 freeboard and CS2 ice thick-
ness are compared in the centre and east with interpolated and 2017 (Fig. 4e), CS2 freeboard was higher near the Mc-
drill hole measurements for 2011, 2013, 2017 and 2018 in Murdo Ice Shelf in the centre of the sound, and this could
Fig. 4. Linear fits to CS2 ice thicknesses are shown with in- be attributed to the thicker SPLs or the deeper and more-
terpolated drill hole sea ice and SPL thicknesses, MET, and wind-compacted snow observed in these years by Brett et
sea ice and snow freeboard. The linear fits were applied to al. (2020). In 2011, no drill hole measurements were made
CS2 ice thickness obtained over first-year ice only and did south of latitude −77.83◦ on the centre profile (Fig. 4a), and
not include second-year ice. The linear fits applied to CS2 we were unable to determine why the first-year fast ice free-
ice thickness show increasing trends towards the ice shelf in board was significantly higher near the McMurdo Ice Shelf.
the centre for all years, in contrast to the east, which had flat CS2 freeboard measured south of −77.83◦ on this track was
to marginal gradients in CS2 ice thickness. thus excluded from the calculation of the mean value (Ta-
Over the main supercooled ISW outflow region in the cen- ble 1).
tre of the sound, CS2 freeboard and CS2 ice thickness in- In 2013, the CS2 track in the centre (Fig. 4c) on 3 Novem-
creased towards the ice shelf in the south concurrently with ber had minimal snow coverage and best matched with sea
increasing fast ice and SPL thicknesses and combined MET ice freeboard. The CS2 track in the east (Fig. 4d) on 27
(Fig. 4a, c, e and g). In comparison, CS2 freeboard and November 2013 had deeper snow and best matched with
CS2 ice thickness in the east where the influence of ISW is snow freeboard. The drill hole measurements made every
less pronounced showed a marginal increase towards the ice kilometre along the CS2 track in the east on 27 November
shelf in 2013 (Fig. 4d) and almost flat profiles in 2011, 2017 2013 by Price et al. (2015) are shown in this profile (Fig. 4d).
and 2018 (Fig. 4b, f, and h respectively). In 2011 (Fig. 4a) The increasing trend towards the McMurdo Ice Shelf is evi-
https://doi.org/10.5194/tc-15-4099-2021 The Cryosphere, 15, 4099–4115, 20214106 G. M. Brett et al.: Satellite altimetry detection of ice-shelf-influenced fast ice Figure 4. Comparison of along-track profiles of CS2 freeboard and CS2 ice thickness in the centre (a, c, e and g) and east (b, d, f and h) for 2011, 2013, 2017 and 2018. The McMurdo Ice Shelf is located in the south (left) of all profiles. Linear fits applied to CS2 ice thickness (over first-year ice only) are shown with interpolated drill hole sea ice and SPL thicknesses, MET, and sea ice and snow freeboard. A drill hole validation line was carried on along the eastern CS2 track on the 27 November 2013 by Price et al. (2015), and drill-hole-measured snow and sea ice freeboard, sea ice and SPL thickness, and MET are included in panel (d) (circles). The Cryosphere, 15, 4099–4115, 2021 https://doi.org/10.5194/tc-15-4099-2021
G. M. Brett et al.: Satellite altimetry detection of ice-shelf-influenced fast ice                                                 4107

dent in both the CS2 freeboard and CS2 ice thickness on the
2013 central profile when compared to the 2013 eastern pro-
file, most markedly over second-year ice in the southwest of
the sound (77.85–77.87◦ S) in Fig. 4c.
   To assess the spatial distributions of higher satellite-
altimeter-obtained freeboard and resultant thicker ice, CS2
freeboard and CS2 ice thickness from four tracks distributed
across McMurdo Sound in November 2013 were spline in-
terpolated. To circumvent substantial noise in CS2 freeboard
and derived ice thickness, a running mean of three mea-
surements (corresponding to ∼ 1 km) was applied along the
track prior to applying the interpolation. Figure 5 shows
maps of the distributions of CS2 freeboard, CS2 ice thick-
ness and drill-hole-measured MET in McMurdo Sound in
November 2013. CS2 freeboard height (Fig. 5a) and CS2
ice thickness (Fig. 5b) concurred with the thickness distri-
butions of drill-hole-measured ice-shelf-influenced fast ice,
SPL (Fig. 1) and combined MET (Fig. 5c) with higher free-
boards and ice thicknesses observed in the central-western
region of the sound in the main path of supercooled ISW
outflow. The trend of increasing CS2 freeboard and CS2 ice
thickness towards the McMurdo Ice Shelf in the centre and
west is evident.

5     Discussion

5.1    Geophysical corrections and identification of a
       relative sea surface height

The proximity of fast ice to the coastline can introduce un-
certainty in surface elevation retrievals from satellite altime-
try. This uncertainty is caused by increased complexity of the
geoid near the continental landmass and by the interaction of
the tides with the coastline and shallow bathymetry of the
continental shelves. These factors are particularly relevant in
McMurdo Sound. The mountainous terrain to the east and
west and the ice shelf to the south affect the shape of the
geoid. To ensure that the trends observed in CS2 freeboard
did not result from inaccuracies in the geophysical correc-
tions, an assessment of the spatial distribution and magni-
tude of the geophysical corrections applied to the CS2 Level
2 SARIn product and the effect of de-trending for the geoid
using the EGM 2008 was carried out over open ocean in late
summer. Additionally, 4 years of in situ measurements over         Figure 5. CS2 freeboard was higher and CS2 ice thickness greater
                                                                   where supercooled ISW outflows in McMurdo Sound. Spline-
fast ice in late spring provided confidence in the CS2 Level
                                                                   interpolated maps of the distributions of (a) CS2 freeboard, (b) CS2
2 SARIn product and applied geophysical corrections. The
                                                                   ice thickness from four tracks over first-year fast ice and (c) inter-
remaining uncertainty in the CS2 freeboard captured in the         polated drill hole MET measured at field sites in November 2013.
standard deviations in Table 1 is likely driven by noise in the    A running mean of three CS2 freeboard and CS2 ice thickness mea-
CS2 measurement and variability in the snow layer and the          surements (corresponding to ∼ 1 km) was applied along the track
dominant backscattering interface along the track.                 prior to applying the interpolation in panels (a) and (b) (satellite
   The geophysical corrections should not have a major im-         image: NASA MODIS, 19 November 2013).
pact on the obtained CS2 freeboard if the retrieval of the rel-
ative SSH is robust (Ricker et al., 2016). Identifying the rel-
ative SSH along the track is complicated by interference and

https://doi.org/10.5194/tc-15-4099-2021                                                    The Cryosphere, 15, 4099–4115, 2021
4108 G. M. Brett et al.: Satellite altimetry detection of ice-shelf-influenced fast ice
noise introduced by sea surface conditions and by the pres- board and interpolated drill hole sea ice and snow freeboard
ence of pack ice. We observed thin nilas or some pack ice for each individual track. Importantly, our analyses compared
beneath several CS2 tracks. However, sea surface conditions linear trends and spatial patterns in CS2 ice thickness with re-
will have a more significant effect for automatic freeboard spect to interpolated in situ-measured fast ice and SPL thick-
retrievals which interpret the backscatter or pulse peakiness nesses, as well as their combined MET as opposed to abso-
of the returning signal to identify open water (Price et al., lute values.
2015). To ensure minimum error in the relative SSH, we ap- In the west and centre, the sea ice surface was the dom-
plied a supervised freeboard retrieval procedure where open inant freeboard interface, except in years with deeper snow
water was manually identified in satellite imagery. The dis- coverage. In the east, the best-matching freeboard horizon
tance on the fast ice to open water did not exceed ∼ 25 km was variable from year to year and ranged from the snow
in all study years. We used in situ measurements to assess surface to the sea ice surface or a mid-depth penetration. The
the accuracy of the relative SSH identification by compar- mid-depth penetration into the snow in 2011 and 2018 agreed
ing the magnitude of the resultant CS2 freeboards against with the dominant ESA Level 2 backscattering horizon iden-
drill-hole-measured freeboard. Additionally, we assessed lin- tified between the surface of the snow and the sea ice in Price
ear and spatial trends in CS2 freeboard and CS2 ice thickness et al. (2015) and is comparable to the upper limit penetration
in this study, e.g. Figs. 4 and 5. Any error in the relative sea depth of 0.05–0.10 m estimated across the sound by Price et
surface height should have minimum effect on the trends be- al. (2019) in November 2011.
cause a constant median SSH value is subtracted from CS2 This general pattern reflects the distribution and composi-
surface elevation measurements to obtain CS2 freeboard for tion of the snow in McMurdo Sound. The snow in the east
each individual track. However, for automated freeboard re- was generally deeper, more densely packed and wind com-
trievals and for regions of coastal sea ice without in situ mea- pacted relative to the centre and west where the snow was
surements or open water nearby, poor identification of the sparse and loosely packed and where full penetration of the
relative SSH could introduce significant error and bias in the radar wave would more likely occur. The contrasting distri-
CS2-derived freeboard. butions in the snow and thicker ISW-influenced fast ice and
SPL from east to west were advantageous. We had confi-
5.2 Satellite-altimeter-measured freeboard and sea ice dence that the trends of higher freeboard and thicker CS2-
thickness obtained ice thickness observed in the centre relative to the
east did not result from the addition of the snow layer to ice
The assumed freeboard interface will significantly affect the freeboard which would have a more significant effect in the
resultant sea ice thickness obtained from the hydrostatic east.
equilibrium equations. The calculated CS2 ice thickness will The freeboard-to-thickness conversion will also be af-
be overestimated if sea ice freeboard is assumed and full pen- fected by applying constant values for the density of sea ice,
etration of the radar wave into the snow layer does not occur. snow and seawater. However, error propagation analyses of
Alternatively, calculated CS2 sea ice thickness will be un- the effects of the density values of sea ice, snow and seawater
derestimated if snow freeboard is assumed and full or partial in the hydrostatic equilibrium equation carried out by Price et
penetration of the radar wave into the snow layer does oc- al. (2013, 2014) found that the assumed freeboard interface
cur. Price et al. (2019) found that the sea ice thicknesses in contributed the greatest error in the derived ice thickness.
McMurdo Sound obtained by either assuming snow or ice
freeboard using Eq. (1) or (2), respectively, could produce 5.3 CryoSat-2 satellite altimeter detection of
a difference in thickness of 1.7 m. The sensitivity of the de- ISW-influenced fast ice
rived sea ice thickness to variable penetration depths into the
snow layer was also assessed in that study. The objective of this study was to use a standard satellite
Given considerable variability in the composition of the elevation product (ESA Level 2 Baseline C SARIn product)
snow, particularly in the east where more wind compaction and existing methods to obtain fast ice freeboard (Price et al.,
was observed, it is likely that the penetration of the radar 2015) to assess, for the first time, whether a satellite altimeter
waveform into the snow layer will vary along the track. How- is capable of consistently detecting a known pattern of higher
ever, we endeavoured to identify the best freeboard inter- freeboard driven by supercooled ISW outflow in McMurdo
face using the in situ measurements as opposed to assuming Sound.
some arbitrary or constant freeboard interface which would Novel aspects of this study are
have weakened the results. To ensure that the best-matching 1. the application of satellite altimetry to identify a known
freeboard interface or penetration factor for each track was pattern of higher freeboard caused by thicker ice-shelf-
selected, we compared calculated CS2 ice thicknesses from influenced fast ice combined with the buoyant forcing of
Eqs. (1), (2) and (3) with interpolated drill hole MET along the SPL which both result from supercooled ISW out-
the track. Additional validation for the selected freeboard in- flow;
terface was provided by comparing mean values of CS2 free-
The Cryosphere, 15, 4099–4115, 2021 https://doi.org/10.5194/tc-15-4099-2021G. M. Brett et al.: Satellite altimetry detection of ice-shelf-influenced fast ice 4109
2. calculation of ice thickness from CS2 freeboard in Mc- than sea ice without this influence. Platelet ice is a direct
Murdo Sound for multiple years and comparison with manifestation and distinct signature of in situ supercooled
interpolated in situ-measured ice-shelf-influenced fast ISW at the ocean surface, which causes the fast ice freeboard
ice and SPL and their combined MET; to stand higher through two effects: (1) the fast ice is thicker
by platelet ice consolidation, and augmented growth through
3. assessment and comparison of regional trends in CS2 heat flux into the ocean, and (2) the buoyancy effect of the
freeboard (Table 1) and linear trends in CS2 ice thick- SPL, if present. Satellite altimetry measurements cannot dif-
ness towards the McMurdo Ice Shelf in a region with ferentiate between higher freeboard driven by in situ or po-
significant ISW influence (centre) and another region tentially supercooled ISW but, as demonstrated here, could
with less pronounced ISW influence (east) (Fig. 4); identify a region where the fast ice freeboard near an ice shelf
has significantly higher than average freeboard due to the in-
4. assessment of spatial patterns of CS2 freeboard and CS2
fluence of ISW in the upper surface ocean.
ice thickness and comparison with in situ-observed dis-
Regions of anomalously higher freeboard could indicate
tributions of ice-shelf-influenced fast ice and SPL, pre-
thicker fast ice and the influence of ISW. This would require
sented as a combined MET in Fig. 5.
prior knowledge of the age and formation conditions of the
CS2 conclusively detected the influence of ISW on fast ice fast ice (e.g. deformed ice will be thicker) and most critically
in McMurdo Sound each study year. The spatial distribution the depth of the snow layer, if present. To improve uncer-
of higher CS2-obtained freeboard and thicker CS2 ice con- tainty surrounding the radar altimeter penetration and snow
curred with the distributions of thicker ice-shelf-influenced depth, CryoSat-2 could be used in tandem with an ICESat-
fast ice and SPL and prior observations of ISW and ef- 2 laser altimeter which measures snow freeboard. Once re-
fective negative ocean heat flux in McMurdo Sound (Barry gions of ISW outflow are identified, long-term interannual
and Dayton, 1988; Dempsey et al., 2010; Langhorne et al., variability in ice shelf and sea ice interactions could in the-
2015; Lewis and Perkin, 1985; Robinson et al., 2014). In ory be monitored with satellite altimetry. The presence and
the centre, CS2 freeboard and CS2 ice thickness increased abundance of both consolidated platelet ice and the SPL pro-
concurrently with increasing fast ice and SPL thicknesses vide some insight into the processes at play within inaccessi-
towards the ice shelf in the south on all the central pro- ble ice shelf cavities and the volumes of ISW outflowing in a
files. The mean CS2 freeboard value in the centre over the region (Langhorne et al., 2015). With long-term monitoring,
main path of supercooled ISW outflow was 0.07 and 0.09 m this could provide information on the effects of variability
higher than the west and east, respectively, where the influ- in atmospheric and oceanographic interactions which drive
ence of ISW is less pronounced. The regional mean interpo- ISW formation within ice shelf cavities.
lated drill hole SPL thicknesses in the centre of McMurdo Here, we have demonstrated a method with the potential
Sound was 3.90 m. The magnitude of this freeboard differ- capability to carry out satellite altimetry assessments of re-
ence agrees with the 1–2 cm increase in freeboard for every gions where ISW and platelet ice have already been detected
metre of SPL obtained by Gough et al. (2012) using ther- at the surface and to identify other unknown regions where
mistor probe data. This higher freeboard centred at longitude ISW is reaching the upper surface ocean. The smooth gra-
∼ 165◦ E was also observed in McMurdo Sound by Price et dients in fast ice and SPL thickness and a low snow cov-
al. (2013) with ICESat-1 over multi-year ice. The regional erage in McMurdo Sound present favourable conditions for
mean CS2 ice thickness in the centre was 0.78 m or 35 % the CS2 radar altimeter to detect higher ice-shelf-influenced
greater than the mean drill-hole-measured sea ice thickness. freeboard. However, more challenging conditions for satel-
We mainly attributed this overestimate in satellite-altimeter- lite altimetry are likely to be presented elsewhere on the
derived ice thickness to the additional buoyant forcing of the Antarctic coastline. A recent drill hole assessment of super-
SPL. cooled ISW-influenced fast ice in Atka Bay observed deep
snow accumulations of up to 0.89 m which resulted in fre-
5.4 Outlook for satellite altimetry detection of quent negative fast ice freeboard, regardless of a substantial
ice-shelf-influenced fast ice freeboard SPL beneath (Arndt et al., 2020). As far as we are aware,
Atka Bay and McMurdo Sound are the only two locations on
Here, we made the first steps towards developing a satellite- the Antarctic coastline with multiple years of in situ mea-
based method to identify and constrain regions of Antarctic surements of ice-shelf-influenced fast ice, SPL and snow,
coastal sea ice that are being influenced by ISW outflow in highlighting the need for a satellite-based method to identify
the upper surface ocean. Potentially supercooled ISW in the other regions where ISW is outflowing in the upper surface
upper surface ocean promotes sea ice formation and causes ocean and influencing fast ice.
it to be thicker by stabilising the upper surface layer, by hin- However, significant challenges are presented, notably the
dering vertical mixing and insulating sea ice from warmer noise in the CS2 measurement, interference from land, inac-
subsurface waters below (Hellmer, 2004). Thicker Ice Shelf curacies of geophysical corrections, the identification of rel-
Water-influenced sea ice inherently has a higher freeboard ative SSH, the range resolution of SARIn, and most critically
https://doi.org/10.5194/tc-15-4099-2021 The Cryosphere, 15, 4099–4115, 20214110 G. M. Brett et al.: Satellite altimetry detection of ice-shelf-influenced fast ice
inadequate knowledge of the snow distribution in Antarctica Several important factors complicate the identification of
and penetration depth of the radar waveform. Recently, a re- fast ice freeboard measured by satellite altimeters, includ-
tracking algorithm was developed with the capability to re- ing inadequate knowledge of the snow layer in Antarctica,
trieve the backscattering horizon for the air–snow and snow– lack of adjacent open water nearby, the identification of a
sea ice interface from the CryoSat-2 Level 1b waveform relative sea surface height, and inaccuracies in the modelled
(Fons and Kurtz, 2019), which showed significant promise. geophysical corrections and geoid surface. We were able to
However, ice freeboard was overestimated in regions of large constrain these uncertainties and have confidence in the re-
snow depths which concurred with a similar effect on CS2- trieved CryoSat-2 freeboard given the availability of in situ
obtained freeboard in deep snow deposits on Arctic sea ice information for validation. The geophysical corrections ap-
(Ricker et al., 2015). plied to the CryoSat-2 Level 2 SARIn product and the ef-
fects of de-trending for the geoid over ice-free open water
in McMurdo Sound were assessed during the study period to
6 Conclusion provide confidence in the CryoSat-2-measured freeboard and
derived ice thickness.
The outflow of supercooled Ice Shelf Water (ISW) from the
Smooth gradients were observed in fast ice and SPL thick-
conjoined McMurdo–Ross Ice Shelf cavity results in a con-
nesses and the snow layer providing favourable conditions
sistent pattern of thicker fast ice with a substantial sub-ice
for a satellite altimetry assessment. The thinner and generally
platelet layer (SPL) in the central-western region of Mc-
non-compacted snow layer in the centre, west and northwest,
Murdo Sound. The thicker fast ice and the buoyant forcing
where the influence of Ice Shelf Water is most pronounced,
of the SPL result in higher freeboards. Here, we investigated
aided the detection of ice-shelf-influenced freeboard with
if the CryoSat-2 satellite radar altimeter is capable of de-
the CryoSat-2 radar altimeter, as it reduced the complication
tecting this higher freeboard. CryoSat-2 ice freeboard was
with uncertainty of penetration depth into the snow layer and
obtained from surface elevation measurements by applying
interpretation of the assumed backscattering/freeboard inter-
a supervised retrieval procedure which manually identified
face. It is possible that many unobserved regions of coastal
the relative sea surface height along the track in satellite im-
sea ice around Antarctica are influenced by the outflow of
agery. CryoSat-2 ice freeboard was then compared to 4 years
ISW in the upper surface ocean and the presence of platelet
of drill-hole-measured ice and snow freeboard, sea ice and
ice. We have shown that the CryoSat-2 satellite radar altime-
SPL thicknesses, and snow layer depths on the fast ice in
ter is capable of detecting higher freeboard driven by super-
McMurdo Sound.
cooled ISW outflow in McMurdo Sound and provide a proof-
The spatial distribution of higher CryoSat-2-derived ice
of-concept demonstration for the potential wider application
freeboard concurred with the distribution of thicker ice-shelf-
of this method with adequate information on the snow layer.
influenced fast ice and the SPL in late spring of 2011, 2013,
2017 and 2018. In the centre of McMurdo Sound, increas-
ing trends in CryoSat-2-obtained freeboard and ice thickness
were observed with increasing fast ice and SPL thicknesses
towards the McMurdo Ice Shelf every year. Over the 4 study
years, we observe a mean CryoSat-2-obtained freeboard dif-
ference of 0.07–0.09 m across the main path of ISW outflow
in McMurdo Sound. We interpret this freeboard distribution
as being largely due to the thicker ice-shelf-influenced fast
ice and the substantial SPL across the main path of super-
cooled ISW outflow rather than due to gradients in snow
thickness. CryoSat-2-derived ice thickness were 35 % greater
than drill-hole-measured fast ice thickness in the centre of the
sound, which we mainly attribute to the additional forcing of
the SPL which had a regional mean thickness of 3.90 m.
The Cryosphere, 15, 4099–4115, 2021 https://doi.org/10.5194/tc-15-4099-2021You can also read