Rapid increase in simulated North Atlantic dust deposition due to fast change of northwest African landscape during the Holocene - Climate of the Past
←
→
Page content transcription
If your browser does not render page correctly, please read the page content below
Clim. Past, 14, 1051–1066, 2018
https://doi.org/10.5194/cp-14-1051-2018
© Author(s) 2018. This work is distributed under
the Creative Commons Attribution 4.0 License.

Rapid increase in simulated North Atlantic dust deposition
due to fast change of northwest African landscape
during the Holocene
Sabine Egerer1,2 , Martin Claussen1,3 , and Christian Reick1
1 Max Planck Institute for Meteorology, Bundesstraße 53, 20146 Hamburg, Germany
2 InternationalMax Planck Research School on Earth System Modelling, Bundesstraße 53, 20146 Hamburg, Germany
3 Center for Earth System Research and Sustainability, Universität Hamburg, Bundesstraße 53, 20146 Hamburg, Germany

Correspondence: Sabine Egerer (sabine.egerer@mpimet.mpg.de)

Received: 27 March 2018 – Discussion started: 4 April 2018
Revised: 28 June 2018 – Accepted: 4 July 2018 – Published: 12 July 2018

Abstract. Marine sediment records from a series of core            covered. Concurrently with the continental drying, surface
sites along the northwest African margin show a sudden in-         winds in the western Sahara are accelerated. Changes in the
crease in North Atlantic dust deposition at about 5 ka BP that     Saharan landscape and dust emissions south of 18◦ N and in
has been associated with an abrupt end of the African Hu-          the eastern Sahara play a minor role in driving the dynamics
mid Period (AHP). To assess the causes of the abrupt shift         of North Atlantic dust deposition at the core sites. Our study
in North Atlantic dust deposition, we explore changes in           identifies spatial and temporal heterogeneity in the transition
the Holocene dust cycle and in North African climate and           of the North African landscape. As a consequence, implica-
landscape by performing several time slice simulations from        tions from local data records on large-scale climate have to
8 ka BP until the preindustrial era. To do this, we use the cou-   be treated with caution.
pled aerosol–climate model ECHAM6–HAM2 including dy-
namic vegetation and interactive dust, wherein ocean condi-
tions and lake surface area are prescribed for each time slice.    1   Introduction
   We find a rapid increase in simulated dust deposition be-
tween 6 and 4 ka BP that is fairly consistent with the abrupt      North Atlantic sediment records show an abrupt increase in
change in marine sediment records at around 20◦ N close to         dust accumulation close to the northwest African margin at
the northwest African margin. At more northern and more re-        about 5 ka BP (deMenocal et al., 2000; Adkins et al., 2006;
mote cores, a significant change in dust deposition is notice-     McGee et al., 2013; Albani et al., 2015), which is also ob-
able roughly between 6 and 2 ka BP in the simulations as well      served downwind in the tropical North Atlantic and at the
as in the records, but the change is less sharp compared to the    Bahamas (Williams et al., 2016). The abrupt increase in dust
near-margin core sites. The rapid change in simulated dust         deposition has been attributed to an abrupt Holocene land-
deposition is caused by a rapid increase in simulated dust         scape change in North Africa. For instance, modeling studies
emissions in the western Sahara, where the main dust sources       reveal a sudden large-scale decline of North African vegeta-
for dust transport towards the North Atlantic are located. The     tion cover (Brovkin et al., 1998; Claussen et al., 1999; Liu
sudden increase in dust emissions in the western Sahara is         et al., 2006). Also, paleohydrologic records point to a rapid
according to our simulations a consequence of a fast decline       drying-out of all water bodies at the end of the African Hu-
of vegetation cover from 22 to 18◦ N that might occur due          mid Period (AHP) at about 4.5 ka BP (Lézine et al., 2011).
to vegetation–climate feedbacks or due to the existence of         In contrast, pollen records from Lake Yoa (Kröpelin et al.,
a precipitation threshold on vegetation growth. Additionally,      2008), sediment records from the Manga Grasslands (Cock-
the prescribed gradual reduction of lake area enforces accel-      erton et al., 2014) and a modeling study of vegetation cover
erated dust release as highly productive dust sources are un-      transition (Renssen et al., 2003) indicate a more gradual

Published by Copernicus Publications on behalf of the European Geosciences Union.
1052                                               S. Egerer et al.: Rapid increase in simulated North Atlantic dust deposition

change in the North African landscape. Paleohydrologic re-             Our study is structured as follows: first, we present a brief
constructions show a southward retreat of the tropical rain         description of the model and experiment setup and evalu-
belt with local differences in the timing and abruptness of         ate the model against data. We then compare our simulated
the retreat (Shanahan et al., 2015). The origin of the abrupt       North Atlantic dust deposition to marine sediment records
change in North Atlantic dust deposition in the context of          and demonstrate the link between changes in North Atlantic
Holocene landscape change in North Africa is thus still a           dust deposition and changes in Saharan dust emissions, land-
matter of debate.                                                   scape and climate. Further, we analyze the spatial hetero-
   In a previous simulation study (Egerer et al., 2017), we         geneity of changes in dust emissions and vegetation and an-
tested the hypothesis that a gradual decline of North African       alyze the importance of changes in atmospheric circulation.
vegetation and lake cover results in an abrupt increase in          Finally, we discuss our findings and draw our main conclu-
North Atlantic dust deposition either due to nonlinearity in        sions.
dust activation or due to the heterogeneous distribution of
major dust sources. Our simulations revealed a gradual in-
                                                                    2     Model and experiment setup
crease in North Atlantic dust deposition as a response to
gradual landscape changes. This suggests that either a fast         2.1    Model description
vegetation decline or a rapid desiccation of lakes is crucial to
explaining the abrupt increase in dust deposition in the ma-        We use the global aerosol–climate model ECHAM6–HAM2
rine sediment cores. Fast changes in vegetation cover have          (version echam6.3-ham2.3) (Stier et al., 2005; Stevens et al.,
been attributed to a precipitation threshold on vegetation (Liu     2013) at a model resolution of T63L31, which corresponds to
et al., 2006) or to feedbacks between climate and vegetation        a horizontal resolution of approximately 1.9◦ × 1.9◦ and 31
that amplify the gradual insolation forcing (Brovkin et al.,        vertical pressure levels in the atmosphere. The aerosols that
1998; Claussen et al., 1999). The first to propose such a           are calculated interactively in the model are sulfate, black
positive vegetation–climate feedback was (Charney, 1975).           carbon, organic carbon, sea salt and mineral dust. In this
According to his theory, high desert albedo leads to more           study, we only focus on mineral dust. In the model, the im-
stable conditions in the air column above compared to the           pact of dust on the solar radiation budget through scattering
surroundings and thus precipitation is suppressed, which re-        and absorption and on the cloud structure is implemented (for
sults in a self-stabilization of the desert. Similarly, the mech-   details see Stier et al., 2005). Bare soils and areas covered
anism works the opposite way in vegetated areas due to their        with sparse vegetation, such as grasses, shrubs and crops, are
low albedo. A change in external conditions may trigger an          assumed to be potential dust sources in the model (Stanelle
abrupt transition from a humid vegetated state to a hyperarid       et al., 2014). Additionally, former paleolakes serve as prefer-
desert state in the presence of these positive feedbacks.           ential dust sources as fine-grained material that is deposited
   Previous simulation studies on the Holocene dust cycle           in dried-out lake beds can be easily deflated by surface winds.
(Sudarchikova et al., 2015; Albani et al., 2015; Egerer et al.,     If certain criteria are fulfilled (e.g., the soil has to be dry and
2016, 2017) did not include climate-consistent calculations         uncovered), dust is emitted from these potential and preferen-
of the vegetation distribution (“dynamic vegetation”) and           tial dust sources as soon as the surface wind velocity exceeds
were thus not suitable to analyze the link between changes          a critical threshold.
in dust and vegetation during the Holocene. In this study, we          The dust emission scheme is based on Tegen et al. (2002).
explore the possible link between a sudden change in vege-          The main mechanism considered in this scheme is saltation
tation cover arising in interaction with the hydrological cycle     bombardment. The size distribution of the emitted particles
and atmospheric dynamics and an abrupt change in North              is prescribed via lognormal functions of a coarse (mass mean
Atlantic dust deposition during the Holocene. The study is          radius (mmr) = 1.75 µm, standard derivation σ = 2 µm) and
guided by the following questions: can we confirm an abrupt         an accumulation mode (mmr = 0.37 µm, σ = 1.59 µm). Af-
shift in North Atlantic dust deposition in our simulations as       ter exceeding a critical threshold, the horizontal dust flux is
found in marine sediment records? How is the shift in North         parameterized as a cubic function of the surface wind ve-
Atlantic dust deposition linked to Saharan landscape tran-          locity following (Marticorena and Bergametti, 1995). A ratio
sition towards the end of the AHP? How does the timing              between vertical and horizontal fluxes is given depending on
and the abruptness of Saharan landscape and climate tran-           particle size and surface properties. Dust is transported via
sition vary spatially? To answer these questions, we perform        tracers in the atmosphere component ECHAM. Deposition
a series of time slice simulations from the mid-Holocene to         processes involve the washing out of particles from the at-
the preindustrial era in which vegetation, climate and dust         mosphere by precipitation (wet deposition), turbulent down-
are coupled dynamically in the global aerosol–climate model         ward mixing (dry deposition) and the gravitational settling of
ECHAM6–HAM2 (version echam6.3-ham2.3). Ocean con-                   particles (sedimentation).
ditions for each time slice and a linear decline of lake surface       In this model version, we use a five-layer soil scheme to
area over time are prescribed.                                      handle soil moisture. The charge of the skin water reservoir
                                                                    (thickness 10−6 cm) is taken as a measure for the soil wet-

Clim. Past, 14, 1051–1066, 2018                                                                 www.clim-past.net/14/1051/2018/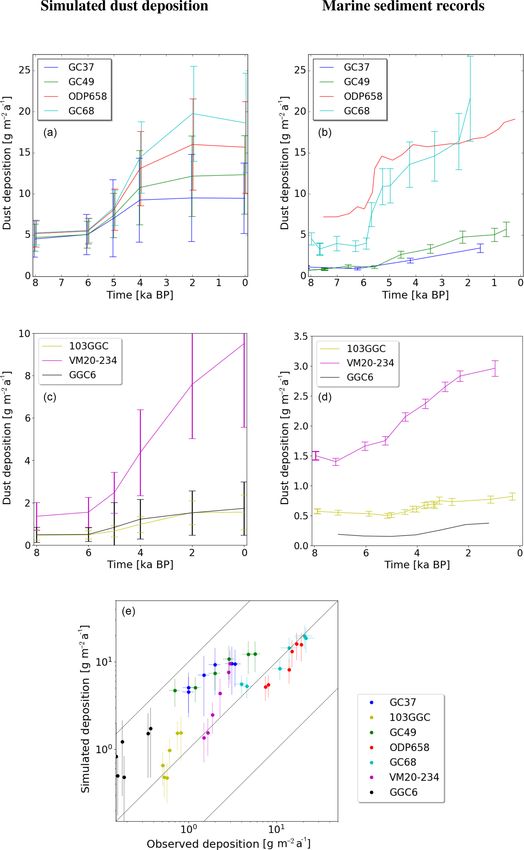
S. Egerer et al.: Rapid increase in simulated North Atlantic dust deposition                                                 1053

ness. As long as the skin reservoir is filled, dust emissions      and the preindustrial time slice as 0k. We chose the prein-
are suppressed. Also, lakes disable dust emissions. If the lake    dustrial era rather than the present day to exclude any anthro-
surface fraction of a grid cell is above 50 %, the grid cell is    pogenic impact. Because marine sediment records indicate a
handled as a lake cell and no dust emission from this grid cell    rather abrupt change in dust accumulation at about 5.5 and
is possible.                                                       4.9 ka BP (deMenocal et al., 2000; McGee et al., 2013), we
   Vegetation is described as a composition of 11 plant func-      add a time slice at 5 ka BP. Vegetation and dust are calculated
tional types (PFTs) in the land surface model JSBACH of            interactively.
ECHAM including grass and woody (trees and shrubs) types.             Paleohydrologic records show that the maximum of deep
Natural land cover change and vegetation dynamics are sim-         lake formation occurred during the early Holocene around
ulated by the DYNVEG component (Brovkin et al., 2009;              9 ka BP, whereas the maximum extent of water surface was
Reick et al., 2013). The simulation of vegetation in JSBACH        reached only at 6 ka BP and fell thereafter (Lézine et al.,
is based on the “universal presence principle”; i.e., each PFT     2011). Thus, we prescribe the lake surface area identically
can potentially grow everywhere. Bioclimatic limits restrict       for the 8 and 6k time slice in our simulations based on a pale-
the establishment of PFTs. Several processes control land          olake reconstruction (Tegen et al., 2002) (Fig. 1). Thereafter,
cover change: PFT cover can be reduced by natural death or         the lake surface area is prescribed to decline linearly in North
disturbances, e.g., through wildfires, thereby releasing space     Africa similar to the first scenario in Egerer et al. (2017).
for the migration of other vegetation. PFT cover can increase      Preindustrial lake surface area is prescribed based on satel-
through the migration of plant species in the released space,      lite data (Loveland et al., 2000) (Fig. 1). Orbital forcing pa-
the so called “uncolonized land”. In general, vegetation es-       rameters for each time slice are set following Berger (1978).
tablishment is possible when net primary productivity (NPP)        Changes in greenhouse gas concentrations are assumed to
is positive at least for some years. Different PFTs compete        have a minor impact and are set constant across all time slices
for the uncolonized land and their success depends on growth       following the PMIP protocol for the mid-Holocene (Harri-
form and productivity; more productive plants have a com-          son et al., 2001). We prescribe sea surface temperature (SST)
petitive advantage. At first, grass PFTs have an advantage         and sea ice concentration (SIC) for each time slice from 50-
because they grow much faster than woody types (trees and          year averages calculated interactively in a transient Holocene
shrubs). In the absence of disturbances, woody PFTs are in         simulation with MPI-ESM1 that does not contain interactive
favor of grass PFTs due to light competition. Finally, the frac-   dust (Bader et al., 2018). This simulation includes orbital and
tion of a grid cell inhospitable to vegetation (“bare land”)       CO2 forcing and captures the Holocene era from 8 ka BP un-
may expand or shrink depending on climate conditions as            til the present. We use 50-year mean vegetation cover and
measured by growth success.                                        cover fractions of all 11 PFTs from the model output of this
   For this study, a simple dynamic soil albedo scheme has         transient Holocene simulation to initialize the vegetation dis-
been included in the model for which the soil albedo αsoil         tribution in North Africa (17◦ W–40◦ E, 10–30◦ N) for each
is parameterized based on plant net primary productivity           time slice in our study. To bring the vegetation distribution in
(NPP):                                                             equilibrium, we first run 30 years with accelerated vegetation
                                                               dynamics followed by 570 years with vegetation dynamics at
                                   NPP                             normal speed. We take the last 200 years for evaluation. We
αsoil = αobs − αobs − αdark · min         ,1 ,              (1)
                                  NPPdark                          consider a rather long period for evaluation because the dy-
                                                                   namic vegetation in JSBACH varies on timescales of more
where αobs is the standard soil albedo in JSBACH, which is         than 100 years, for example in the grass and shrub fraction.
based on present-day observations, while αdark is the albedo
of soil in the presence of soil organic carbon as measured
by the average normalized net primary productivity NPPdark         2.3     Model evaluation
when vegetation is composed half of tropical summergreen
                                                                   2.3.1    Vegetation cover
trees and half of raingreen shrubs. Equation (1) is evaluated
separately for the visible and near-infrared range. αdark is set   We compare the vegetation distribution that was simulated
to 0.13 in the visible range and to 0.22 in the near-infrared      dynamically in our model to a biome reconstruction based
range. NPP is the 5-year average of the actual NPP (Zink,          on pollen records of the BIOME 6000 data set (Harrison,
2014).                                                             2017). To do so, we translate the vegetation cover fractions
                                                                   and the PFT cover fractions from our 0 and 6k simulations
2.2   Experiment setup                                             into biomes by applying the method of (Dallmeyer et al.,
                                                                   2018) (Fig. 2).
We perform a series of time slice simulations covering the            In the preindustrial (0k) simulation, tropical forest reaches
Holocene from 8 ka BP to the preindustrial era, 1850 AD, in        up to 12◦ N in agreement with remote sensing data (Ra-
2 kyr intervals in which, for example, 6k refers to 6 ka BP.       mankutty and Foley, 1999). Between 12 and 14◦ N, the sim-
The mid-Holocene time slice is hereafter referred to as 6k         ulation shows a mixture of savanna, grassland and desert

www.clim-past.net/14/1051/2018/                                                                Clim. Past, 14, 1051–1066, 2018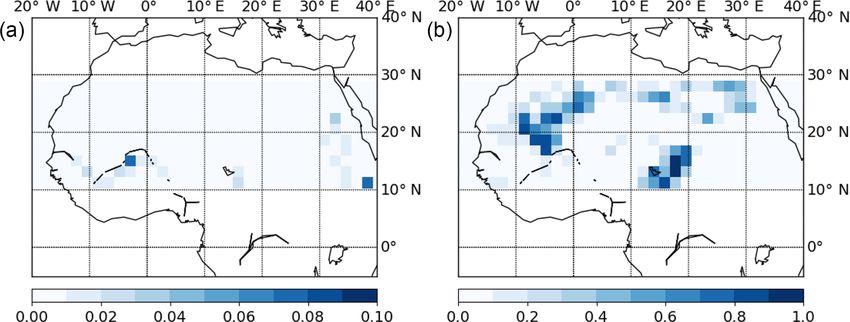
1054                                                    S. Egerer et al.: Rapid increase in simulated North Atlantic dust deposition

Figure 1. Preindustrial lake distribution based on satellite data (Hagemann, 2002) (a) and a paleolake reconstruction of Tegen et al.
(2002) (b). The color indicates the lake fraction in a grid cell. Note that the scales are different.

Figure 2. Biomes determined from simulated vegetation cover fractions and PFT cover fractions applying the method of Dallmeyer et
al. (2018) for 0k (a) and 6k (b). The circles indicate biomes reconstructed from pollen data of the BIOME 6000 database (Harrison, 2017).
The white areas within the continent are lakes. (trF: tropical forest, waF: warm-mixed forest, teF: temperate forest, SAV: savanna, GRA:
grassland, DE: desert).

vegetation. The northward extent of our simulated vegeta-                    2.3.2    West African monsoon
tion seems a bit underestimated compared to satellite data
entering the land surface data set of (Hagemann, 2002). Also                 It is known that ECHAM6 has a dry bias in the Sahel region
pollen records close to the coast indicate savanna vegetation                during the summer for present-day climate, and the West
up to 16◦ N and grassland even north of 20◦ N (Fig. 2).                      African monsoon (WAM) does not extend sufficiently far
   In the mid-Holocene (6k) simulation, the surface is                       north (Eichhorn and Bader, 2016), which is consistent with
densely covered with tropical forest up to 14◦ N and with                    the somewhat underestimated northward extent of vegetation
savanna up to 21◦ N in the western Sahara and up to 16◦ N                    in our preindustrial simulation (Fig. 2).
in the eastern Sahara. Grassland reaches up to 23◦ N in the                     The simulated precipitation changes between mid-
western Sahara and up to 19◦ N in the eastern Sahara. Pollen                 Holocene and preindustrial times obtained in our study
records predict grassland even up to 27◦ N. The northern veg-                clearly exceed those of the precipitation records from proxy
etation extent is underestimated in our mid-Holocene sim-                    data between 10 and 15◦ N by about 800 mm yr−1 and
ulations compared to the data. In contrast, between 14 and                   precipitation changes in other modeling studies by about
17◦ N, pollen records predict grassland, whereas in our sim-                 1000 mm yr−1 (Perez-Sanz et al., 2014) (Fig. 3). Only one
ulations, savanna vegetation is dominant.                                    study with prescribed vegetation and a prescribed reduc-
   While the simulated preindustrial vegetation distribution                 tion of dust AOD predicts higher precipitation changes com-
turns out to be shifted southward by about 2◦ compared to                    pared to our study (Pausata et al., 2016). Between 15 and
satellite data, the mid-Holocene northward extent of vegeta-                 20◦ N, the simulated precipitation changes are slightly lower
tion is clearly underestimated, only reaching up to between                  than those of observations and (Pausata et al., 2016) and
19 and 23◦ N compared to 27◦ N obtained from reconstruc-                     slightly higher than predicted by all other CMIP5 models.
tions. Nevertheless, the mid-Holocene vegetation is shifted                  Still, they lie within the uncertainty range of the observa-
significantly northward overall by about 6◦ compared to the                  tions. North of 20◦ N, the simulated precipitation changes
preindustrial vegetation in our simulations.                                 are far below the reconstructed precipitation changes. The
                                                                             lack of vegetation north of 20◦ N is consistent with an un-

Clim. Past, 14, 1051–1066, 2018                                                                         www.clim-past.net/14/1051/2018/
S. Egerer et al.: Rapid increase in simulated North Atlantic dust deposition                                                        1055

                                                                        Figure 4. Site locations of marine sediment cores in the North At-
                                                                        lantic.

                                                                        updated observational data set of the sediment records of
                                                                        McGee et al. (2013) with higher temporal resolution and in-
Figure 3. Comparison of reconstructed and simulated precipita-          formation about particle size distribution. Here, we compare
tion changes between the mid-Holocene and the preindustrial era.        our simulation results to the total eolian fluxes and not to
The simulated zonal mean (17◦ W–40◦ E) anomalies between mid-           the < 10 µm that are additionally presented by (Albani et al.,
Holocene and preindustrial precipitation from this study are aver-      2015). The dust data of (Middleton et al., 2018) are con-
aged over 5◦ latitudinal bands between 10 and 30◦ N at the location     strained using the 3 HeET flux proxy.
of grid cells for which reconstructions are available. Proxy data are      The marine records show an abrupt shift in dust depo-
from a reconstruction of precipitation from (Bartlein, 2011). Fur-      sition at the locations of the southern cores ODP658 and
ther, the CMIP5 model range (Harrison et al., 2015) and model val-
                                                                        GC68 close to the northwest African margin where the most
ues from (Pausata et al., 2016) are averaged for the grid cells for
which reconstructions are available. Temporal standard deviations
                                                                        prominent increase in dust deposition occurs at around 5.5
are given for our study and for (Pausata et al., 2016), and spatial     to 4.9 ka BP (deMenocal et al., 2000; Adkins et al., 2006;
variation is indicated for the proxy data.                              McGee et al., 2013; Albani et al., 2015) (Fig. 5). At the
                                                                        locations of the more northern cores GC37 and GC49 the
                                                                        change in dust deposition is rather moderate. In our simula-
derestimation of the simulated northward extent of the West             tions, we find a rapid increase in North Atlantic synchronous
African monsoon during the mid-Holocene compared to pa-                 dust deposition for several core sites along the northwest
leorecords (Bartlein, 2011; Perez-Sanz et al., 2014) (Fig. 3).          African margin (Fig. 5). At the southern cores, the quanti-
Rather than an underestimation of absolute mid-Holocene                 tative range of simulated dust deposition agrees fairly well
precipitation changes as in the CMIP5 models, we find a                 with the marine records, but the change in simulated dust de-
mismatch in the meridional gradient of precipitation changes            position is less abrupt. The steepest rise in simulated dust de-
between our simulations and the reconstructions from proxy              position occurs between 5 and 4 ka BP. Additionally, a strong
data (Bartlein, 2011).                                                  change occurs between 6 and 5 ka BP and, at least at the
                                                                        grid cells close to GC68 and ODP658, there is a moder-
                                                                        ate change between 4 and 2 ka BP. After 2 ka BP, dust de-
3     Results
                                                                        position remains approximately constant until preindustrial
3.1    Comparison with marine sediment records
                                                                        times. At the northern cores, the simulated dust deposition
                                                                        is much higher compared to the marine records for all time
We verify our simulated dust deposition by comparing model              slices and we find a significant and rapid change between 6
results with marine sediment records close to the northwest             and 4 ka BP in the simulations. At the locations of the re-
African margin and more remote in the North Atlantic. The               mote sediment cores VM20-234 in the tropical North At-
locations of the considered core sites are given in Fig. 4 and          lantic (TNA) and 103GGC at the Bahamas (Williams et al.,
Table 1. At the marine sediment cores, the dust flux was cal-           2016) the simulated dust deposition increases gradually be-
culated as the difference between the total flux and the car-           tween 6 and 2 ka BP. From 2 ka BP until preindustrial, depo-
bonate, opal and organic carbon flux. In Adkins et al. (2006),          sition increases further in VM20-234 and remains constant in
McGee et al. (2013) and Williams et al. (2016), the 230 Th              103GGC. For both, the relative change in dust flux is in fair
normalization method was used to determine dust fluxes. Ad-             agreement with marine dust records (Fig. 4). Absolute mass
ditionally, the studies by McGee et al. (2013) and Williams             fluxes during the mid-Holocene are also reproduced in our
et al. (2016) use endmember modeling to separate eolian                 simulations, whereas simulated preindustrial dust fluxes are
and hemipelagic fluxes. Thereby, the coarse endmembers                  higher by a factor of 2 for 103GGC and by a factor of 3 for
(approximately between 8 and 80 µm in size) are assumed                 VM20-234 compared to the marine records. At GGC6 in the
to characterize eolian dust. Albani et al. (2015) provide an            mid-North Atlantic (Middleton et al., 2018) we find a some-

www.clim-past.net/14/1051/2018/                                                                     Clim. Past, 14, 1051–1066, 2018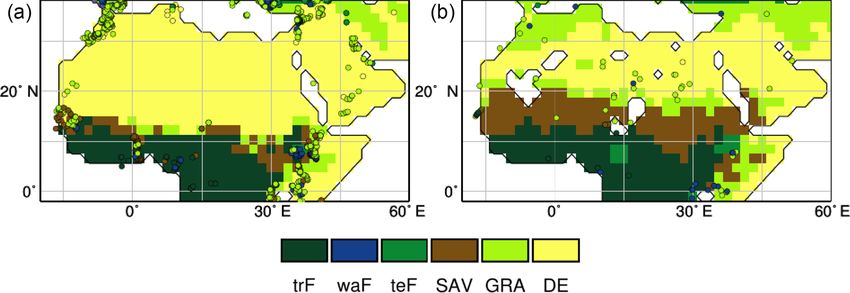
1056 S. Egerer et al.: Rapid increase in simulated North Atlantic dust deposition
Table 1. Site locations and data references of marine sediment cores in the North Atlantic.
Site Lat (◦ N) Long (◦ W) Reference
GC 37 26.82 15.12 McGee et al. (2013); Albani et al. (2015)
GC 49 23.21 17.85 McGee et al. (2013); Albani et al. (2015)
ODP 658 20.75 18.58 Adkins et al. (2006)
GC 68 19.36 17.28 McGee et al. (2013); Albani et al. (2015)
VM20-234 5.33 33.03 Williams et al. (2016)
103GGC 26.06 78.03 Williams et al. (2016)
GGC6 29.21 43.23 Middleton et al. (2018)
what steeper increase in simulated dust deposition between 6 Bodélé Depression and close to the Red Sea do we find larger
and 4 ka BP, whereas the records show a rise between 4 and changes in dust emissions before 4 ka BP. However, we ar-
2 ka BP. Also, the absolute amount of simulated dust flux is gue that these dust source areas do not affect dust deposition
higher by an order of magnitude. At all core sites, the simu- at the marine cores close to the northwest African margin
lated dust deposition fluxes remain nearly constant between for the following reasons: in our simulations, we find that
8 and 6 ka BP, which is consistent with the sediment records. dust emissions from the area around the Bodélé Depression
The simulated deposition flux at the core sites along the (14–22◦ E, 12–18◦ N) do not significantly increase between
northwest African margin increases from north to south by 6 and 4 ka BP, but only after 4 ka BP (Fig. 7). In contrast,
factors between 2.5 and 3.1 from about 4–5.5 g m−2 a−1 at dust emissions from the western Sahara rise rapidly between
8 ka BP to 10–18 g m−2 a−1 at 0 ka BP (Fig. 5). These factors 6 and 4 ka BP in line with the rapid increase in dust deposi-
are in agreement with those indicated by sediment records tion at the marine cores (Fig. 5). Observational evidence also
and also with those determined in a previous study (Egerer supports our argument: northeasterly surface winds mainly
et al., 2016). transport dust from western Saharan dust sources to the At-
lantic (Cockerton et al., 2014). Further, the transport path-
ways from the Bodélé Depression that were determined by a
3.2 Link between North Atlantic dust deposition and
Lagrangian advection model (Washington et al., 2009; Ben-
Saharan dust emissions
Ami et al., 2010) are located too far south to affect the marine
Satellite observations show that today the main dust plume is cores.
located north of 15◦ N (Prospero et al., 2002; Engelstaedter We conclude from these findings and from Fig. 6 and
et al., 2006), originating from major western Saharan dust Fig. 7 that the rapid change in simulated dust deposition be-
sources in Mauritania, Mali and southern Algeria as well as tween 6 and 4 ka BP at the position of the marine cores is
from the Bodélé Depression (Middleton and Goudie, 2001; directly linked to changes in western Saharan dust emissions
Prospero et al., 2002; Engelstaedter et al., 2006). These re- approximately between 15◦ W and 2◦ E and north of 18◦ N.
gions are clearly visible in our simulated preindustrial dust In the following, we calculate the evolution of Saharan dust
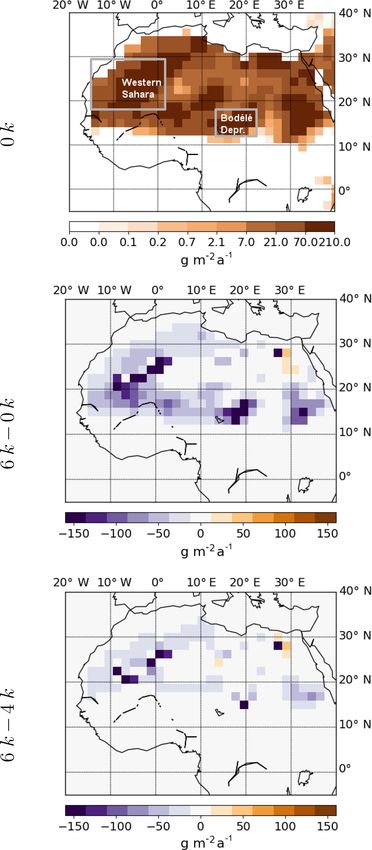
emission patterns (Fig. 6). Similarly, changes in dust emis- emissions from this specific area (15◦ W–22◦ E, 18–29◦ N;
sions between the mid-Holocene (6k) and preindustrial (0k) marked with a grey frame in Fig. 6) between 8 and 0 ka BP
simulation are maximal in the regions of today’s major and we investigate corresponding changes in Saharan vege-
dust sources: the western Sahara and the Bodélé Depres- tation, lakes and climate in the area to better understand the
sion (Fig. 6). In these regions, paleolakes existed during the causes of the rapid change in North Atlantic dust deposition.
mid-Holocene and inhibited dust emissions. As soon as the
lakes dried out, fine-grained material was exposed to sur- 3.3 Causes for the rapid change in North Atlantic dust
face winds, which has made these areas very productive dust deposition
sources.
We aim to better understand the spatial relation between Considering the area of major changes in dust sources iden-
North African dust sources and North Atlantic dust deposi- tified in the previous section (15◦ W–2◦ E, 18–29◦ N), sim-
tion. The maximal changes in North Atlantic dust deposi- ulated dust emissions from the western Sahara remain con-
tion occur between 6 and 4 ka BP in our simulations (Fig. 5). stant between 8 and 6 ka BP, rise the most strongly between
Hence, we show the changes in Saharan dust emissions 6 and 4 ka BP, and thereafter increase less strongly until they
within this time period (Fig. 6). Whereas major changes remain constant between 2 and 0 ka BP (Fig. 8). The evolu-
in dust emissions occur as far south as 12◦ N between 6 tion of simulated dust emissions in the western Sahara dur-
and 0 ka BP, the areas where changes in dust emissions oc- ing the Holocene is similar to that of simulated dust de-
cur between 6 and 4 ka BP are almost exclusively located position at the grid cells around the southern cores GC68
north of 18◦ N. Only in specific grid cells in the area of the and ODP658 with a strong and rapid change between 6 and
Clim. Past, 14, 1051–1066, 2018 www.clim-past.net/14/1051/2018/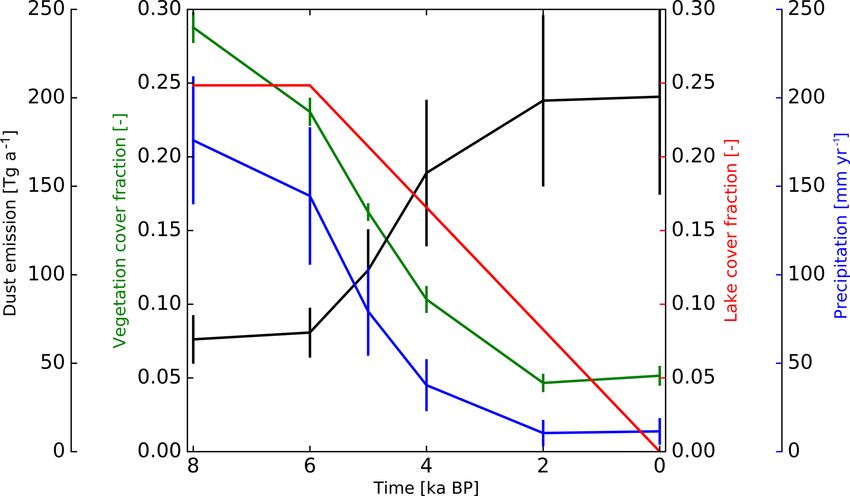
S. Egerer et al.: Rapid increase in simulated North Atlantic dust deposition                                                          1057

Figure 5. Comparison between simulated and observed dust fluxes at the position of the considered marine sediment cores. (a, c) Simulations.
(b, d) Observations. Note that the scale is different for the remote core sites (plots in second row). For the data references see Table 1.

www.clim-past.net/14/1051/2018/                                                                      Clim. Past, 14, 1051–1066, 2018
1058                                                 S. Egerer et al.: Rapid increase in simulated North Atlantic dust deposition

                                                                      Figure 7. Simulated dust emissions from the western Sahara
                                                                      (15◦ W–2◦ E, 18–29◦ N; solid) and from an area including the
                                                                      Bodélé Depression (14–22◦ E, 12–18◦ N; dashed). Both areas are
                                                                      shown in Fig. 6.

                                                                      Figure 8. Simulated dust emissions (black), vegetation cover frac-
                                                                      tion (green), lake cover fraction (red) and precipitation (blue) aver-
                                                                      aged over the western Sahara (15◦ W–2◦ E, 18–29◦ N).

                                                                      cline in vegetation cover from about 0.24 at 6 ka BP to about
Figure 6. Simulated dust emission flux for 0k and changes in simu-    0.1 at 4 ka BP and the rapid increase in western Saharan dust
lated dust emission flux between selected time slices (6–0k, 6–4k).   emissions and the associated North Atlantic dust deposition
The areas of the western Sahara and the Bodélé Depression include     during this time. As vegetation cover decreases, larger areas
the major dust sources today and are marked with a grey frame.        are available for dust emissions. Precipitation decreases in a
                                                                      similar manner as the vegetation (Fig. 8), with the strongest
                                                                      reduction in precipitation between 6 and 4 ka BP. Also, pre-
4 ka BP (Fig. 5). This points to a strong coupling of western         scribed lake levels decrease quite strongly: during the mid-
Saharan dust sources and dust deposition at the location of           Holocene lakes covered about 25 % of the surface, whereas
the southern dust cores at around 20◦ N. Northeasterly sur-           today there are barely any lakes in the western Sahara.
face winds transport large amounts of dust from western Sa-              To get a better understanding of the spatial coupling be-
haran sources to the North Atlantic.                                  tween changes in dust emissions, vegetation and lake evolu-
   In this western Saharan region, the vegetation cover frac-         tion, and changes in climate, we divide North Africa (17◦ W–
tion decreases monotonously between 8 and 2 ka BP, with               10◦ E, 10–30◦ N) into boxes of 2 × 2 grid cells, roughly
the strongest reduction rate between 6 and 4 ka BP, before            400×400 km (Fig. 9). This resolution is sufficient to identify
it remains approximately constant between 2 and 0 ka BP               spatial differences and yet all details are visible in the map.
(Fig. 8). There is a clear link between the most prominent de-        For each box, we plot dust emissions, vegetation cover frac-

Clim. Past, 14, 1051–1066, 2018                                                                    www.clim-past.net/14/1051/2018/
S. Egerer et al.: Rapid increase in simulated North Atlantic dust deposition 1059
tion, precipitation and lake cover fraction with similar axes 3.4 Changes in the seasonal cycle of dust emissions
as in Fig. 8. and atmospheric circulation
South of 18◦ N (row D and E), dust emissions do not
Here, we aim to get a better understanding of changes in
increase significantly until 4 ka BP in the western Sahara,
the seasonal cycle of dust emissions that is closely linked
which justifies the choice of the area for evaluation (Fig. 6).
to changes in wind speed and direction. We find in all sim-
The steepest rise in dust emissions between 6 and 4 ka BP oc-
ulations that dust emissions in the western Sahara are maxi-
curs in boxes A5, B2, B4 and C3. This region includes dried-
mal during early spring (FMA; Fig. 10). We refer to the area
out paleolake basins with fine-grained sediments, which can
identified in Sect. 3.2 as dominantly impacting the changes
be easily deflated by near-surface winds. Accordingly, we
in North Atlantic dust deposition at the considered core sites.
prescribed a strong but gradual reduction in lake surface area
During this season, northeasterly trade winds between 12 and
in boxes A5, B2–B5, C2–4 and D3 (marked in blue–purple
30◦ N transport dust from the western Sahara at altitudes up
in Fig. 9). A strong shift in vegetation cover is restricted to
to 1000 m of height to the North Atlantic (Fig. 11) (Engel-
boxes in rows C, D and E. North of them, vegetation cover
staedter and Washington, 2007). At the same time, the max-
remains low throughout the Holocene. In row C, we find a
imal reduction in western Saharan dust emissions occurs in
fast decline of vegetation cover between 6 and 4 ka BP in
early spring (Fig. 10) consistent with major changes in dust
the western Sahara, which is clearly linked to a sudden rise
source areas (see Sect. 3.2). In the mid-Holocene simulation,
in dust emissions and the associated dust deposition at the
northeasterly winds at 925 hPa are reduced by up to 2 m s−1
southern cores GC68 and ODP 658 at around 20◦ N (marked
along the northwest African margin and the western Sahara
in purple in Fig. 9). In row D, the decrease in vegetation cover
compared to the preindustrial simulation (Fig. 11). We find
is even stronger and occurs later, from around 5 to 2 ka BP.
that, similar to the rapid increase in dust emissions in the
Here, the vegetation density is too high to enable dust emis-
western Sahara (Fig. 8) and the associated dust deposition
sions until 4 ka BP. In row E, the vegetation fraction remains
along the northwest African margin (Fig. 5), there is also
high until the present and inhibits dust emissions nearly com-
a sharp increase in early spring wind strength in the west-
pletely before 2 ka BP. The rapid decline of vegetation cover
ern Sahara mainly between 5 and 4 ka BP (Fig. 12). After
in rows C and D is in line with the rapid decrease in precip-
4 ka BP, the wind strength remains on the same level and even
itation. Also, in boxes B2–B4, the reduction of precipitation
decreases towards the present.
occurs fast between 6 and 4 ka BP and results partly from the
During preindustrial summer (JAS), the tropical rain belt
strong lake surface reduction and partly from the moderate
is shifted northward (Patricola and Cook, 2007; Gaetani
vegetation decline.
et al., 2017). Southwesterly winds transport moist air from
In the eastern Sahara, dust emissions remain nearly con-
the equatorial Atlantic to the continent in accordance with a
stant or increase only slightly in most of the grid cells north
northward propagation of the West African monsoon. Dust
of 18◦ N. In the very east, close to the Arabian Peninsula,
is transported westward to the ocean within the Saharan Air
there is a stronger increase in dust emissions in boxes C13,
Layer (SAL), which is connected to the African Easterly Jet
D13 and D14 coinciding with a strong decline of vegetation
(AEJ) at higher altitudes up to 500 hPa (Prospero and Carl-
and precipitation in row D (marked in green in Fig. 9). Here,
son, 1972). Dust fallout from the SAL is incorporated into the
the rise in dust emissions occurs too late and the area is too
northeasterly trade winds and transported westward along the
remote to affect dust deposition at the core sites. In boxes D9
coast, which is clearly visible in our simulations (Fig. 11).
and D10, dust emissions rise gradually from 5 ka BP onwards
Consistently, we find a second smaller peak in western Sa-
to extremely high values in line with a strong fall in lake area,
haran dust emissions during the summer (JAS) in our sim-
vegetation and precipitation (marked in purple in Fig. 9).
ulations (Fig. 10). During mid-Holocene summer, precipita-
This area contains the Bodélé Depression, the world’s largest
tion extended further north as shown in Sect. 2.3.2, indicat-
dust source today (Prospero et al., 2002). As discussed in
ing a northward displacement of the West African monsoon
Sect. 3.2, dust is transported from the Bodélé Depression in
and the Hadley circulation as described in previous stud-
the direction of the West African Sahel, and supply to the ma-
ies (Merlis et al., 2013; D’Agostino et al., 2017; Gaetani
rine cores north of 19◦ N is minor (Washington et al., 2009;
et al., 2017). Consistently, winds at 925 hPa are reduced by
Ben-Ami et al., 2010; Cockerton et al., 2014). The high wa-
up to 2 m s−1 south of 18◦ N in our simulations. Changes in
ter levels during the mid-Holocene in boxes D9, D10, E8 and
simulated northeasterly winds occur mainly between 6 and
E9 point to the location of former lake Megachad (Armitage
4 ka BP during the summer (Fig. 12). Changes in simulated
et al., 2015). The strong reduction in lake surface area in this
dust emissions in the western Sahara during the summer are
region does not result in a strong increase in dust emissions
minor compared to the changes in early spring (Fig. 10).
before 4 ka BP (Fig. 7) because the vegetation cover is still
too dense.
www.clim-past.net/14/1051/2018/ Clim. Past, 14, 1051–1066, 20181060 S. Egerer et al.: Rapid increase in simulated North Atlantic dust deposition
Figure 9. Dust emissions (black), vegetation cover fraction (green), lake cover fraction (red) and precipitation (blue) in boxes of 2 × 2 grid
cells in North Africa (17◦ W–39◦ E, 10–30◦ N). The scales are similar to those in Fig. 8. The boxes in which strong changes in dust emissions
coincide with strong changes in lake level (blue), vegetation cover (green) or both (purple) are marked.
CCG103 close to the Bahamas (Williams et al., 2016) and
in the mid-North Atlantic (Middleton et al., 2018), we find
a somewhat steeper rise in dust deposition between 6 and
2 ka BP, which is less sharp compared to the rise in dust load-
ing close to the margin. The simulated dust deposition fluxes
agree for the mid-Holocene with the sediment records of
Williams et al. (2016) but are higher in the preindustrial sim-
ulation. In the mid-North Atlantic, simulated dust deposition
exceeds that indicated in the records (Middleton et al., 2018)
by an order of magnitude throughout the Holocene. The dis-
crepancy between simulated dust deposition and the data at
the more northern cores at the margin and at the more remote
cores may result from an overestimation of simulated dust
Figure 10. Mean seasonal cycle of simulated dust emissions in the
emissions. In our model, dried-out paleolakes are prescribed
western Sahara (15◦ W–2◦ E, 18–29◦ N) for all time slices. as preferential dust sources, meaning that for these areas the
threshold wind velocity necessary to enable dust emissions
is reduced. In contrast, recent satellite observations (Schep-
anski et al., 2012) indicate that the distribution of the main
4 Discussion and conclusion dust sources today is much more diverse. Due to the lower
temporal resolution at the northern and the remote cores and
We have found a rapid increase in simulated dust deposition due to the long distance between source and sink for the lat-
along the northwest African margin between 6 and 4 ka BP, ter, uncertainty is higher and an interpretation of changes in
which is consistent with the abrupt change in North Atlantic dust deposition remains difficult to assess for those cores.
dust deposition records around 20◦ N at about 5.5 ka BP (de- The particle size distribution in this study is nearly iden-
Menocal et al., 2000; Adkins et al., 2006) and 4.9 ka BP tical for all time slices to that in Egerer et al. (2016) (not
(McGee et al., 2013). The simulated dust deposition agrees shown), meaning that the discrepancy between simulated and
quantitatively well with the data for GC68 and ODP658 at observed main particle size still remains. Due to the smaller
around 20◦ N (Adkins et al., 2006; McGee et al., 2013), but particle sizes in the simulations, dust might be transported
is much higher in our simulations than observed for the more over longer distances, resulting in an overestimation at the
northern cores GC37 and GC49 throughout the Holocene. At more remote cores. As previously noted (Mahowald et al.,
the remote cores VM20-234 in the tropical North Atlantic,
Clim. Past, 14, 1051–1066, 2018 www.clim-past.net/14/1051/2018/S. Egerer et al.: Rapid increase in simulated North Atlantic dust deposition 1061 Figure 11. Simulated 925 hPa wind speed and directions for early spring (FMA, a, c) and summer (JAS, b, d) for 0k and for the difference between 6 and 0k. Figure 12. Simulated 10 m wind strength averaged over the western Sahara (15◦ W–2◦ E, 18–29◦ N) for early spring (FMA, a) and summer (JAS, b). 2014), the atmospheric surface concentration of dust parti- A sudden decline of vegetation cover is the key to explain- cles tends to be finer than those deposited at the surface. Ac- ing the sudden rise of western Saharan dust emissions and the cording to Mahowald et al. (2014), there is a tendency to- associated rapid increase in North Atlantic dust deposition wards a finer distribution of dust at the surface compared to in our simulations because in a previous study with a pre- dust deposition in the marine cores. However, this can prob- scribed linear decline of vegetation and lake surface fraction, ably not fully explain the large difference in particle size and the simulated dust emissions and deposition increased rather further attention is needed to tackle this issue. In our study, linearly (Egerer et al., 2017). Thereby, changes in simulated the focus lies on the relative changes in simulated dust depo- vegetation cover and dust emissions in the western Sahara sition fluxes rather than on absolute values, since it remains proceed much more rapidly than the insolation forcing. We difficult to compare observations and model results for the find a fast decline of vegetation cover in the western Sahara same particle size range. from 22 to 18◦ N in line with a strong reduction of precip- www.clim-past.net/14/1051/2018/ Clim. Past, 14, 1051–1066, 2018
1062                                               S. Egerer et al.: Rapid increase in simulated North Atlantic dust deposition

itation, which points to local vegetation–precipitation feed-       change in western Saharan vegetation, precipitation and dust
backs as suggested by (Brovkin et al., 1998) and (Claussen          emissions would be at least as abrupt as, if not even sharper
et al., 1999). Due to these feedbacks the transition from a wet     than, our current simulations. However, our simulated mid-
and vegetated state into a dry desert state may be accelerated.     Holocene vegetation is much more pronounced and shifted
Still, in our simulations we cannot demonstrate vegetation–         northward by about 6◦ compared to preindustrial vegetation.
climate feedbacks to be the definite cause for the rapid de-        Consistent with the mismatch between simulated vegetation
cline of vegetation. Alternatively, (Liu et al., 2006) proposed     and pollen records, ECHAM6–HAM2 is not capable to prop-
a precipitation threshold on vegetation growth as causing a         erly simulate the northward extent of the West African mon-
sudden shift in vegetation.                                         soon as indicated by paleodata (Bartlein, 2011). Neverthe-
   Besides vegetation–climate interactions, changes in lake         less, the mid-Holocene precipitation bias between our sim-
area cause a rapid dust emission increase in our simulations.       ulations and observations is less compared to the results of
The areas of the strongest and fastest change in dust emis-         most other CMIP5 models (Fig. 3). Still, the meridional dis-
sions are those of former paleolakes. In these areas, lakes         tribution of precipitation changes is not consistent with ob-
disabled dust emissions during the mid-Holocene. As soon            servations and requires further attention.
as the lakes desiccated, fine-grained material was favored to          In our simulations, the major changes in western Saha-
be deflated by surface winds, which makes them a highly             ran dust emissions occur in early spring (Fig. 10), which
productive dust source today. However, for the preindustrial        can be attributed to changes in dust sources (Fig. 9) but also
time slice, western Saharan dust emissions are likely overes-       to a strengthening of the trade winds (Fig. 11). During this
timated in our model due to the prescription of preferential        season, northeasterly trade winds in the western Sahara and
dust sources as discussed above. In contrast, satellite obser-      along the northwest African margin are mainly responsible
vations show less dust emission from dried-out paleolakes           for dust transport to the North Atlantic (Engelstaedter and
than previously thought (Schepanski et al., 2012). As a con-        Washington, 2007). However, maximum surface concentra-
sequence, changes in lake surface area presumably play a            tions of dust reflecting the low-level transport of Saharan
more minor role than our results suggest. In the model, a           air masses are observed in boreal winter (DJF) at the Cape
grid cell in which the lake cover fraction exceeds 50 % is          Verde islands (Fomba et al., 2014) and in the eastern trop-
considered a lake cell and dust emission is not possible. In        ical North Atlantic (Baker et al., 2013; Powell et al., 2015)
this way, an artificial threshold on dust emissions is created      for the present day, reflecting uncertainty in the exact tim-
as soon as the lake fraction falls below 50 %. This occurs in       ing of maximal dust fluxes. We find that the dynamics of
several grid cells in the western Sahara and the Bodélé De-         the simulated wind strength averaged over the western Sa-
pression, where lake levels were higher than 50 % during the        hara are similar to those of simulated dust emissions with
mid-Holocene. How does this affect the results of our study?        a rapid and strong shift, especially between 5 and 4 ka BP
The decline of lake surface area in this study is prescribed in     (Fig. 12). The rapid shift in the northeasterly wind strength
the same way as in our previous study (Egerer et al., 2017) in      in this study is consistent with changes in upwelling inferred
which we found a rather gradual increase in North Atlantic          from SST and biogenic flux records along the NW African
dust deposition despite this artificial threshold. Thus, the sud-   margin (Adkins et al., 2006; Romero et al., 2008; Bradtmiller
den decline of vegetation in the western Sahara rather than a       et al., 2016). Furthermore, the surface wind strength is con-
gradual desiccation of lakes is likely the trigger of the rapid     nected to the vegetation via the roughness length. The strong
dust deposition shift that we see in the current simulations. In    and fast decrease in vegetation in the western Sahara is con-
order to quantitatively separate the effect of decreasing veg-      sistent with the sudden acceleration of surface winds between
etation cover and the shrinking of lake surface area on the         5 and 4 ka BP. During the summer, when dust is transport
rapid increase in North Atlantic dust deposition, additional        within the Saharan Air Layer (Prospero et al., 2002; Engel-
sensitivity experiments are necessary.                              staedter and Washington, 2007) that is linked to the African
   During the mid-Holocene, the simulated vegetation does           Easterly Jet and the West African monsoon system, changes
not propagate as far north as indicated by pollen records           in dust emissions in the western Sahara between our simu-
(Fig. 2) and consequently too much dust is emitted from             lated time slices are minor. Thus, changes in the atmospheric
the uncovered soil. Causes for this deficiency might be the         circulation due to a shift of the summer monsoon are found
under-complex representation of North African vegetation by         to be less important in our study compared to the changes in
only a few plant functional types (PFT) in the model (Groner,       northeasterly winds in the western Sahara during early spring
2017) or the too-simple soil albedo scheme (Vamborg et al.,         concerning the rapid shift in North Atlantic dust deposition.
2011). If the simulated vegetation shifted as far north as in-         In the eastern Sahara, there is only a slight increase in sim-
dicated by pollen records, we suspect that the decline of veg-      ulated dust emissions north of 18◦ N between 6 and 5 ka BP.
etation in the western Sahara would be even stronger, result-       The rapid increase in simulated dust deposition in the North
ing in a higher contrast of dust emissions and the associated       Atlantic is hence rather determined by a sudden rise in dust
North Atlantic dust deposition between the mid-Holocene             deflation from western Saharan dust sources than by an in-
and the preindustrial era. Consequently, we expect that the         crease in eastern Saharan dust emissions. South of 18◦ N,

Clim. Past, 14, 1051–1066, 2018                                                                www.clim-past.net/14/1051/2018/
S. Egerer et al.: Rapid increase in simulated North Atlantic dust deposition                                                   1063

there is a strong but gradual decrease in vegetation cover       5    Conclusions
and precipitation roughly between 5 and 2 ka BP. In this area
where trees, grasses and shrubs coexist in our simulations,      To summarize our findings we answer the questions that we
the higher plant diversity could stabilize the system, which     posed in the introduction.
results in a more gradual vegetation decline as shown by
modeling studies (Claussen et al., 2013; Groner et al., 2015;        – Can we confirm an abrupt shift in North Atlantic dust
Groner, 2017). The vegetation in this area is too dense to en-         deposition in our simulations as found in marine sedi-
able dust emissions until 4 ka BP.                                     ment records?
   In addition to vegetation–climate feedbacks that might              We find a rapid shift in North Atlantic dust deposition
have caused the sudden decrease in vegetation cover in the             along the northwest African margin in our simulations
western Sahara, surface water–climate feedbacks (Krinner               at about 6 to 4 ka BP in agreement with marine sediment
et al., 2012), SST–climate feedbacks (Zhao et al., 2005) and           records at around 20◦ N.
SST–dust feedbacks (Williams et al., 2016) were proposed
as candidates to explain an abrupt end of the AHP. Due               – How is the shift in North Atlantic dust deposition linked
to the static prescription of lakes and SST in our simula-             to Saharan landscape and climate transition towards the
tions, we could not assess the contribution of these feed-             end of the AHP?
backs to an abrupt change in North Atlantic dust deposi-               The rapid shift in simulated North Atlantic dust depo-
tion. Based on previous studies (Kutzbach and Liu, 1997;               sition during the Holocene is linked to a fast decline of
Williams et al., 2016), we expect that the inclusion of an in-         vegetation cover and a strong reduction of lake surface
teractive ocean in the model would lead to a further strength-         area in the western Sahara accompanied by a fast de-
ening of the West African monsoon and a northward shift of             cline of precipitation and a rapid acceleration of surface
simulated vegetation during the mid-Holocene. This could               winds. The North African drying thereby proceeded
help to minimize the gap between simulated vegetation and              much more rapidly than changes in the insolation forc-
pollen records, which indicate more extensive precipitation            ing.
and vegetation north of 20◦ N compared to our simulations.
Part of the climate–ocean feedback is already taken into ac-         – How does the timing and the abruptness of Saharan
count because a change in SST is prescribed based on sim-              landscape and climate transition vary spatially?
ulations including an interactive ocean (Bader et al., 2018).          Our study emphasizes spatial and temporal heterogene-
We expect that the transition from the “green” Sahara to the           ity in the transition of the North African landscape and
present-day desert would be even more accelerated by taking            climate. Implications from local data records on the
all feedbacks into account. Therefore, the pace of the change          continental-scale North African landscape and climate
in simulated North Atlantic dust deposition and the Saharan            change thus have to be treated with caution.
landscape found in this study is presumably still a lower es-
timate.
   While a previous study associated the abrupt shift in North   Data availability. The data     are  accessible   at https:
Atlantic dust deposition indicated by sediment records with      //cera-www.dkrz.de/WDCC/ui/cerasearch/entry?acronym=DKRZ_
a large-scale change in North African landscape and climate      LTA_060_ds00002 (Egerer, 2018).
conditions (deMenocal et al., 2000), we argue that a spa-
tial distinction of dust source areas is necessary. Although
the sediment cores may be representative for northwestern        Author contributions. SE and MC designed the experiments. SE
Africa, they are not capable of explaining climate change        performed and analyzed the simulations and prepared the paper. All
in the whole area of North Africa. For instance, at specific     authors contributed to generating ideas, writing the article and dis-
sites, we see a gradual shift in vegetation cover in our sim-    cussing the results.
ulations as indicated by pollen data (Kröpelin et al., 2008)
and a gradual change in dust emissions as seen in recon-
structions of aeolian dust accumulation (Cockerton et al.,       Competing interests. The authors declare that they have no con-
                                                                 flict of interest.
2014) in contrast to the rapid changes in simulated vegeta-
tion cover and simulated dust emissions in the western Sa-
hara and the abrupt change in North Atlantic dust deposition.
                                                                 Acknowledgements. We thank Anne Dallmeyer (MPI-M)
The spatial and temporal heterogeneity in the transition of
                                                                 for preparation of the biome maps to evaluate the vegetation
the North African landscape found in our simulation implies      distribution. Further, we are grateful to Thomas Raddatz and
that conclusions from local data records on the continental-     Roberta D’Agostino (both MPI-M) for stimulating discussions.
scale North African landscape and climate change have to be      The ECHAM-HAMMOZ model is developed by a consortium
treated with caution.                                            composed of ETH Zurich, Max-Planck-Institut für Meteorologie,
                                                                 Forschungszentrum Jülich, University of Oxford, the Finnish

www.clim-past.net/14/1051/2018/                                                               Clim. Past, 14, 1051–1066, 2018
1064 S. Egerer et al.: Rapid increase in simulated North Atlantic dust deposition
Meteorological Institute and the Leibniz Institute for Tropospheric Charney, J. G.: Dynamics of deserts and drought in
Research; it is managed by the Center for Climate Systems the Sahel, Q. J. Roy. Meteorol. Soc., 101, 193–202,
Modeling (C2SM) at ETH Zurich. https://doi.org/10.1002/qj.49710142802, 1975.
Claussen, B. S., Brovkin. V., and Kleinen. T.: Simulated
The article processing charges for this open-access climate-vegetation interaction in semi-arid regions af-
publication were covered by the Max Planck Society. fected by plant diversity, Nature Geosci., 6, 954–958,
https://doi.org/10.1038/ngeo1962, 2013.
Edited by: Denis-Didier Rousseau Claussen, M., Kubatzki, C., Brovkin, V., Ganopolski, A., Hoelz-
Reviewed by: D. McGee and one anonymous referee mann, P., and Pachur, H.-J.: Simulation of an abrupt change in
Saharan vegetation in the Mid-Holocene, Geophys. Res. Lett.,
26, 2037–2040, https://doi.org/10.1029/1999GL900494, 1999.
Cockerton, H. E., Holmes, J. A., Street-Perrott, F. A., and Ficken,
K. J.: Holocene dust records from the West African Sahel
References and their implications for changes in climate and land sur-
face conditions, J. Geophys. Res.-Atmos., 119, 8684–8694,
Adkins, J., deMenocal, P., and Eshel, G.: The “African Humid https://doi.org/10.1002/2013JD021283, 2014.
Period” and the Record of Marine Upwelling from Excess D’Agostino, R., Lionello, P., Adam, O., and Schneider, T.: Fac-
230Th in ODP Hole 658C, Paleoceanography, 21, PA4203, tors controlling Hadley circulation changes from the Last Glacial
https://doi.org/10.1029/2005PA001200, 2006. Maximum to the end of the 21st century, Geophys. Res. Lett., 44,
Albani, S., Mahowald, N. M., Winckler, G., Anderson, R. F., Bradt- 8585–8591, https://doi.org/10.1002/2017GL074533, 2017.
miller, L. I., Delmonte, B., François, R., Goman, M., Heavens, N. Dallmeyer, A., Claussen, M., and Brovkin, V.: Harmonizing plant
G., Hesse, P. P., Hovan, S. A., Kang, S. G., Kohfeld, K. E., Lu, H., functional type distributions for evaluating Earth System Mod-
Maggi, V., Mason, J. A., Mayewski, P. A., McGee, D., Miao, X., els, Clim. Past Discuss., https://doi.org/10.5194/cp-2018-41, in
Otto-Bliesner, B. L., Perry, A. T., Pourmand, A., Roberts, H. M., review, 2018.
Rosenbloom, N., Stevens, T., and Sun, J.: Twelve thousand years deMenocal, P., Ortiz, J., Guilderson, T., Adkins, J., Sarnthein, M.,
of dust: the Holocene global dust cycle constrained by natural Baker, L., and Yarusinsky, M.: Abrupt onset and termination of
archives, Clim. Past, 11, 869–903, https://doi.org/10.5194/cp-11- the African Humid Period:: rapid climate responses to gradual
869-2015, 2015. insolation forcing, Quaternary Sci. Rev., 19, 347–361, 2000.
Armitage, S. J., Bristow, C. S., and Drake, N. A.: West Egerer, S: Data for publication “Rapid increase in simu-
African monsoon dynamics inferred from abrupt fluctuations lated North Atlantic dust deposition due to fast change of
of Lake Mega-Chad, P. Natl. Acad. Sci., 112, 8543–8548, northwest African landscape during the Holocene”, World
https://doi.org/10.1073/pnas.1417655112, 2015. Data Center for Climate (WDCC) at DKRZ, available
Baker, R. A., Adams, C., Bell, G. T., Jickells, D. T., and Ganzeveld, at: http://cera-www.dkrz.de/WDCC/ui/Compact.jsp?acronym=
L.: Estimation of atmospheric nutrient inputs to the Atlantic DKRZ_LTA_060_ds00002, 2018.
Ocean from 50°N to 50°S based on large scale field sampling: Egerer, S., Claussen, M., Reick, C., and Stanelle, T.: The link be-
Iron and other dust associated elements, Global Biogeochem. tween marine sediment records and changes in Holocene Saharan
Cy., 27, 755–767, https://doi.org/10.1002/gbc.20062, 2013. landscape: simulating the dust cycle, Clim. Past, 12, 1009–1027,
Bartlein, P.: Pollen-based continental climate reconstructions at 6 https://doi.org/10.5194/cp-12-1009-2016, 2016.
and 21 ka: a global synthesis, Clim. Dynam., 37, 775–802, Egerer, S., Claussen, M., Reick, C., and Stanelle, T.:
https://doi.org/10.1007/s00382-010-0904-1, 2011. Could gradual changes in Holocene Saharan landscape
Ben-Ami, Y., Koren, I., Rudich, Y., Artaxo, P., Martin, S. T., have caused the observed abrupt shift in North Atlantic
and Andreae, M. O.: Transport of North African dust from dust deposition?, Earth Planet. Sc. Lett., 473, 104–112,
the Bodélé depression to the Amazon Basin: a case study, At- https://doi.org/10.1016/j.epsl.2017.06.010, 2017.
mos. Chem. Phys., 10, 7533–7544, https://doi.org/10.5194/acp- Eichhorn, A. and Bader, J.: Impact of tropical Atlantic sea-surface
10-7533-2010, 2010. temperature biases on the simulated atmospheric circulation
Berger, A.: Long-term variations of daily insolation and quaternary and precipitation over the Atlantic region: An ECHAM6 model
climatic changes, J. Atmos. Sci., 35, 2362–2367, 1978. study, Clim. Dynam., 49, 1–15, https://doi.org/10.1007/s00382-
Bradtmiller, L. I., McGee, D., Awalt, M., Evers, J., Yerxa, 016-3415-x, 2016.
H., Kinsley, C. W., and deMenocal, P. B.: Changes in bi- Engelstaedter, S. and Washington, R.: Atmospheric controls on the
ological productivity along the northwest African margin annual cycle of North African dust, J. Geophys. Res.-Atmos.,
over the past 20,000 years, Paleoceanography, 31, 185–202, 112, https://doi.org/10.1029/2006JD007195, 2007.
https://doi.org/10.1002/2015PA002862, 2016. Engelstaedter, S., Tegen, I., and Washington, R.: North African
Brovkin, V., Claussen, M., Petoukhov, V., and Ganopolski, A.: dust emissions and transport, Earth-Sci. Rev., 79, 73–100,
On the stability of the atmosphere-vegetation system in the Sa- https://doi.org/10.1016/j.earscirev.2006.06.004, 2006.
hara/Sahel region, J. Geophys. Res.-Atmos., 103, 31613–31624, Fomba, K. W., Müller, K., van Pinxteren, D., Poulain, L., van
https://doi.org/10.1029/1998JD200006, 1998. Pinxteren, M., and Herrmann, H.: Long-term chemical charac-
Brovkin, V., Raddatz, T., Reick, C. H., Claussen, M., and terization of tropical and marine aerosols at the Cape Verde
Gayler, V.: Global biogeophysical interactions between Atmospheric Observatory (CVAO) from 2007 to 2011, Atmos.
forest and climate, Geophys. Res. Lett., 36, L07405,
https://doi.org/10.1029/2009GL037543, 2009.
Clim. Past, 14, 1051–1066, 2018 www.clim-past.net/14/1051/2018/You can also read


