The dust mass in Cassiopeia A from infrared and optical line flux differences
←
→
Page content transcription
If your browser does not render page correctly, please read the page content below
The dust mass in Cassiopeia A from infrared and optical line flux differences

                                                        Maria Niculescu-Duvaz,1 Michael J. Barlow,1 Antonia Bevan,1 Danny Milisavljevic,2 and Ilse De Looze3
                                                                  1 Dept.      of Physics & Astronomy, University College London, Gower St, London WC1E 6BT,UK
                                                                                         2 Department of Physics and Astronomy, Purdue University,
                                                                                           525 Northwestern Ave., West Lafayette, IN 47907, USA
                                                                        3 Sterrenkundig Observatorium, Ghent University, Krijgslaan 281 - S9, 9000 Gent, Belgium

                                                               The large quantities of dust that have been found in a number of high redshift galaxies have led to suggestions
                                                            that core-collapse supernovae (CCSNe) are the main sources of their dust and have motivated the measurement
                                                            of the dust masses formed by local CCSNe. For Cassiopeia A, an oxygen-rich remnant of a Type IIb CCSN, a
                                                            dust mass of 0.6-1.1 M has already been determined by two different methods, namely (a) from its far-infrared
                                                            spectral energy distribution and (b) from analysis of the red-blue emission line asymmetries in its integrated
                                                            optical spectrum. We present a third, independent, method for determining the mass of dust contained within
arXiv:2103.12705v2 [astro-ph.GA] 1 Jun 2021

                                                            Cas A. This compares the relative fluxes measured in similar apertures from [O III] far-infrared and visual-
                                                            region emission lines, taking into account foreground dust extinction, in order to determine internal dust optical
                                                            depths, from which corresponding dust masses can be obtained. Using this method we determine a dust mass
                                                            within Cas A of at least 0.99+0.10
                                                                                          −0.09 M .

                                                                   I.     INTRODUCTION                                 tained out to 30 µm, Douvion et al. [2001] derived a mass of
                                                                                                                       ∼90 K warm dust of at least 10−4 M . From a fit to IRAS 60-
                                                                                                                       and 100 µm fluxes, Arendt et al. [1999] estimated 0.038 M
                                                 The discovery of large quantities of dust in a number of
                                                                                                                       of 52 K dust to be present in Cas A. From far-infrared and
                                              high-redshift (z > 6) galaxies and quasars [e.g. Bertoldi et al.
                                                                                                                       submillimetre photometry out to 500 µm, a ∼35 K cold dust
                                              2003, Laporte et al. 2017, Watson et al. 2015] prompted a
                                                                                                                       mass of 0.06 M was estimated for Cas A by Sibthorpe et al.
                                              shift away from AGB stars being perceived as the primary
                                                                                                                       [2010] using AKARI and BLAST photometry, while 0.075 M
                                              dust factories in the Universe. Instead, it has been proposed
                                                                                                                       of ∼35 K dust was derived for Cas A by Barlow et al. [2010]
                                              that a significant fraction of cosmic dust, particularly at high
                                                                                                                       using Herschel PACS and SPIRE photometry over a similar
                                              redshifts, is formed in the ejecta of core-collapse supernovae
                                                                                                                       wavelength range. Arendt et al. [2014] analysed Spitzer and
                                              (CCSNe), with Morgan and Edmunds [2003] and Dwek et al.
                                                                                                                       Herschel-PACS data out to 160 µm and found ≤0.1 M of
                                              [2007] estimating that each CCSN would need to produce
                                                                                                                       dust emitting out to that wavelength. De Looze et al. [2017]
                                              ≥0.1 M of dust for this to be the case.
                                                                                                                       (DL2017) conducted a spatially resolved study of the dust in
                                                                                                                       Cassiopeia A (Cas A) using Spitzer and Herschel data out
                                                 Typically, the dust mass in CCSNe and supernova remnants              to 500 µm. They found that the largest proportion of the
                                              (SNRs) has been estimated by fitting the dust spectral energy            dust mass was in a cold dust component, which, similar to
                                              distribution (SED) at infrared wavelengths. Kuiper Airborne              SN 1987A, resided in the unshocked interior of Cas A. They
                                              Observatory and Spitzer Space Telescope mid-infrared obser-              derived the total ejecta dust mass in Cas A to be 0.5±0.1 M .
                                              vations of CCSNe ejecta made up to three years after out-                Priestley et al. [2019], modelled the thermal emission dust
                                              burst typically found warm dust masses of only 10−4 - 10−3               grains in Cas A heated by synchrotron radiation and parti-
                                              M to be present [e.g. Fabbri et al. 2011, Kotak et al. 2009,             cle collisions and found a dust mass in agreement with the
                                              Sugerman et al. 2006, Wooden et al. 1993]. However, Mat-                 DL2017 estimate. These results hint at the possibility that
                                              suura et al. [2011] utilised Herschel Space Observatory ob-              CCSNe could be the main contributors to the total dust bud-
                                              servations of SN 1987A taken 23 years after outburst to probe            get of the Universe. A larger sample of dust masses for a di-
                                              previously undetectable T∼23 K cold dust emitting at far-                verse range of CCSNe and SNRs, and measured with a diverse
                                              IR wavelengths and derived a cold dust mass of ∼0.5 M .                  range of techniques, together with tighter constraints on dust
                                              Follow-up ALMA observations of SN 1987A [Indebetouw                      destruction rates in SNR reverse shocks [e.g. Kirchschlager
                                              et al. 2014] resolved this dust component to be at the centre of         et al. 2020, 2019, Slavin et al. 2020] is needed to confirm this
                                              the remnant.                                                             view.
                                                 The 340-year old oxygen-rich supernova remnant Cas A                     As Herschel is no longer functioning, different methods
                                              has had a series of infrared-based measurements made of its              now have to be used if we are to determine dust masses for a
                                              dust mass and dust composition, with the derived mass in-                larger sample of CCSNe and SNRs. Lucy et al. [1989] showed
                                              creasing as observations at progressively longer wavelengths             that one can determine the mass of dust that has condensed in
                                              exposed emission from increasingly cooler dust. A broad 21               CCSNe ejecta by exploiting the red-blue asymmetries in the
                                              µm emission feature in the ISO-SWS spectrum of Cas A was                 optical broad line profiles. This effect is created by light from
                                              identified as a silicate species by Arendt et al. [1999]. This           the receding red-shifted side being absorbed by more dust than
                                              feature and its correlations with a range of Cas A physical              light from the approaching blue-shifted side. A. Bevan de-
                                              properties has been studied in detail by a number of subse-              veloped the Monte Carlo radiative transfer code DAMOCLES
                                              quent papers [Arendt et al. 2014, Douvion et al. 2001, En-               [Bevan and Barlow 2016], which models the red-blue asym-
                                              nis et al. 2006, Rho et al. 2008]. From ISO observations ob-             metries in CCSNe and SNRs to determine their dust proper-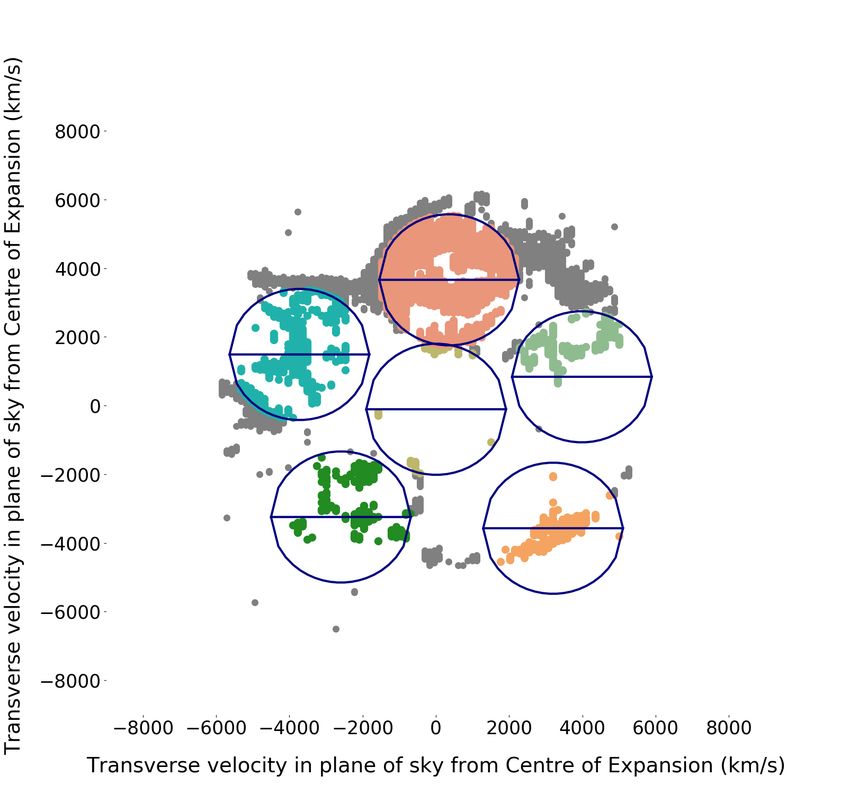
2

ties. The dust masses deduced using it for SN 1987A [Bevan             In Section 2 below we describe our optical and infrared line
and Barlow 2016] and Cas A [Bevan et al. 2017] are in good          measurements. In Section 3 we describe how we correct our
agreement with the dust masses from Herschel-based analy-           line fluxes for interstellar extinction. We then use the infrared
ses of the far-IR dust emission from SN 1987A and Cas A             fine structure line fluxes to predict the intrinsic optical line
[De Looze et al. 2017, Matsuura et al. 2011, respectively].         fluxes from the same ions, and compare the predicted optical
   Cas A is a young, oxygen-rich supernova remnant (SNR)            line fluxes with the interstellar extinction-corrected line fluxes
with an age of roughly 340 years [Fesen et al. 2006]. An            to determine internal dust optical depths and dust masses. In
expansion distance of 3.33±0.10 kpc has been determined             Section 4 we discuss a number of statistical and systematic
by Alarie et al. [2014], in good agreement with the earlier         sources of uncertainty for our derived quantities. In Section 5
expansion distance measurement by Reed et al. [1995] of             we discuss the future survivability of the dust in Cas A while
3.4+0.3
    −0.1 kpc. It is the result of a Type IIb supernova, classi-
                                                                    in Section 6 we present our conclusions.
fied by Krause et al. [2008] from a spectral identification of
light from the original explosion echoing off interstellar ma-
terial. Progenitor mass estimates for Cas A range from 15 - 25                      II.   OBSERVATIONAL DATA
M [e.g. Young et al. 2006]. It lies in the Perseus spiral arm
of the Milky Way and the light we receive from it experiences              A.   MDM Modular Spectrograph optical spectra
a large amount of interstellar extinction. Dunne et al. [2003]
attributed a cold dust component of around 3 M to Cas A                Two of the datasets used to make the 3D kinematic recon-
from SCUBA submillimetre polarimetric observations, but it          struction of Cas A by M2013 were used in this work. These
has been argued that most of the sub-mm emission was actu-          were taken in September 2007 and September 2008 and con-
ally from cold dust in a foreground molecular cloud complex         sisted of 58 and 45 long slit optical spectra respectively, cov-
[Krause et al. 2004, Wilson and Batrla 2005]. Whether there         ering the entire optically bright ring. The spectra were taken
is an interaction between Cas A and nearby molecular clouds         with the MDM Modular spectrograph on the Hiltner 2.4m
is also disputed. Ma et al. [2019] and Kilpatrick et al. [2014]     telescope at Kitt Peak. The dimensions of the long slit were
detected some CO-emitting regions around Cas A which they           200 × 50 , and successive slit positions were spaced by 300 , ori-
believed could indicate an interaction, whereas Zhou et al.         entated from North to South. The spectra covered a wave-
[2018] argued that the molecular cloud complex is in the fore-      length range of 4500-7700 Å with a resolution of 6 Å, cor-
ground of Cas A and not interacting with it.                        responding to a velocity resolution of 360 km s−1 at the air
   From X-ray observations, the ejecta has been observed to         wavelength of the 5006.843 Å transition of [O III]. The ex-
be impacted by a reverse shock [McKee 1974]. The kinematic          posure times for each long slit spectrum were 1000s. The slit
3D structure of Cas A’s ejecta has been studied by several au-      placements are shown in Figure 1 of M2013. An integrated
thors. The optically emitting ejecta has been mapped by Reed        spectrum of Cas A obtained by co-adding the 2007 and 2008
et al. [1995], by Milisavljevic and Fesen [2013] (M2013) and        long-slit datasets is shown in Figure 1.
by Alarie et al. [2014]. The 3D doppler reconstruction of              J2000 co-ordinates were assigned to each position. To illus-
M2013 is comprised of 1 pc diameter rings, which they in-           trate the optical structure of Cas A, ejecta knots were identi-
terpreted as cross sections of bubbles created by radioactive       fied by the presence of broad [O III] emission, as shown by the
56 Ni-rich ejecta inflating and compressing material. The Mil-      grey and coloured dots in Figures 2 and 3, where emission
isavljevic and Fesen [2015] study of the interior unshocked         knots falling within each of the ISO-LWS and PACS apertures
ejecta emitting in the near-IR supports this interpretation. De-    are coloured. Ballistic trajectories from the centre of expan-
Laney et al. [2010] also created a 3D doppler reconstruction        sion [Thorstensen et al. 2001] were assumed for all the ejecta
of Cas A using Spitzer data, mapping the reverse-shocked ring       knots. M2013 fitted a spherical expansion model to all of the
emitting in [Ar II] and [Ne III], as well as the unshocked inte-    identified ejecta knots, deriving a scale factor to convert from
rior emission which is bright in [Si II]. This led them to adopt    angular distance from the center of expansion (COE) to trans-
a disk model for Cas A tilted away from the plane of the sky.       verse velocity of 0.022 arcsec per km s−1 .
Assuming the reverse shock is spherical, they posited that the
fact that no optical emission is seen in the centre of Cas A
is because the reverse shock is currently interacting with the                    B. ISO-LWS Far-Infrared Spectra
edges of the tilted disk, and has not reached the centre yet.
   The goal of the current work is to use a new method to de-          Spectra of Cas A were taken in 1997 using the In-
termine ejecta dust masses at multiple locations around Cas A,      frared Space Observatory Long Wavelength Spectrometer
by comparing the relative intensities of far-infrared and opti-     [ISO LWS; Clegg et al. 1996, Swinyard et al. 1996] with six
cal forbidden emission lines in the same apertures from the         pointings on Cas A and one on offset position 4, using an 8400
same ions of oxygen, either neutral or doubly ionized. We as-       diameter circular aperture. The spectra had a spectral resolu-
sume that the infrared line intensities are unaffected by dust      tion of 0.3 µm from 43-92 µm , corresponding to velocity res-
extinction and reflect the intrinsic distributions of the given     olutions of 1737, 1424 and 1020 km s−1 at the vacuum wave-
species in Cas A, and that any deviations in the intensities of     lengths of the 51.815, 63.185 and 88.356 µm lines, respec-
the optical forbidden lines (after correction for significant in-   tively. The spectra were retrieved from the ISO LWS archive,
terstellar extinction) are due to internal dust extinction.         in a data type called “uniformly processed LWS L01 spectra”.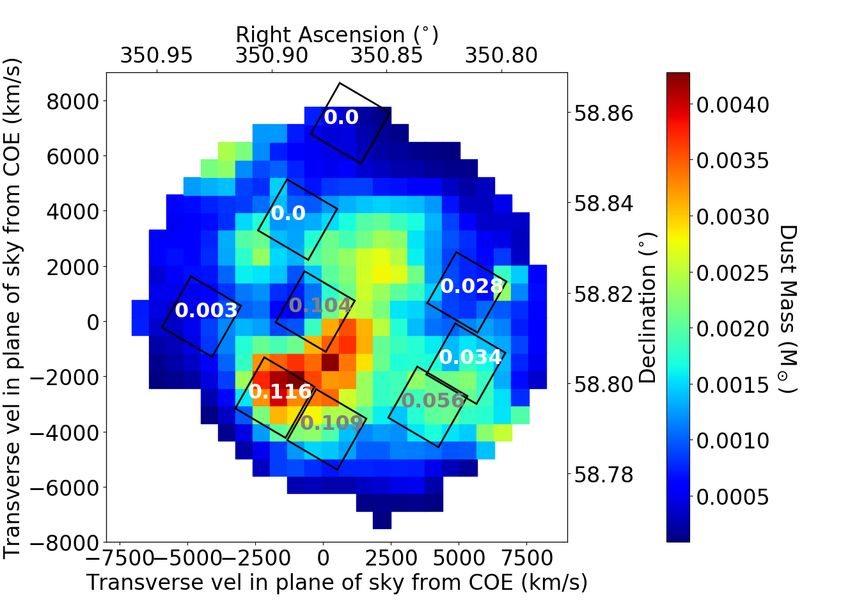
3
FIG. 1. The integrated spectrum of Cas A from the M2013 dataset, before correcting for interstellar extinction. For each slit placement, 450
one-dimensional spectra in apertures extracted from the long-slit spectra were co-added, then all 90 slit spectra were added together. The main
emission features are the [O III] 4959,5007 Å doublet, the [O I] 6300,6363 Å doublet, the [S II] 6717,6731 Å doublet, [Ar III] 7136 Å and the
[O II] 7320,7331 Å doublet. Gaps in the spectra are from where contaminating sky lines have been removed.
The observations are summarized in Table 2 of Docenko and were co-added.
Sunyaev [2010]. The positions of the six LWS apertures are All spaxels from the M2013 optical dataset that spatially
shown in Figure 2 in a transverse velocity frame, where the coincided with each ISO-LWS and PACS-IFU aperture were
velocities of the centre of the aperture are given with respect summed together. The optical spectra were convolved to have
to the same centre of expansion (COE) as for the optical data. the same spectral resolution of the ISO-LWS spectrum of the
52 µm line, which was 1700 km s−1 . The [O III] 4959,5007
Åand [O I] 6300,6363 Ådoublets were extracted from the op-
C. PACS-IFU Far-Infrared Spectra tical spectra. Adopting an intrinsic [O I]6300/6363 Å inten-
sity ratio of 3.13 [Baluja and Zeippen 1988], the [O I] 6363 Å
Spectroscopic observations with the Herschel PACS-IFU component was deblended from the [O I] 6300 Å component.
[Poglitsch et al. 2010] were taken in chopping mode for 9 The 4959 Å contribution to the [O III] 4959,5007 Å doublet
regions around Cas A, on January 1st 2011. The central was also removed, assuming a doublet intensity ratio of 1:2.98
WCS co-ordinate of each aperture is summarized in Table 1 [Storey and Zeippen 2000]. All optical and infrared integrated
of DL2017. The PACS-IFU apertures were orientated at a po- fluxes of the continuum-corrected ISO-LWS and PACS-IFU
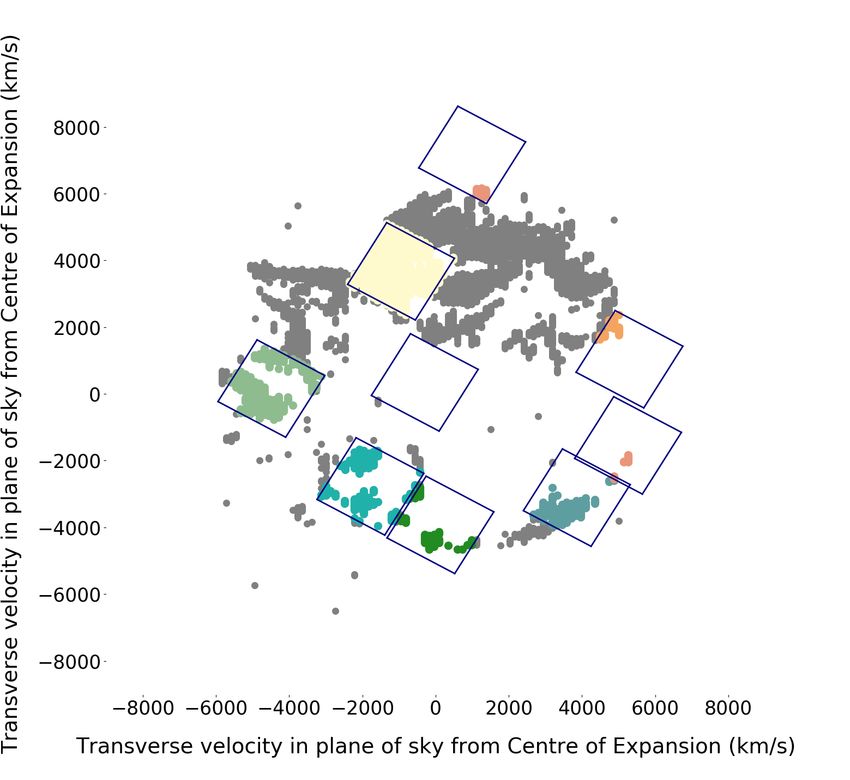
sition angle of 240◦ and are shown in Figure 3. We made use spectra were calculated using the FLUX utility in DIPSO.
of spectra in the wavelength range 70-105 µm, taken with the
SED Range Mode B2B + Long R1. The spectral resolution at
90 µm was 120 km s−1 . The PACS spectra had been reduced
using the standard PACS chopped large range scan pipeline in E. ISO-LWS and PACS-IFU line profile comparison
HIPE v14.0.0, with the PACS CAL 32 0 calibration file. The
flux calibration uncertainty for the PACS line measurements
Aperture 6 of the ISO LWS dataset and aperture 4 of the
was assumed to be 13 per cent for our wavelength region of
PACS-IFU dataset cover very similar regions of Cas A, as
interest.
seen in Figures 2 and 3. Figure 4 shows the [O III] 88 µm
line profiles from these overlapping apertures of the LWS and
PACS datasets. The spectrum from PACS aperture 4 has been
D. Spectral Processing convolved to the resolution of the ISO spectra. Both the line
shapes and their integrated fluxes agree quite well, consider-
The optical and IR spectra were manually continuum- ing the different aperture sizes. The flux of the [O III] 88 µm
corrected using the DIPSO package [Howarth et al. 2004]. The line in LWS aperture 6 was 4.34 × 10⁻¹¹ ergs cm−2 s−1 and
twenty-five 9.400 × 9.400 spaxels in each PACS-IFU pointing in PACS-IFU aperture 4 was 2.81 × 10⁻¹¹ ergs cm−2 s−1 .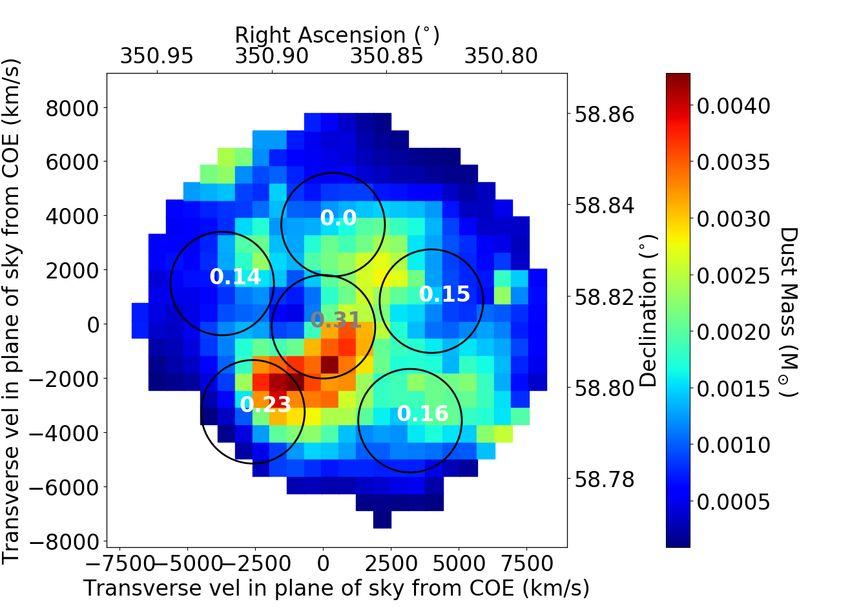
4

                                      2
                      5                               7
                                      1

                          6                       3

                                                                         FIG. 4. The [O III] 88 µm line profile in Herschel PACS-IFU aper-
                                                                         ture 4 and in ISO-LWS aperture 6. The PACS spectrum has been
                                                                         convolved to the resolution of the LWS spectrum.

FIG. 2. The circles show the ISO-LWS pointing apertures, numbered
by how they appear in the archive. The WCS centre co-ordinates
were determined from the ISO LWS archive, and converted to veloc-
ities from the centre of expansion using the same M2013 technique
as for the optical dataset. Filled points show where [O III] 5007
Å emission was detected in spectra from the M2013 dataset. The
multi-coloured points show where such emission fell within each of
the ISO-LWS apertures.

                                              2

                                  7                                      FIG. 5. The [O III] 52 µm line profile (black) summed over all six
                                                                         ISO-LWS apertures, compared to the 5007 Å line profile (red) corre-
                                                                         sponding to a summation over the same projected aperture areas. The
                                                          3              two profiles have been normalised to the same peak value. It can be
                     6                1
                                                                         seen that relative to the 52 µm profile the optical 5007 Å profile has a
                                                          9              deficit of redshifted emission, attributable to internal dust extinction.
                              4                       8
                                          5
                                                                            III.   DETERMINING DUST MASSES FROM OPTICAL
                                                                                      AND IR LINE FLUX DIFFERENCES

                                                                            The procedure we will follow is based on using the mea-
                                                                         sured IR fine structure line fluxes of [O III] and [O I] to predict
                                                                         unreddened optical line fluxes from the same species and then
                                                                         comparing these predicted fluxes with those observed through
                                                                         the same aperture areas in order to estimate the optical ex-
FIG. 3. The diamonds show the PACS-IFU pointing apertures for            tinction affecting each aperture. This extinction is assumed
Cas A. The WCS centre co-ordinates were taken from Table 1 of            to consist of two components - the first being foreground in-
DL2017 and converted to velocities from the centre of expansion us-      terstellar dust extinction and the second being extinction due
ing the same M2013 technique as for the optical dataset. Filled points   to dust internal to the remnant. In the next subsection we de-
show where [O III] 5007 Å emission was detected in the M2013            scribe how we estimate the foreground interstellar extinction
dataset. The multi-coloured points show where such emission fell
                                                                         for each aperture position. Our internal dust extinction esti-
within each of the PACS apertures.
                                                                         mate implicitly places the internal dust in a screen near the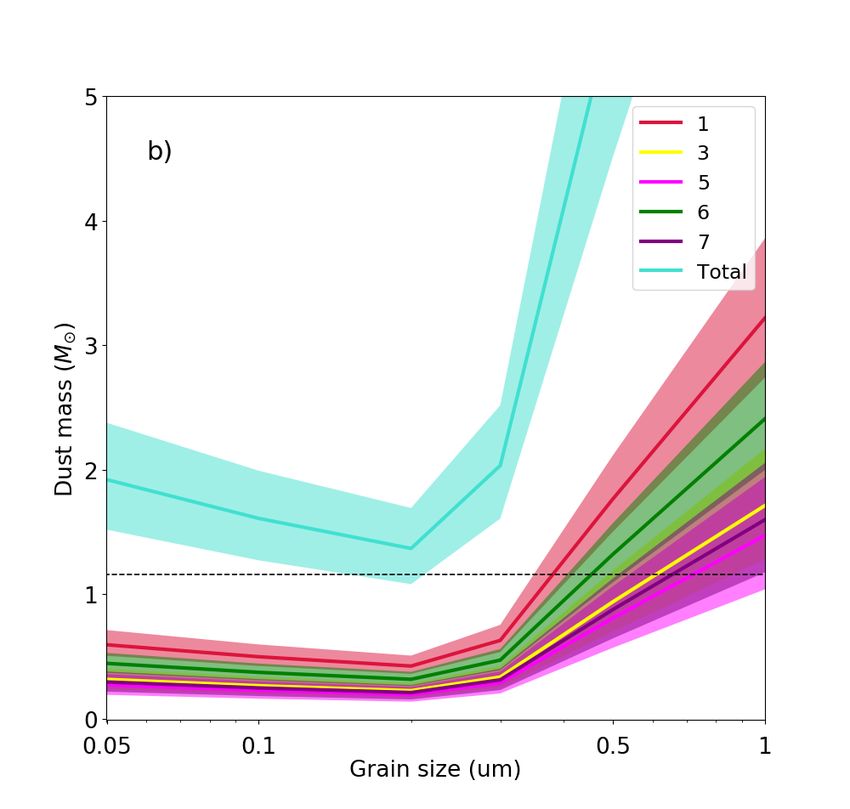
5

front of the remnant rather than being mixed with the emit-         6 as a colour map, along with the distribution of the optical
ting gas throughout the remnant. However we show in Sec-            emission knots in Cas A, shown as black points. The white
tion 4.3, via numerical modelling of gas and dust mixed in          regions show where no ISM dust columns densities could be
either smooth or clumped distributions, that the dust optical       estimated due to the corresponding far-IR dust emission being
depths measured by our empirical method should be within            too faint (DL2017). For each LWS and PACS-IFU aperture,
20 percent of actual dust optical depths when the dust is mixed     we calculated a mean AV value averaging over every pixel of
with the emitting gas throughout the remnant. One predic-           the DL2017 interstellar dust extinction map which fell within
tion from internal dust extinction models is that redshifted        each aperture. These mean extinctions range from AV = 3.9
gaseous line emission from the receding farside of the rem-         mag for LWS aperture 2 and PACS-IFU aperture 7, both at
nant should undergo more extinction by internal dust when           the northern part of the remnant, to AV = 9.1 mag for LWS
traversing the nebula to the observer, than will blueshifted line   aperture 3 and 10.3 mag for PACS-IFU aperture 9, both at the
emission from the approaching nearside of the remnant. This         southwestern part of the remnant.
prediction is confirmed by Figure 5, which shows the [O III]           Although there is no way of quantifying from this map how
52 µm velocity profile summed over the six LWS apertures            much of the extinction in each pixel is in front of Cas A and
and compares it with the 5007 Å velocity profile summed over       how much is behind, we can show that at least a portion of
the same six areas. The 5007 Å line is clearly missing flux on     the interstellar extinction, for some regions, must lie behind
the reshifted side of its profile.                                  Cas A. We dereddened all the optical emission knots of Cas A
   Cas A has a complex internal structure [see e.g. Fesen et al.    with the total AV value from the closest pixel in the DL2017
2001] but our method makes no assumptions about where the           ISM dust map and compared the fluxes from two [O III] emis-
doubly ionized and neutral oxygen species are located along         sion knots before and after dereddening: one in the northern
the lines of sight projected through the remnant by the ob-         region and one in the southwestern region. Before deredden-
serving apertures, e.g. whether they are centrally or uniformly     ing, these had fairly similar fluxes of 9.8 × 10⁻¹⁷ and 1.3 ×
distributed, or whether in clumped or unclumped regions. The        10−16 ergs cm−2 s−1 , respectively. The northern knot corre-
measured emission line fluxes are summations along the lines        sponds to a total ISM AV from DL2017 of 3.6 magnitudes,
of sight of the emission from the various regions encountered,      while the southwestern knot corresponds to an ISM AV of 9.7
weighted by their electron densities and (in the case of the        mags. The fluxes after dereddening were 2.7 × 10⁻¹⁵ and
optical lines) by their electron temperatures. The values de-       1.0 × 10⁻¹² ergs cm−2 s−1 for the northern and southwest-
rived for these two quantities reflect these weightings, with       ern knot, respectively. It seems very unlikely that two optical
electron densities derived from [O III] 52/88 µm flux ratios        knots, both with presumably similar density and temperature
being insensitive to the electron temperature Te , while the 52     conditions, would have an intrinsic flux difference of a factor
µm/5007 Å Te -diagnostic ratio will be weighted to lower Te        of nearly 1000, implying that at least part of some of the ISM
values than the classic [O III] 5007/4363 Å optical-only line      extinction columns must lie behind Cas A.
diagnostic ratio.                                                      In an attempt to better constrain the proportions of the total
   Priestley et al. [2019] modelled the heating sources for         interstellar dust columns that lie in front of Cas A, we used
Cas A’s dust emission and fitted the overall IR SED with            the 3D dust reddening map created by Green et al. [2019]
four dust components. The two warmest dust components,              (G2019), to plot the reddening as a function of distance along
accounting for less than 1 percent of the total dust mass be-       different sightlines towards Cas A. We used the BayestarWe-
tween them, were respectively heated by the X-ray emitting          bQuery1 function in the dustmaps python package to query
diffuse reverse shocked ejecta and by the X-ray emitting ma-        a grid of 1600 galactic co-ordinates close to Cas A. The
terial swept up by the outer blast wave. A cold ‘pre-reverse        coloured rhombuses in Figure 6 show each voxel of the G2019
shock’ dust component heated by synchrotron radiation ac-           map around Cas A, while Figure 7 plots the extinction AV
counted for 90 percent of the dust mass. Their ‘clumped’            versus distance relation for each voxel, where the colour of
gas component, with ne = 480 cm−3 and Te = 104 K, corre-            the curve matches the colour of the voxels shown in the dust
sponded most closely to the [O III] emission analysed here,         reddening map. We use the distance to Cas A of Alarie et al.
                                                                                    +0.10
with the dust component heated by it accounting for only            [2014] of 3.33−0.10   kpc, and this is plotted as the blue vertical
10 per cent of the total dust mass. The synchrotron-heated          line, where the broad red bar indicates the uncertainty on this
cold dust component is expected to account for most of the          value.
internal optical obscuration.                                          The curves in Figure 7 confirm the DL2017 finding that
                                                                    sightlines towards the western and southern regions of Cas A
                                                                    have the largest interstellar dust columns. The DL2017 map
    A.   Dereddening the optical line fluxes for interstellar       also shows that the northern regions of Cas A correspond to
                         extinction                                 the lowest interstellar dust columns. From Figure 7 we see
                                                                    that for the northern region of Cas A the relevant G2019 curve
   It is important to correct the optical fluxes in our dataset     (magenta) predicts AV = 4.0 mag at the distance of Cas A,
for extinction by interstellar dust. A map of interstellar ex-
tinction towards Cas A, shown in Figure F4 of DL2017, gives
the column density of extinction, represented by AV , along
                                                                    1   http://argonaut.skymaps.info/usage
sightlines near to and through Cas A. This is plotted in Figure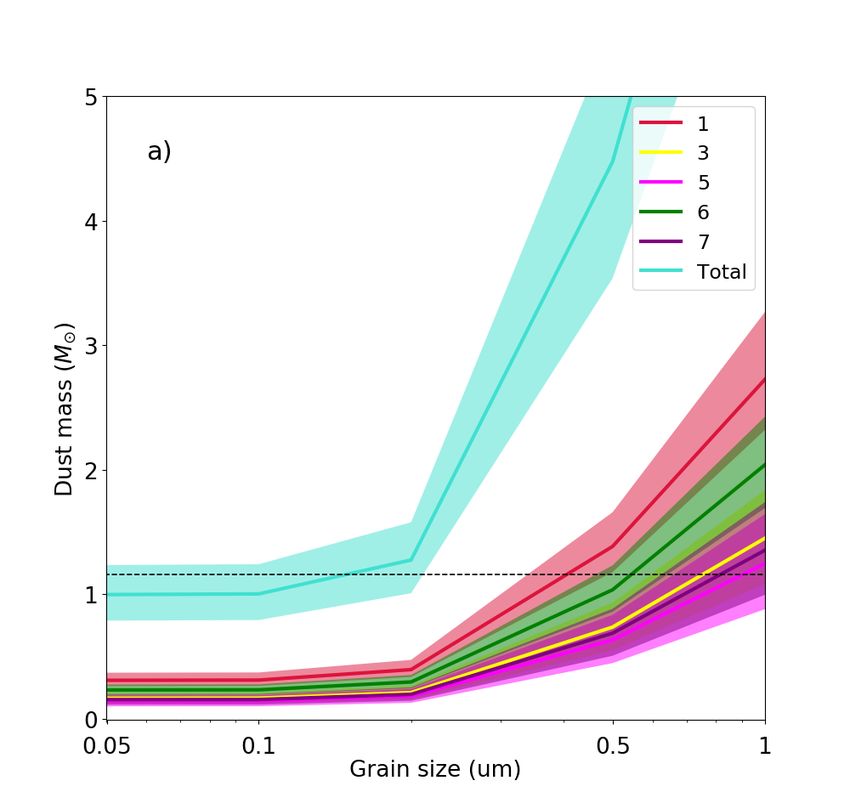
6

FIG. 6. The coloured rhombuses show the voxels of the G2019 3D        FIG. 7. Extinction in Av magnitudes as a function of distance, for
reddening map which overlie Cas A. They have a scale of 3.4’ on       the four voxels of the G2019 map plotted as colored rhombuses in
a side (Table 5 in G2019). The black dots show optical emission       Figure 6. The colours of the curves indicate the locations where the
knots in Cas A, from the M2013 dataset. The colour map shows          extinction curves are calculated, and correspond to the colours of
the visual extinction of ISM dust, in magnitudes, along sightlines    the rhombuses in Figure 6. The vertical blue bar corresponds to the
towards Cas A, from Figure F4 of DL2017.                              Alarie et al. [2014] distance to Cas A of 3.33 kpc, with the broad
                                                                      red vertical bar corresponding to the stated errors on their estimate
                                                                      of this distance.

similar to the DL2017 prediction of a total AV of 3.8 mag
at the position of LWS aperture 2. For apertures falling on
northern parts of the remnant (LWS aperture 2 and PACS-IFU
aperture 7) we have therefore assumed that all of the interstel-
lar dust column lies in front of the remnant.
   It is notable that the other three extinction versus distance
curves that are plotted in Figure 7 all show a flattening at or
near to the distance of Cas A and that they predict maximum
extinctions that are significantly lower than measured for the
same positions from the DL2017 map in Figure 6. The flat-
tening is likely due to increasing extinction with distance be-
yond Cas A leading to the G2019 algorithm running out of
detectable stars with which to measure distances and extinc-
tions.
   So apart from the northern LWS-2 and PACS-7 apertures,
                                                                     FIG. 8. The ne and Te loci corresponding to the [O III] 5007 Å/52
for which we have argued that all of the DL2017 extinction           µm and 52/88 µm line flux ratios for LWS aperture 2 are plotted
column is in front of the remnant, we will assume that for           as the red and blue solid lines, respectively, with the dashed lines
the remaining apertures only 50 per cent of the DL2017 ISM           corresponding to the upper and lower limits on each ratio.
extinction columns lie in front of the remnant. This leads to
adopted foreground AV values for these apertures that are sim-
ilar to those discussed above for the northernmost apertures -       and PACS aperture can be found in Tables I, III and V. These
see column 6 of Table I for a comparison for A5007 .                 values of Aλ were applied to the optical fluxes in the LWS
   In Section 4.2 we will consider the effect on the derived         and PACS apertures, to give the ISM-dereddened F5007,d and
dust masses of assuming that the interstellar dust columns in        F6300,d fluxes shown in those tables.
front of the remnant are exactly as predicted by the G2019
extinction versus distance curves.
   With the above assumptions we calculated a mean fore-              B.   Using infrared line fluxes to estimate intrinsic optical line
ground AV value for each aperture using every spaxel of the                                        fluxes
DL2017 interstellar dust extinction map which fell within a
given aperture. We used these foreground AV values for each             The 52 µm and 88 µm lines of [O III], both observed from
aperture to calculate Aλ at 5007 Å and 6300 Å assuming RV          Cas A by the ISO LWS, are at sufficiently long wavelengths
= 3.1 and adopting the reddening law of Cardelli et al. [1989].      that dust extinction effects can be neglected, unlike the case
The values of Aλ for the two optical lines and for each LWS          of the 5007 Å line of [O III]. The flux ratio of the latter opti-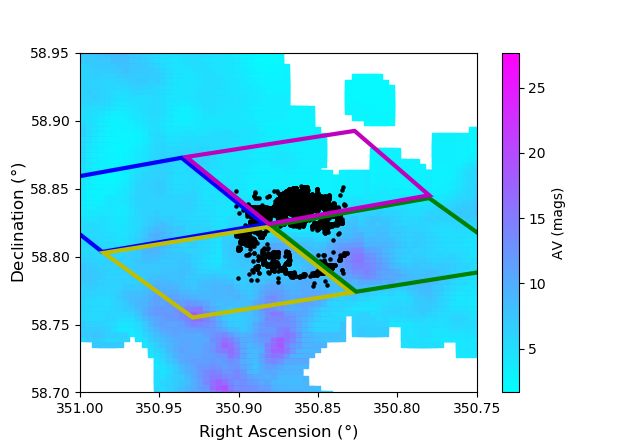
7

cal transition to either of the infrared transitions is a sensitive   52/88 µm density diagnostic is not available. To evaluate pre-
function of both the local electron density ne and electron tem-      dicted 5007 Å/88 µm line flux ratios for each IFU aperture,
perature Te and so we can use the IR line fluxes to predict the       we adopted electron densities corresponding to those found
unreddened optical line flux if we know the values of ne and          for the nearest, usually overlapping, LWS apertures. So for
Te . The 52/88 µm flux ratio is sensitive to ne across the den-       PACS-IFU apertures 1, 3, 4, 5, 6, 7, 8 and 9 we adopted the
sity range 100 < ne < 104 cm−3 but is insensitive to Te due to        electron densities listed in Table I for LWS apertures 1, 7, 6,
the very low excitation energies of the two IR transitions. We        6, 5, 2, 3 and 3, respectively. PACS-IFU aperture 7 overlaps
have used this flux ratio and the statistical equilibrium code        LWS aperture 2 in the northern region of Cas A, for which
EQUIB (written by S. Adams and I. Howarth), together with             we have argued that all of the interstellar dust column is in
the O2+ collision strengths of [Aggarwal 1983] and the tran-          front of the remnant. The ratio of its ISM-dereddened 5007
sition probabilities of [Nussbaumer and Storey 1981], to de-          Å flux listed in column 5 of Table III to its 88 µm flux listed
                                                                                             +2.10
rive the values of ne that correspond to each of the six LWS          in column 2 of 8.96−1.15      implies an electron temperature Te =
aperture regions shown in Figure 2. Column 1 of Table I lists         8100−400 K for ne = 1380+435
                                                                            +600                              −3
                                                                                                     −420 cm , in good agreement with
the LWS aperture numbers, followed by the F52 /F88 flux ra-                                      +400
                                                                      the value of Te = 7900−700 K found for the overlapping LWS
tios and the corresponding values of ne , which range from            aperture 2. We adopted an electron temperature Te of 7900 K
1380 cm−3 for LWS aperture 2 down to 115 cm−3 for LWS                 for all apertures in order to estimate the expected 5007 Å line
aperture 1.                                                           flux, F5007,exp , using the 88 µm line flux. For regions of Cas A
   To predict the 5007 Å line flux from an IR line flux the value    other than PACS aperture 7 in the north we again assumed that
of the electron temperature is also needed. A value for Te can        half of the interstellar dust column lies in front of the remnant
be estimated for LWS aperture 2, for which we have argued             in order to calculate the ISM-dereddened 5007 Å flux, F5007,d .
that all of the interstellar extinction column is in front of the     The ratio of F5007,exp to F5007,d then yields the internal dust op-
remnant. Our method also implicitly assumes that the internal         tical depths, τint , that are listed in column 7. Table IV lists the
extinction in LWS aperture 2 is very low, consistent with the         statistical uncertainties on the measured and derived quantities
low internal dust columns found in the northernmost part of           in Table III.
the remnant by [De Looze et al. 2017, their Fig. F3] The ra-             The optical [O III] spectra falling within apertures 1 and
tio of the LWS Aperture-2 ISM-dereddened 5007 Å line flux            9 of the PACS-IFU dataset show no obvious [O III] 5007 Å
(column 7 of Table I) to its 52 µm line flux (column 4) yields        emission features. To calculate upper limits for the 5007 Å
Te = 7900+400                       +435   −3
           −700 K, for ne = 1380−420 cm . Figure 8 shows for          fluxes in these apertures, we used the largest peak in the aper-
LWS aperture 2 the loci of the ne and Te solutions for the 5007       ture 6 spectrum, with a flux of 1.4×10⁻¹³ ergs cm−2 s−1 , as
Å/52 µm and 52/88 µm flux ratios of 2.43+0.50               +0.65
                                              −0.68 and 3.25−0.59 ,   a test emission feature. We found that co-adding a spectrum
with the dashed lines showing the loci corresponding to the           containing only this peak feature, scaled by factors of 0.2 and
upper and lower limits on the flux ratios.                            0.3 to the spectra in apertures 1 and 9, respectively, resulted in
   Our [O III] electron density and temperature derived for           spectra where the peak of the feature could just about be de-
LWS aperture 2 are consistent with the range estimated by Do-         tected reliably. The resulting fluxes are adopted as 3-σ upper
cenko and Sunyaev [2010] for the same aperture. Our [O III]           limits in Table III.
Te and ne values for LWS aperture 2 are also consistent with             We also have available for comparison optical and infrared
those estimated by Rho et al. [2019] from SOFIA spectra of            line fluxes from a second ion, namely the 6300 Å and 63 µm
a region in the northern part of the remnant encompassed by           transitions of [O I]. The measured line fluxes are listed in Ta-
LWS aperture 2. Our electron densities are consistent with the        ble V. Fluxes for the 63 µm line were measured only for the
range mapped over Cas A by Smith et al. [2009] using Spitzer          LWS apertures, since the PACS-IFU apertures did not provide
IRS measurements of the [S III] 18.7/33.6 µm line flux ratio          enough detections of this line. The LWS observations did not
(see their Fig. 6).                                                   provide enough detections of the [O I] 146 µm line for it to
   Since Te usually varies far less than ne in an ionized nebula,     be usefully compared to the 63 µm line. The LWS observa-
we have used the LWS aperture 2 value of Te = 7900 K along            tions of Cas A included a position [aperture 4; see Fig. 4 of
with the values of ne listed in column 3 to predict the 5007 Å       Docenko and Sunyaev 2010] which was offset to the northeast
/52 µm flux ratio for each LWS aperture. We then multiplied           from the remnant. No [O III] 52- or 88 µm emission was de-
this ratio by the F52 line fluxes listed in column 4 of Table I       tected at this position but [O I] 63 µm emission was detected
to obtain the expected 5007 Å flux in the absence of any dust        there, which we attribute to a diffuse interstellar source. We
extinction, F5007,exp , as listed in column 8. This expected flux     therefore subtracted the aperture 4 LWS spectrum from those
can be compared to the ISM-dereddened flux from column 7              obtained from the on-source apertures prior to measuring the
to obtain an estimate for the internal dust optical depth, τint       net 63 µm line emission in the latter. Since the diffuse inter-
(column 9), for each aperture projection through Cas A. Ta-           stellar [O I] contribution may vary across Cas A, this must be
ble II lists the statistical uncertainties for the measured and       considered as an additional source of uncertainty - one which
derived quantities that are listed in Table I; the uncertainties      does not affect the [O III] line flux measurements.
were combined and propagated in quadrature as appropriate.               We can use the [O I] 63 µm line fluxes to predict the unred-
   Similar results for the [O III] optical and IR line fluxes         dened flux in the 6300 Å line. This can then be compared
falling within the PACS-IFU apertures are presented in Ta-            to the ISM-dereddened 6300 Å flux in order to evaluate the
ble III. The PACS spectra do not cover the 52 µm line, so the         internal dust extinction in each aperture. The 6300 Å/63 µm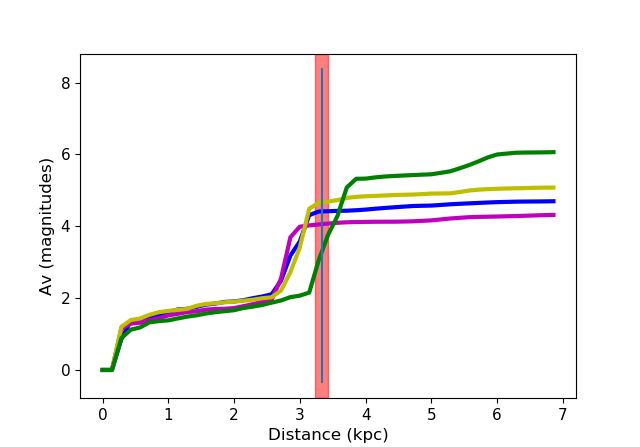
8

TABLE I. Columns from left to right are: ISO-LWS aperture number; F52 /F88 , the observed [O III] 52 µm to 88 µm flux ratio; the corre-
sponding electron density Ne for an electron temperature of 7900 K; F52 , the observed [O III] 52 µm flux; the observed [O III] 5007 Å flux,
F5007 ; A5007 , the estimated ISM extinction at 5007 Åin magnitudes; the ISM-dereddened 5007 Å flux, F5007,d ; the expected [O III] 5007 Å
flux (F5007,exp ) in each aperture for no internal dust extinction; and the internal optical depth, τint , and dust mass, Md , implied by the difference
between the ratios of the predicted and ISM-dereddened [O III] 5007 Å fluxes for cylinders projected through each ISO-LWS aperture. All
fluxes are in units of ergs cm−2 s−1 .
                       Ap F52 /F88 Ne (cm−3 ) F52              F5007         A5007 F5007,d         F5007,exp       τint Md (M )
                       2     3.25      1380 1.23×10⁻¹⁰ 5.62×10⁻¹² 4.32 2.99×10⁻¹⁰ -                                -          -
                       1     0.87       115     7.42×10⁻¹¹ 8.42×10⁻¹⁴ 4.85 7.33×10⁻¹² 1.23×10⁻¹⁰ 2.82                      0.31
                       3     2.05       630     7.47×10⁻¹¹ 2.84×10⁻¹³ 5.11 3.14×10⁻¹¹ 1.41×10⁻¹⁰ 1.50                      0.16
                       5     1.15       225     2.77×10⁻¹¹ 5.17×10⁻¹³ 3.48 1.27×10⁻¹¹ 4.62×10⁻¹¹ 1.29                      0.14
                       6     2.42       830     8.30×10⁻¹¹ 4.26×10⁻¹³ 4.21 2.06×10⁻¹¹ 1.69×10⁻¹⁰ 2.11                      0.23
                       7     1.18       240     7.60×10⁻¹¹ 5.84×10⁻¹³ 4.32 3.12×10⁻¹¹ 1.27×10⁻¹⁰ 1.40                      0.15
                                                                                                                   Total 0.99

            TABLE II. Corresponding absolute uncertainties on the values in Table I. All fluxes are in units of ergs cm−2 s−1 .
   Ap F52 /F88     Ne     F52 (×10−12 ) F5007 (×10−14 )     A5007     F5007,d (×10−12 ) F5007,exp (×10−11 )         τint        Md (M )
       +     -   +    -     +      -     +       -         +      -    +          -        +          -           +      -      +     -
    2 0.65 0.59 435 420 16        11    24      19       0.26 0.03 33.6         71.0        -         -           -      -      -     -
    1 0.14 0.13 55 50 4.0        1.7 3.3        2.3      0.09 0.23 3.1           2.0      4.5        3.9        0.56 0.42 0.058 0.043
    3 0.55 0.41 290 195 8.2 10.6 5.2            4.7      0.03 0.00 5.3           5.0      1.8        4.8        0.40 0.38 0.040 0.037
    5 0.29 0.30 120 115 7.7      9.1 3.8        3.5      0.00 0.06 1.8           1.5      0.7        1.7        0.41 0.38 0.042 0.039
    6 0.61 0.53 360 270 13.4 11.6 2.5           2.8      0.03 0.02 2.3           2.4      2.2        5.8        0.40 0.36 0.042 0.038
    7 0.24 0.38 100 150 7.6 11.4 3.6            3.9      0.01 0.09 4.5           3.5      1.7        4.5        0.40 0.37 0.040 0.037
                                                                                                                       Total 0.10 0.09

TABLE III. Columns from left to right are: PACS aperture number; the [O III] 88 µm flux; the [O III] 5007 Å flux; A5007 , the ISM extinction
at 5007 Åin magnitudes; the ISM-dereddened 5007 Å flux; the expected optical [O III] 5007 Å flux in each aperture for no internal dust
extinction, F5007,exp ; the optical depth, τint , and dust mass, Md , implied by the ratio of the predicted and ISM-dereddened [O III] 5007 Å fluxes
within the rectangle projected by each PACS aperture onto Cas A. All fluxes are in units of ergs cm−2 s−1
                                Ap F88              F5007         A5007 F5007,d           F5007,exp      τint   Md (M )
                                1 3.08×10⁻¹¹ 0.104
                                3 1.10×10⁻¹¹ 1.02×10⁻¹³ 5.13 1.15×10⁻¹¹ 2.19×10⁻¹¹ 0.64                           0.028
                                4 2.02×10⁻¹¹ 1.82×10⁻¹³ 3.96 6.98×10⁻¹² 1.00×10⁻¹⁰ 2.67                           0.116
                                5 1.32×10⁻¹¹ 4.74×10⁻¹⁴ 5.13 5.34×10⁻¹² 6.55×10⁻¹¹ 2.51                           0.109
                                6 4.51×10⁻¹² 1.92×10⁻¹³ 4.09 8.30×10⁻¹² 9.02×10⁻¹² 0.08                             -
                                7 1.92×10⁻¹¹ 3.28×10⁻¹² 4.30 1.72×10⁻¹⁰ 1.58×10⁻¹⁰ -0.08                            -
                                8 1.27×10⁻¹¹ 1.42×10⁻¹³ 4.96 1.37×10⁻¹¹ 5.04×10⁻¹¹ 1.30                           0.056
                                9 8.83×10⁻¹² 0.034
                                                                                                         Total    >0.45

              TABLE IV. Corresponding absolute uncertainties on the values in Table III. All fluxes are in units of ergs cm−2 s−1 .
                Ap F88 (× 10−12 ) F5007 (× 10−14 ) A5007 F5007,d (× 10−12 ) F5007,exp (× 10−11 )          τint       Md (M )
                    +       -       +       -      +     -    +         -         +           -         +      -      +     -
                1 7.1      6.0    0.20    0.40    0.31 0.21 0.99      1.23      1.97       1.74       0.51 0.49 0.021 0.020
                3 2.6      3.0    0.80    1.20    0.00 0.51 4.60      1.86      1.02       1.14       0.62 0.54 0.025 0.022
                4 2.4      2.1    0.90    1.40    0.03 0.34 2.72      1.01      4.37       3.93       0.59 0.42 0.024 0.017
                5 1.9      1.2    1.02    1.27    0.19 0.07 0.88      1.16      2.91       2.52       0.47 0.44 0.019 0.018
                6 0.70     1.2    0.70    0.80    0.00 0.04 0.95      1.14      0.40       0.41       0.46 0.47 0.017 0.017
                7 1.6      2.3     15      15     0.00 0.02 19.1      23.7       6.1        5.5       0.40 0.38 0.017 0.017
                8 1.40 1.94        2.5     1.9    0.05 0.10 2.07      2.41      2.13       2.10       0.45 0.45 0.024 0.025
                9 1.6      1.2     1.1    0.80    0.07 0.00 1.93      2.37      1.42       1.30       0.43 0.41 0.016 0.015
                                                                                                            Total 0.056 0.052
9
TABLE V. Columns from left to right are: ISO-LWS aperture number; the observed [O I] 63 µm flux, F63 ; the observed [O I] 6300 Å flux,
F6300 , from the same area; A6300 the estimated ISM extinction at 6300 Åin magnitudes; the ISM-dereddened 6300 Å flux, F6300,d ; the expected
optical [O I] 6300 Å flux, F6300,exp , in each aperture for no internal dust extinction; the internal optical depth τint and dust mass, Md , implied
by the difference between the predicted and ISM-dereddened [O I] 6300 Å fluxes for cylinders projected through each ISO-LWS aperture. All
fluxes are in units of ergs cm−2 s−1 .
Ap F63 F6300 A6300 F6300,d F6300,exp τint Md (M )
2 2.98×10⁻¹¹ 1.20×10⁻¹² 3.31 2.53×10⁻¹¹ - - -
1 6.35×10⁻¹² 2.63×10⁻¹⁴ 3.72 8.09×10⁻¹³ 5.40×10⁻¹² 1.90 0.31
3 1.17×10⁻¹¹ 6.61×10⁻¹⁴ 3.91 2.42×10⁻¹² 9.95×10⁻¹² 1.41 0.23
5 1.24×10⁻¹² 8.85×10⁻¹⁴ 2.67 1.04×10⁻¹² 1.05×10⁻¹² 0.01 -
6 4.52×10⁻¹² 1.13×10⁻¹³ 3.23 2.21×10⁻¹² 3.84×10⁻¹² 0.55 0.09
7 8.58×10⁻¹² 1.21×10⁻¹³ 3.31 2.55×10⁻¹² 7.29×10⁻¹² 1.05 0.17
Total 0.80
TABLE VI. Corresponding absolute uncertainties on the values in Table V. All fluxes are in units of ergs cm−2 s−1 .
Ap F63 (×10−12 ) F6300 (×10−14 ) A6300 F6300,d (×10−13 ) F6300,exp (×10−12 ) τint Md (M )
+ - + - + - + - + - + - + -
2 1.6 2.2 5.0 7.7 0.19 0.02 27.8 51.1 4.86 6.70 0.22 0.33 - -
1 0.64 0.41 0.74 0.70 0.07 0.18 2.44 1.91 1.09 1.41 0.36 0.35 0.059 0.057
3 0.80 0.90 1.1 1.1 0.02 0.00 4.20 4.20 1.94 2.63 0.26 0.32 0.042 0.051
5 0.40 0.40 0.60 0.55 0.0 0.06 1.35 1.21 0.16 0.24 0.20 0.26 0.033 0.042
6 0.70 0.60 0.80 0.70 0.02 0.01 2.70 2.60 7.40 9.97 0.23 0.28 0.037 0.046
7 0.43 0.38 1.2 1.5 0.01 0.07 3.50 4.02 1.39 1.89 0.24 0.30 0.038 0.049
Total 0.09 0.10
flux ratio is insensitive to electron density but is sensitive to ternal dust optical depths in Cas A, deduced above for each
the electron temperature. For aperture 2, where all the pro- aperture and listed in the penultimate columns of Tables I, III
jected interstellar dust column is expected to be in front of the and V, are given by
remnant, the value of 0.85 for the ratio of the ISM-dereddened
6300 Å flux to the observed 63 µm flux (Table V) implies Te τλ = κλ × ρ × l (1)
= 4800 K, significantly lower than the 7900-8100 K values de-
where κλ is the dust opacity per unit mass at the wavelength
rived from the [O III] optical to infrared line flux ratios. This
observed, ρ is the dust mass density and l is the path length
discrepancy is probably because the ionized regions responsi-
projected through Cas A by each aperture. If A is the area
ble for the 6300 Å emission are not entirely responsible for the
projected onto Cas A by each aperture and V = A × l is the
63 µm flux, some of which may arise from cooler neutral re-
volume projected through Cas A by each aperture then we
gions within the remnant that do not excite [O I] 6300 Å emis-
have
sion significantly. We have adopted the LWS aperture 2 6300
Å/63 µm flux ratio of 0.85 in order to predict the unreddened (τλ /κλ ) × A = ρ ×V = Md (2)
6300 Å fluxes for the remaining LWS apertures. However,
this is equivalent to assuming that all LWS apertures sample where Md is the mass of dust in the volume projected through
the same internal ionized to neutral gas fractions, and that the Cas A by each aperture. For consistency, the results in Tables
diffuse interstellar [O I] contribution does not vary from its I, III and V use the same grain composition adopted by Bevan
offset aperture 4 level. The dust internal optical depths derived et al. [2017]: 50 per cent silicate and 50 per cent carbon grains
in Table V from the [O I] lines must therefore be considered with a grain size of 0.05 µm. However, in line with the work
more uncertain than those derived in Tables I and III from the of Arendt et al. [2014], who found that silicates of a structure
[O III] lines. Table VI lists the statistical uncertainties on the Mgx SiOx+2 best fitted the 21 µm feature of the Spitzer SED,
measured and derived quantities in Table V. we use Mg2 SiO4 optical constants instead of the astronom-
ical silicate constants used by Bevan et al. [2017], although
doing so only changes the derived dust mass by 1.4 per cent,
for the same 50:50 grain mixture as above. The effect on the
C. The dust masses in the ISO-LWS and Herschel PACS-IFU derived dust mass of adopting different grain compositions is
projected apertures discussed further in Section 4.4 below.
As discussed above, we consider the internal dust mass es-
We will assume a simple case where no light has been scat- timates derived from the [O III] line comparisons to be more
tered into the beams by internal dust, in which case the in- reliable than those based on the [O I] line fluxes, so we will10
FIG. 9. (A) (left): Cas A internal dust masses deduced from a comparison of [O III] infrared and optical line fluxes falling within ISO-LWS
apertures, labelled for each aperture with the dust mass, in solar masses, listed in Table I. They are overplotted on the resolved internal dust
mass map of Cas A from Figure F3 of DL2017. (B) (right): Internal dust masses deduced from a comparison of [O III] infrared and optical
line fluxes falling within PACS-IFU apertures, labelled for each aperture with the dust mass, in solar masses, listed in Table III. “COE” is an
abbreviation for “Centre Of Expansion”.
consider only our results from the former. The ratio of the and IR line flux measurements were estimated from repeated
total area subtended on Cas A by the eight 47×47-arcsec2 measurements of the line fluxes above different choices for
PACS IFU aperture positions to that subtended by the six 84- the background continuum levels. These measurement uncer-
arscec diameter circular LWS apertures is 0.53, while a value tainties were combined with the flux calibration uncertainties
of >0.45 is obtained for the ratio our PACS-IFU summed of 10 per cent for the ISO-LWS spectra and 13 per cent for the
dust mass of >0.45 M to our LWS summed dust mass of PACS-IFU spectra.
0.99 M . To estimate uncertainties associated with the foreground
The spatial distribution of internal dust from both the ISO- extinction measurements (listed in entries 6, 4 and 4 of Tables
LWS and PACS apertures can be seen in Figure 9, overplotted II, IV and VI, respectively), we calculated from the DL2017
on Figure F3 of DL2017, which shows the spatially resolved interstellar extinction map AV limits for the LWS and PACS
dust masses derived from the far-infrared and submillimetre apertures that corresponded to aperture radii that were 0.9 and
Herschel images of the cold dust emission from the remnant. 1.1 times their actual sizes. The uncertainties on the ISM-
Our dust distribution closely follows the distribution found by dereddened optical line fluxes, F5007,d and F6300,d , were then
DL2017: the largest internal dust columns are found towards obtained by combining the flux measurement uncertainties
the centre and southeast of Cas A. The LWS apertures did not with the uncertainties associated with the foreground interstel-
cover all of Cas A but in the dust mass map of De Looze et al. lar extinction estimates.
[2017] 73 percent of the total dust mass was encompassed by The uncertainties on F5007,exp for the different ISO-LWS aper-
the six LWS apertures. tures are listed in Table II and are a combination of the F52
For comparison with our LWS summed dust mass of flux measurement uncertainties and the uncertainties associ-
0.99 M , De Looze et al. [2017] derived a total mass of ated with the adopted dust-free F5007 /F52 ratio, derived in turn
0.5±0.1 M for a 50:50 mixture of silicate and amorphous from the uncertainties on ne in each aperture and the uncer-
carbon dust grains within Cas A while, from an analysis of tainty on the temperature of 7900 K calculated for LWS aper-
the red-blue emission line asymmetries in the integrated opti- ture 2. The F5007,exp uncertainties listed in Table IV for the
cal spectrum of Cas A, Bevan et al. [2017] derived a total dust PACS apertures are a combination of the uncertainty on the
mass of ∼1.1 M using the same 50:50 silicate:carbon dust dust-free F5007 /F52 ratio derived for the ISO-LWS aperture 2,
mixture as adopted here. the F88 flux measurement uncertainty for the PACS aperture,
and the uncertainty associated with the F52 /F88 ratio measured
for the matching LWS aperture. In Table VI, for the ISO-LWS
IV. DUST MASS SOURCES OF UNCERTAINTY apertures, the listed uncertainty for each F6300,exp value is a
combination of the uncertainties associated with F6300,d and
A. Measurement uncertainties F63 for LWS aperture 2, and the F63 measurement uncertainty
for the given aperture.
The uncertainties on Fλ ,exp and Fλ ,d enter weakly into the
Tables II, IV and VI list the statistical uncertainties on the error budgets for the derived internal optical depths, which
measured and derived quantities for the individual LWS and depend only logarithmically on line flux ratios. The scaling
PACS apertures. The uncertainties associated with the optical11
FIG. 10. Dust masses within Cas A based on the flux ratios of [O III] optical to infrared lines emitted within projected ISO-LWS (left) and
Herschel-PACS (right) apertures, as a function of position along the G2019 reddening versus distance curves for their lines of sight to Cas A.
The numbering of the curves refers to the numbering of the LWS and PACS-IFU apertures shown in Figures 2 and 3. The black vertical line
represents the distance of 3.33 kpc for Cas A as found by Alarie et al. [2014], and the black dashed lines indicate the stated uncertainty on
their result of ±0.10 kpc.
FIG. 11. Dust masses within Cas A obtained by summing the masses contained within all projected ISO-LWS apertures (orange line) or
Herschel-PACS apertures (blue line), as a function of position along the G2019 reddening versus distance curves for the lines of sight to
Cas A. The black vertical line represents the distance of 3.33 kpc for Cas A as found by Alarie et al. [2014], and the black dashed lines indicate
the stated uncertainty on their result of ±0.1 kpc.
factor from a measured far-IR line flux to a predicted optical B. Uncertainties associated with the location of the interstellar
line flux depends exponentially on the adopted gas tempera- dust
ture but the logarithmic dependence of the dust internal depths
on flux ratios means that the derived dust optical depths effec-
tively have only a linear dependence on the adopted gas tem- The source of uncertainty that we will discuss here is that
perature. These weak dependencies may help explain why the associated with the correction of the optical line fluxes for
LWS [O I]-based dust mass estimate of 0.80 M (Table V) is foreground interstellar extinction. The factors by which the
relatively close to the LWS [O III]-based dust mass estimate of optical line fluxes have been corrected are large, ranging from
0.99 M (Table I) despite the [O I] IR flux measurements and 25 to 200 depending on position (see column 6 of Table I and
optical flux predictions being affected by greater uncertainties column 4 of Table III), although this is then moderated by the
than those for the [O III] lines, as discussed in Section 3.2. logarithmic factor determining the internal optical depth es-
timate. For the above ISM extinction corrections, we have
made use of the DL2017 ISM dust maps, based on their Her-
schel mapping of the far-IR emission by ISM dust in the vicin-
ity of Cas A. An alternative to their use that we discussed is to
use the ISM extinction vs. distance curves available from the12
TABLE VII. Dust absorption optical depths, τabs , and total (absorption+scattering) dust optical depths, τtot , calculated for a projection of
an ISO-LWS aperture through the centre of the Bevan et al. [2017] best-fitting spherically symmetric model for Cas A, compared with the
effective optical depth, τe f f , deduced from the ratio of the output dust-affected to the input dust-free [O III] λ λ 4959, 5007 Å fluxes.
Clumped? Dust mass (M ) % silicate τabs τtot τe f f τe f f /τtot
yes 1.1 50 0.38 0.46 0.49 1.06
no 1.1 50 0.37 0.46 0.51 1.11
no 5.5 50 1.88 2.31 2.04 0.88
yes 5.5 50 1.86 2.28 1.44 0.63
no 1.1 75 0.18 0.23 0.24 1.03
yes 1.1 75 0.17 0.22 0.20 0.92
no 5.5 75 0.87 1.14 1.17 1.02
yes 5.5 75 0.86 1.12 0.89 0.80
mapping of G2019, see Figs. 6 and 7. ues from the DL2017 interstellar extinction map to correct the
Although the distance to Cas A is well established, the optical fluxes for interstellar extinction. For the above reasons
steepest parts of the G2019 extinction vs. distance curves in we consider our DL2017-based dust masses (Section 3.3) to
Fig 7 lie close to the position of Cas A, so possible uncer- be more reliable.
tainties in the exact range of distances over which the steep We assumed earlier that a fraction f = 0.5 of the DL2017
extinction rise take place can potentially have a significant ef- interstellar extinction lies in front of the remnant for all of the
fect on the adopted interstellar extinction corrections. To show projected LWS aperture areas apart from LWS-02, for which
the effect of shifting the extinction curves in Fig. 7 relative to we adopted f = 1.0. For the five other LWS apertures, their
the position of Cas A, we illustrate in Fig. 10 how the dust derived enclosed total dust mass Md is found to vary with the
masses derived in each LWS and PACS-IFU aperture vary as value adopted for f according to Md = (3.11 - 4.25 f ) M ,
the G2019 extinction curves are shifted by ±0.3 kpc around yielding Md = 0.99 M for f = 0.5 and with Md falling to
the Alarie et al. [2014] distance to Cas A of 3.33±0.10 kpc. zero when f reaches 0.73.
We matched the G2019 extinction curve in the pink voxel in
Figure 6 with ISO LWS aperture 2 and PACS aperture 7, the
green voxel to ISO LWS aperture 1 and 7 and PACS apertures C. Uncertainties associated with the dust screening
1,8 and 9, the yellow voxel to ISO aperture 5 and 6, and PACS assumption
apertures 4,5 and 6. The extinction in ISO LWS aperture 3
was an average of the extinction in the green and yellow vox-
Another source of uncertainty is that we have effectively
els.
assumed a foreground screen model for the dust, rather than
The total dust mass variation with adopted distance of the dust being mixed with the emitting gas, and light scat-
Cas A is seen in Figure 11. tered back into the line of sight by dust has been neglected.
Comparison of the DL2017-based total dust masses in Ta- Natta and Panagia [1984] have treated the case of multiple
bles I and III with the G2019-based total dust masses at dust clumps, each with an optical depth τcl , immersed in an
3.33 kpc shown in Figure 11 shows the latter to be larger emitting gas and find that for individual clump optical depths
by factors of 1.5-2.0, which can be attributed to the gener- < 1 then effective dust optical depths should be close to the
ally lower ISM dust extinction corrections to the optical line actual optical depths. The apparent overall optical depths at
fluxes yielded by the G2019 distance-extinction curves. 5007 Å measured for our LWS and PACS-IFU apertures range
Figure 7 shows that for three of the four G2019 Cas A sight- between 0.6 and 2.8 and individual dust clumps are expected
lines the extinction starts to plateau at about 3 kpc, with the to have low optical depths - if one adopts a clump radius of
fourth plateauing just before 4 kpc. The interstellar extinc- 1016 cm [Fesen et al. 2011] and a clump gas density of 100
tion in the G2019 map is deduced from stellar reddenings but, oxygen atoms cm−3 [Kirchschlager et al. 2019], together with
as discussed in Section 3.1, as the extinction increases with a gas-to-dust mass ratio of 5-10 [Priestley et al. 2019] along
distance there comes a point beyond which there can be an in- with a grain mass density of 3.2 g cm−3 and the grain radius
adequate number of detectable stars from which accurate dis- of 0.05 µm from Bevan et al. [2017] used here, then one finds
tances and extinctions can be inferred, so that higher column an optical depth from the centre to the surface of a clump of
densities of interstellar dust cannot be probed by the G2019 0.125 - 0.25.
extinction curves. The G2019 extinction vs. distance curves We have tested these expectations by running a number of
are therefore likely to be plateauing at too low a distance due DAMOCLES gas plus dust Monte Carlo radiative transfer mod-
to their inability to probe higher dust extinctions. As well els for Cas A, with parameters as described by Bevan et al.
as having much higher angular resolution, the DL2017 inter- [2017]. The [O III] emission models had an outer remnant
stellar dust map, inferred from the optically thin far-infrared radius Rout of 5.2×1018 cm and an outer expansion velocity
emission by the dust, can probe higher dust column densities. of 5000 km s−1 , together with ratios of inner to outer radius
This explains why the deduced dust masses in the ISO-LWS and inner to outer velocity of 0.5. The dust and gas were
and PACS apertures are lower when using the higher AV val- mixed together and had r−2 density distributions between the13
FIG. 12. a) The dust masses within the numbered ISO-LWS apertures as a function of grain radius for a 50:50 Mg2 SiO4 :Amorphous Carbon
mix. b) Dust masses as a function of grain radius for a 75:25 Mg2 SiO4 :Amorphous Carbon mix. The black dashed line corresponds to the
maximum dust mass within Cas A allowed by the nucleosynthetic yields of Woosley and Heger [2007].
inner and outer radii. Models were run with smooth density tion of amorphous carbon to the silicate dust component im-
distributions or clumped density distributions and with dust proved their fits to the overall IR SED of Cas A. We calculated
masses of either 1.1 or 5.5 M . For clumped models, a clump the dust masses in the ISO LWS apertures using Mg2 SiO4 ,
volume filling factor of f = 0.1 was used with clumps of ra- Mg0.7 SiO2.7 , Mg2.4 SiO4.4 and MgSiO3 as the silicate dust
dius Rclump = Rout /25. Column 5 of Table VII lists each species, for silicate:amorphous carbon ratios of 0.5:0.5 and
model’s total (absorption+scattering) optical depth, τtot along 0.75:0.25, with a range of grain radii from 0.05–1.0 µm.
a column projected through the centre of the remnant (corre- We used the silicate species optical constants of Jäger et al.
sponding to LWS aperture 1). Column 6 then lists τe f f , ob- [2003], and the BE amorphous carbon optical constants of
tained via the ratio of the [O III] 4959,5007 Å dust-free in- Zubko et al. [1996].
put line flux to the dust-affected output line flux. Column 7 Although different silicate species can have widely differ-
lists the ratio of τe f f /τtot . For the four clumped dust models ent opacities at infrared wavelengths, there is much less vari-
τe f f /τtot = 0.85 ± 0.16 while for the four models with smooth ation at visible wavelengths. We found that the choice of
distributions of dust and gas we obtain τe f f /τtot = 1.01 ± 0.08. silicate dust species did not greatly affect the derived dust
We have therefore made no corrections to the effective dust masses. For the above silicate:carbon ratios, then for a given
optical depths that have been derived in Tables I, III and V. grain size the total derived dust mass in Cas A varied by less
than 15 per cent between different Mgx SiOx+2 species, with a
mean difference of 4 per cent. The maximum difference be-
D. Constraining the dust parameters tween the dust masses derived using different silicate species
was 60 per cent, that between Mg2 SiO4 and MgSiO3 when
using a grain radius of 0.3 µm. For silicate:carbon ratios of
Cassiopeia A has been extensively studied at mid-IR wave- 0.5:0.5 and 0.75:0.25, the mean dust mass difference, over all
lengths with Spitzer, which has enabled the silicate dust grain radii from 0.05 to 1.0 µm, was 17 per cent. For a fixed
species in Cas A to be well constrained [Arendt et al. 2014, grain radius of 0.05 µm and a silicate:carbon ratio of 0.5:0.5,
Ennis et al. 2006, Rho et al. 2008]. We have determined as per the results in Tables I, III and V, we found that the to-
the dust mass in the ISO-LWS apertures for a range of grain tal silicate+carbon dust masses varied by < 1 per cent when
radii, silicate to amorphous carbon ratios and silicate dust using the range of silicate species discussed above. As we do
species, in order to try to constrain the dust parameters in not consider these differences to be significant, for simplicity
Cas A. Arendt et al. [2014] found that Mgx SiOx+2 silicates we show in Figure 12 only the dust masses that result from
provided the best fit to the 21 µm feature in the Spitzer adopting Mg2 SiO4 as the silicate dust species.
SED. Rho et al. [2008] and Douvion et al. [2001] modelled Figure 12 illustrates how the total silicate+carbon dust mass
the Spitzer spectra and ISO-SWS spectra respectively with varies as the adopted grain radius is varied, for (a) a 50:50 ra-
MgSiO3 as the predominent silicate composition. Arendt tio and (b) a 75:25 ratio of silicate to amorphous carbon. The
et al. [2014] and Rho et al. [2008] also found that the addi-You can also read