Thorium-230 normalized particle flux and sediment focusing in the Panama Basin region during the last 30,000 years
←
→
Page content transcription
If your browser does not render page correctly, please read the page content below
PALEOCEANOGRAPHY, VOL. 22, PA2213, doi:10.1029/2006PA001357, 2007
  Click
  Here
    for
 Full
Article

Thorium-230 normalized particle flux and sediment focusing
in the Panama Basin region during the last 30,000 years
S. S. Kienast,1 M. Kienast,1 A. C. Mix,2 S. E. Calvert,3 and R. François3
Received 9 August 2006; revised 27 November 2006; accepted 5 December 2006; published 16 May 2007.

[1] Application of the 230Th normalization method to estimate sediment burial fluxes in six cores from the
eastern equatorial Pacific (EEP) reveals that bulk sediment and organic carbon fluxes display a coherent regional
pattern during the Holocene that is consistent with modern oceanographic conditions, in contrast with estimates
of bulk mass accumulation rates (MARs) derived from core chronologies. Two nearby sites (less than 10 km
apart), which have different MARs, show nearly identical 230Th-normalized bulk fluxes. Focusing factors
derived from the 230Th data at the foot of the Carnegie Ridge in the Panama Basin are >2 in the Holocene,
implying that lateral sediment addition is significant in this part of the basin. New geochemical data and existing
literature provide evidence for a hydrothermal source of sediment in the southern part of the Panama Basin and
for downslope transport from the top of the Carnegie Ridge. The compilation of core records suggests that
sediment focusing is spatially and temporally variable in the EEP. During oxygen isotope stage 2 (OIS 2, from
13–27 ka BP), focusing appears even higher compared to the Holocene at most sites, similar to earlier findings
in the eastern and central equatorial Pacific. The magnitude of the glacial increase in focusing factors, however,
is strongly dependent on the accuracy of age models. We offer two possible explanations for the increase in
glacial focusing compared to the Holocene. The first one is that the apparent increase in lateral sediment
redistribution is partly or even largely an artifact of insufficient age control in the EEP, while the second
explanation, which assumes that the observed increase is real, involves enhanced deep sea tidal current flow
during periods of low sea level stand.
Citation: Kienast, S. S., M. Kienast, A. C. Mix, S. E. Calvert, and R. François (2007), Thorium-230 normalized particle flux
and sediment focusing in the Panama Basin region during the last 30,000 years, Paleoceanography, 22, PA2213,
doi:10.1029/2006PA001357.

1. Introduction                                                        ulate biogenic material changed little or even decreased
                                                                       during the LGM [Marcantonio et al., 1996, 2001; Paytan et
  [2] Upwelling of subsurface waters in the eastern equa-
                                                                       al., 1996; Higgins et al., 1999, 2002; Loubere et al., 2004;
torial Pacific (EEP) results in elevated levels of primary
                                                                       Kienast et al., 2006; Bradtmiller et al., 2006]. A similar
production and particle export. Despite intensive research
                                                                       discrepancy exists between different reconstructions of past
over the last several decades to reconstruct past variations in        aeolian dust fluxes to the central equatorial Pacific. While
productivity and particle flux from surface waters to the              calculations based on linear sedimentation rates yield no
seafloor, the interpretation of the sedimentary record in the          consistent relationship between dust fluxes and glacial-
EEP remains highly controversial (see Loubere [1999] and               interglacial stages [Murray et al., 1995], recent 230Th-
Paytan et al. [2004] for recent reviews). Linear sedimenta-            normalized data suggest that dust fluxes were systematically
tion rates calculated from core chronology often indicate              higher during cold periods [Anderson et al., 2006].
higher mass accumulation of sedimentary material during                  [3] Studies using constant flux tracers invoke lateral
the Last Glacial Maximum (LGM), which has been taken to                redistribution of sediment on the seafloor to explain changes
imply higher vertical fluxes of biogenic sediment and higher           in sediment mass accumulation rates. Redistribution of
productivity during this time interval [e.g., Sarnthein and            recently deposited material (i.e., syndepositional redistribu-
Winn, 1988; Paytan et al., 1996; Lyle et al., 2002]. In                tion) from zones of sediment winnowing to zones to
contrast, ‘‘constant flux’’ tracers such as 230Th and extra-           sediment focusing can significantly affect accumulation
terrestrial 3He indicate that the vertical rain rates of partic-       rates without impairing the stratigraphy or chronology of
                                                                       the sedimentary sequence and can thus be easily overlooked
                                                                       [François et al., 2004]. This process now appears much
   1
     Department of Oceanography, Dalhousie University, Halifax, Nova   more common in the ocean than previously thought [e.g.,
Scotia, Canada.                                                        Mollenhauer et al., 2003, 2005; François et al., 2004, and
   2
     College of Oceanic and Atmospheric Sciences, Oregon State
University, Corvallis, USA.                                            references therein; Mitchell and Lyle, 2005; Kienast et al.,
   3
     Department of Earth and Ocean Sciences, University of British     2005], and failing to take it into account could obviously
Columbia, Vancouver, Canada.                                           lead to significant errors if mass accumulation rates are used
                                                                       to evaluate past changes in the vertical rain rate of particles
Copyright 2007 by the American Geophysical Union.                      from overlying surface waters.
0883-8305/07/2006PA001357$12.00

                                                                PA2213                                                        1 of 19
PA2213 KIENAST ET AL.: PARTICLE FLUX IN THE PANAMA BASIN PA2213
100 N
CocosR.
TR163-19 P7
. / -,
Y69-71
ME-2
Galapagos I-;
Spreading C.
TR16
.ME-27
Carnegie. R.
10°S
900 W
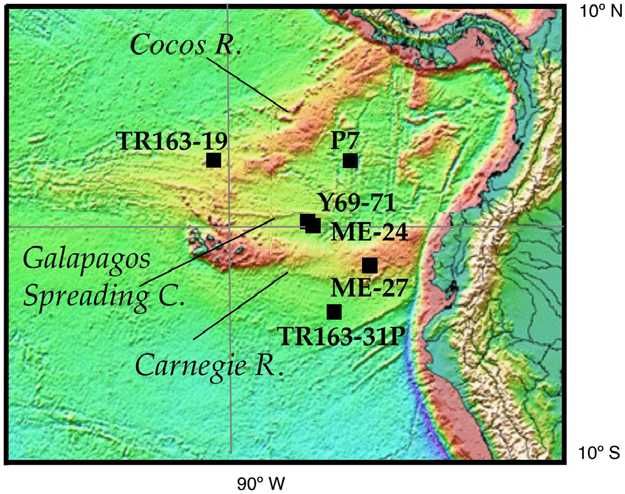
Figure 1. Core sites used in this study. Bathymetry from Smith and Sandwell [1997], (http://
topex.ucsd.edu/marine_topo/mar_topo.html).
[4] Normalization to the activity of the radioisotope 230Th identical 230Th-normalized bulk fluxes, and (3) the differ-
has been proposed as a means to more accurately determine ence in focusing factors derived from 230Th accumulation
the vertical particle flux originating from surface waters rates at these two sites is consistent with the difference in
[Bacon, 1984]. This approach relies on the assumption that sediment accumulation rates estimated from seismic data
the flux of 230Th to the seafloor approximates its rate of [Lyle et al., 2005]. During the last glacial period (oxygen
production by radioactive decay of 234U. Since it was first isotope stage 2, or OIS 2 from 13– 27 ka BP), sediment
proposed, 230Th normalization is increasingly being used redistribution appears to have been more intense, and we
and its underlying assumptions are being tested and refined submit two possible explanations for this observation.
(see François et al. [2004], Henderson and Anderson
[2003], and François et al. [2007], for recent reviews).
Model simulations [e.g., Henderson et al., 1999; Marchal et 2. Core Sites and Oceanographic Setting
al., 2000] and sediment trap observations [e.g., Yu et al., [6] Cores ME0005-24JC and Y69-71 were recovered
2001, Scholten et al., 2005] confirm that the flux of within 10 km of each other from an area of abyssal hills
scavenged 230Th to the seafloor is within 30% of its rate just to the north of the Carnegie Ridge (Figure 1 and
of production over most areas of the ocean. Laboratory Table 1). ME0005-24JC is located 200 m deeper than core
experiments reveal that while 230Th has different affinities Y69-71 in an abyssal valley [Mix et al., 2003], whereas
for different particle types (clay, biogenic opal, manganese Y69-71 was recovered midslope on an adjacent abyssal hill
oxide, and carbonate), all particle types strongly scavenge to the north, farther away from the Carnegie Ridge [see Lyle
230
Th [Geibert and Usbeck, 2004]. et al., 2005, Figure 1]. Core ME0005-24JC served as a site
[5] Using seismic data, Lyle et al. [2005] have recently survey core for ODP Site 1240, which was subsequently
questioned the validity of the interpretation of 230Th- drilled at this location. Core P7 was raised several hundred
normalized fluxes in the EEP, arguing that 230Th normali- kilometers to the northeast from an area of relatively low
zation grossly overestimates sediment redistribution. Here,
we present new 230Th and compositional data from 4 cores
from the Panama Basin region (Figure 1 and Table 1). We
also revisit sites Y69-71 [Loubere et al., 2004; Lyle et al., Table 1. Cores Used in This Study
2005] and P7 [Pedersen et al., 1988; Yang et al., 1995] from
Core ID Water Depth, m Longitude Latitude
the Panama Basin. Our results further validate the 230Th
normalization method by showing that (1) 230Th-normalized ME0005-24JC 2941 86°27.7880W 0°01.3020N
Y69-71P 2740 86°290W 0°060N
fluxes of bulk sediment and organic carbon during the P7 3085 83°59.180W 2°36.260N
Holocene are regionally consistent with present-day sea ME0005-27JC 2203 82°47.200W 1°51.2010S
surface conditions in the EEP, (2) two nearby sites with TR163-31P 3209 83.95 °W 3.60 °S
different sediment mass accumulation rates produce nearly TR163-19P 2348 90°57.10W 2°15.50N
2 of 19PA2213 KIENAST ET AL.: PARTICLE FLUX IN THE PANAMA BASIN PA2213
relief. Core ME0005-27JC was raised on the southern flank [10] Biogenic opal (Siopal) of core ME0005-24JC was
of the Carnegie Ridge at 2203 m water depth (wd), from a determined at UBC by extraction of silica from 20 mg
bench that gently slopes to the south, approximately 20 km subsamples by a 2M Na2CO3 solution at 85°C for 5 hours.
south of the main scarp of the Carnegie Ridge. ODP Site Dissolved silica concentrations in the extract were deter-
1238 was subsequently drilled at this location. Further to the mined by molybdenum blue spectrophotometry [Mortlock
south, core TR163-31P was recovered from 3209 m wd. and Froelich, 1989]. Precision was ±4.3% (1s). Biogenic
Finally, core TR163-19P was raised from 2348 m wd on the opal of core Y69-71 is taken from Lyle et al. [2002] and was
outer flank of the Cocos Ridge, which forms the western obtained by determining Na2CO3-soluble Si by atomic
boundary of the Panama Basin. absorption spectrophotometry [Lyle et al., 2002, 1988].
[7] The surface waters in the Panama Basin region are [11] Total Iron, Al, Mg, Si, and Mn contents of core
influenced by wind-driven upwelling of water from the ME0005-24JC were determined by ICP-OES analysis of
equatorial undercurrent (EUC). Off Peru, nutrient-rich water subsamples fused in LiBO2 and redissolved in dilute HNO3.
originating from the deeper parts of EUC stimulates inten- Accuracy was controlled by analyzing a wide range of
sive production in the equatorial cold tongue as it recircu- international rock standards, and precisions were better than
lates into the south equatorial current [Toggweiler et al., ±2%. Nonbiogenic Si in this core was derived by subtract-
1991; Toggweiler and Carson, 1995; Dugdale et al., 2002]. ing opaline Si (determined by alkaline extraction) from total
Core sites TR163-31P and ME0005-27JC are affected most Si (determined by ICP-OES).
by these highly productive waters. Further northwest, cores [12] Radiocarbon dates are based on accelerator mass
ME0005-24JC and Y69-71 are situated within the equato- spectrometry (AMS) of hand-picked N. dutertrei specimens
rial divergence zone, whereas cores P7 and TR163-19P are and bulk carbonate samples and were carried out at the
located at the northern boundary of the equatorial upwelling National Ocean Science Accelerator Mass Spectrometry
zone. The cores span a gradient in biological productivity Facility (NOSAMS) using standard procedures.
with higher values (200 gC/m2/year) observed at sites
TR163-31P and ME0005-27JC close to the Peru upwelling 3.2. Core Chronologies
and lower values (140 gC/m2/yr) at sites P7 and TR163-19P [13] The accuracy of both mass accumulation rates
at the northern limit of the shallow equatorial upwelling (MARs) and focusing factors is strongly dependent on the
zone [Antoine et al., 1996]. availability of reliable core chronologies. A significant part
of this work is thus dedicated to the presentation and
discussion of age models and their effect on focusing factors
3. Experimental Section and MARs.
3.1. Analytical Methods 3.2.1. Y69-71
[8] Total 230Th, 232Th and 238U activities were determined [14] A new chronology for this core is presented here
at the Woods Hole Oceanographic Institution (WHOI) which is based on correlating the new high-resolution
and the University of British Columbia (UBC) by benthic d 18O record (not shown) to core MD95-2042 off
isotope dilution on an inductively coupled plasma mass Portugal, which has been matched to the GRIP ice core
spectrometer (ICP-MS) following total acid digestion of record [Shackleton et al., 2000]. This tuning is confirmed by
sediment samples equilibrated with 229Th and 236U spikes. 8 14C dates obtained on N. dutertrei and bulk carbonate
Details and principles of the procedure can be found in the (Table 2 and Figure 2). Radiocarbon ages were calibrated to
work of Choi et al. [2001] and François et al. [2004]. Total calendar years using the software CALIB 5.0.2 (Stuiver and
230
Th data for core Y69-71 are from Loubere et al. [2004] Reimer [1993]; deltaR = 167 ± 106 years), except for the
and P. Loubere (personal communication, 2005) but multi- oldest 14C date, which was calibrated using the radiocarbon
plied by 0.85 to correct for a standardization error at the calibration of Fairbanks et al. [2005]. The new age model
time of measurement. For core P7, excess and decay results in age assignments which are up to 2000 years
corrected 230Th data were taken directly from Yang et al. older before 22 ka BP compared to the age model used in
[1995]. Loubere et al. [2004], which was based on the previous
[9] Organic carbon (Corg) contents of cores ME0005-24JC, low-resolution d 18O record and its correlation to SPECMAP
ME0005-27JC, TR163-19P and TR163-31P were obtained (Figure 2). The differences in age models and their effects
at UBC by determining total C by combustion gas chroma- on focusing factors and MARs are discussed in section 4.3.
tography and subtracting carbonate carbon values deter- 3.2.2. ME0005-24JC
mined by coulometry [Calvert et al., 1993]. Carbonate [15] The age model for core ME0005-24JC is based on
(CaCO3) values were obtained from the coulometric CO2 correlating its carbonate record to that of core Y69-71 [see
determinations assuming no other carbonate-bearing phase Lyle et al. 2005, Figure 2]. The resulting age model agrees
was present. Precisions were ±3% of the reported values. well with 3 reservoir corrected (deltaR = 167 ± 106 years)
For core Y69-71, Corg and CaCO3 values are taken from and calibrated 14C dates on N. dutertrei during the degla-
Lyle et al. [2002]; they were determined at Oregon State ciation, but gives a significantly older age assignment than a
University (OSU) by the acidification/wet oxidation tech- radiocarbon-based age point during the glacial period
nique described by Weliky et al. [1983] with modifications (Figure 2 and Table 2). Whereas we use the carbonate based
described by Lyle et al. [2002]. Organic carbon values of stratigraphy for the main part of this contribution, we also
core P7 are taken from Pedersen et al. [1988]. discuss MARs and focusing factors that result from a
radiocarbon based age model (section 4.3). Note that the
3 of 19PA2213 KIENAST ET AL.: PARTICLE FLUX IN THE PANAMA BASIN PA2213
Table 2. Radiocarbon Data of Cores ME0005-24JC, -27JC and Y69-71P
14
Core Depth, cm C Age, years Calendar Age,a years Laboratory Number Reference
ME0005-24JC
N. dutertrei 81 9040 ± 40 9560 ± 130 OS-33897 this study
N. dutertrei 230 13,900 ± 35 15,820 ± 230 OS-33192 this study
N. dutertrei 291 15,700 ± 85 18,440 ± 270 OS-33898 this study
N. dutertrei 351 18,050 ± 65 20,630 ± 190 OS-33899 this study
ME0005-27JC
N. dutertrei 41 7430 ± 40 7730 ± 110 OS-33900 this study
N. dutertrei 91 13,650 ± 65 15,470 ± 220 OS-33193 this study
N. dutertrei 120 17,200 ± 70 19,750 ± 70 OS-33194 this study
N. dutertrei 160 22,200 ± 95 26,180 ± 110b OS-33195 this study
Y69-71P
N. dutertrei 11 – 18 3240 ± 25 2870 ± 120 OS-45680 G. Mollenhauer and T. Eglinton, unpublished data, 2006
N. dutertrei 25 – 30 6110 ± 30 6370 ± 120 OS-45682 G. Mollenhauer and T. Eglinton, unpublished data, 2006
N. dutertrei 50 9760 ± 40 10,210 ± 150 OS-33894 Clark et al. [2004]
Bulk CaCO3 85 12,130 ± 180 13,360 ± 200 (45) Clark et al. [2004]
N. dutertrei 120 14,700 ± 65 16,830 ± 270 OS-33191 Clark et al. [2004]
Bulk CaCO3 165 17,170 ± 350 19,670 ± 510 (45) Clark et al. [2004]
N. dutertrei 180 19,150 ± 70 21,950 ± 370 OS-33895 Clark et al. [2004]
N. dutertrei 260 28,000 ± 190 32,350 ± 170b OS-33896 this study
a
Calibrated to calendar ages with the software CALIB 5.0.2. [Stuiver and Reimer, 1993] using a reservoir correction of deltaR = 167 ± 106 yrs and the
calibration data set of Hughen et al. [2004]. Calendar ages are rounded to the nearest 10 years.
b
Reservoir corrected (467 years) and calibrated to calendar ages using Fairbanks et al. [2005].
radiocarbon age model requires linear extrapolation from focusing factors based on the original stratigraphy [Martin
the oldest 14C age fix point (at 20 ka) to the base of stage 2 et al., 2002] but also investigate the ‘‘Skinner effect’’ by
at 27 ka. For the core top in the radiocarbon model, we subtracting 2 ka from core depths corresponding to the
adopted the age assignment derived from the correlated age benthic d18O rise in TR163-31P.
model.
3.2.3. ME0005-27JC
[16] The age model for core ME0005-27JC is based on
4 radiocarbon dates on N. dutertrei (Table 2), which were
corrected for reservoir effects (deltaR = 167 ± 106 years)
and then calibrated to calendar ages using CALIB 5.0.1,
except for the oldest age, which was calibrated using the
radiocarbon calibration compilation of Fairbanks et al.
[2005]. Preliminary benthic d 18O data (not shown) confirm
this stratigraphy.
3.2.4. P7
[17] The age model of core P7 is taken from Pedersen et
al. [1988] and Yang et al. [1995] and is based on 8 radio-
carbon dates.
3.2.5. TR163-19P
[18] The age model for TR163-19P is based on planktonic
d 18O [Lea et al., 2000] augmented by 2 radiocarbon
measurements from the deglacial section of the core [Spero
and Lea, 2002].
3.2.6. TR163-31P
[19] An age model for core TR163-31P based on a
benthic d 18O record and its correlation to SPECMAP was
presented by Martin et al. [2002]. More recently, however,
Skinner and Shackleton [2005] suggested that the postgla-
cial benthic d18O rise in the EEP lagged the global gla-
cioeustatic d18O component by 2 ka because of local
hydrographic effects in the deep Pacific. Skinner and Figure 2. Depth-age relationships of core Y69-71 based
Shackleton [2005] base their findings on tight radiocarbon on the new stratigraphy used here (thick dashed line) as well
control on Kasten core TR163-31B, the companion core of as the previously used age model (thin dashed line, Loubere
TR163-31P used in this study. We thus present MARs and et al. [2004]) and of core ME0005-24JC (thick solid line).
Open symbols are calibrated 14C dates (Table 2).
4 of 19PA2213 KIENAST ET AL.: PARTICLE FLUX IN THE PANAMA BASIN PA2213
Figure 3. (a) Downcore 230Th-normalized fluxes and (b) mass accumulation rates (MARs) of bulk
sediment over the last 30 ka for all cores used in this study. MARs are averaged over the time intervals
from the core top to 9.5, 9.5– 13.4, 13.4– 21, and 21– 27 ka. Note different Y axes.
3.3. Mass Accumulation Rates by François et al. [2004]; and (2) radioactive decay since
the time of deposition using the chronologies described
[20] Bulk accumulation rates (MARbulk) are derived from
above. Estimates of total vertical flux (prFV – bulk) are
the product of linear sedimentation rates (cm/ka) and dry
derived from prFV – bulk = b z/ex230Th(0), where b is
bulk densities (g/cm3) averaged over chosen core sections
the production of 230Th from 234U decay in the water
(see 3.5). The dry bulk density of cores ME0005-24JC,
column (0.0267 dpm m3 y1) and z is the water depth
-27JC, TR163-19P and 31P was estimated from the
(m). Preserved vertical fluxes of sedimentary constituents
carbonate content using the relationship r = 1/(3.6 –
such as Corg (prFV – Corg), carbonate (prFV –CaCO3), and
0.0279 %CaCO 3 ) published by Snoeckx and Rea
opal (prFV – opal) are derived from prFVi = prFV – bulk i/100,
[1994]. Dry bulk density data for core Y69-71 are taken
where i is weight percent Corg, carbonate, or opal.
from Lyle et al. [2002], and data for core P7 are taken from
[22] In settings were particles settle through the water
Yang et al. [1995]. Mass accumulation rates of Corg and
column and accumulate on the seafloor without lateral
carbonate are derived as MARX = MAR (X)/100, where X
redistribution, the inventory of scavenged 230Th in the
is weight% Corg or CaCO3 averaged over the corresponding
sediment should match the 230Th production in the over-
core sections.
lying water column integrated over the time of sediment
3.4. The 230Th-Normalized Fluxes and Focusing accumulation. 230Th inventories in excess of production,
Factors (y) on the other hand, are evidence of sediment focusing,
[21] 230Th normalization relies on the approximation while 230Th inventories lower than predicted from produc-
that the flux of scavenged 230Th reaching the seafloor tion are indicative of sediment loss, or winnowing, from
is equal to its known production rate by 234U decay in the core site. Focusing factors (y : ) are thus calculated as
the overlying water [Bacon, 1984; Suman and Bacon, the decay corrected sedimentary accumulation rate of
1989; François et al., 1990, 2004]. Sediment trap [Yu et scavenged 230Th divided by its rate of production in the
al., 2001; Scholten et al., 2005] and modeling [Henderson overlying water column integrated over the time interval
et al., 1999; Marchal et al., 2000] studies indicate that represented by the core depth interval [Suman and Bacon,
deviations from this assumption do not exceed 30% over 1989].
most oceanic regions. Consequently, there is a simple
inverse relationship between the vertical flux of particulate Zr2
230
material (Fv) and its scavenged 230Th activity which can be Thxs;0 rr dr
used to calculate preserved vertical fluxes from the activity
of scavenged 230Th in the bottom sediment. Scavenged, or Y ¼ r1
bzðt1 t2 Þ
initial excess 230Th (xs230Th(0)), was derived by correcting
the total 230Th activity for (1) contributions from detrital
and authigenic sources using the activities of 232Th and 238U where r1 is sediment depth (cm), t1 is the corresponding age
in the same samples and following principles summarized (ka), and rr is mean dry bulk density (g/cm3). The xs230Th0
5 of 19PA2213 KIENAST ET AL.: PARTICLE FLUX IN THE PANAMA BASIN PA2213
Figure 4. (a) Downcore 230Th-normalized fluxes and (b) MARs of organic carbon over the last 30 ka.
MARs are averaged over the time intervals from the core top to 9.5, 9.5– 13.4, 13.4 – 21, and 21– 27 ka.
Note different Y axes.
and rr are averaged over the depth interval z1 to z2. Note 4.2. Mass Accumulation Rates (MARs) and Sediment
that we recalculated y values for core Y69-71 here on the Focusing (y)
basis of 230Th values from Loubere et al. [2004], multiplied [25] Traditional MARs are consistently higher than Th-
by 0.85 (see section 3.1) and using the new chronology normalized fluxes (Figures 3b and 4b). MARs of bulk
described previously (see section 3.2). sediment and Corg range from lower values during the
3.5. Time Intervals Used for MAR and Focusing Holocene to higher values during OIS 2. Both Corg and
Calculations bulk sediment MARs display large and temporally variable
gradients between core sites. During the 9.5– 13.4 ka time
[23] We calculated MARs and focusing factors for OIS 1 interval, for example, bulk-MARs at site ME0005-24JC are
(core top to 13 ka BP) and for OIS 2 (13 – 27 ka B.P). Note almost 3 times higher than at neighboring site Y69-71.
that for all cores, 0 cm core depth does not equal zero years. [26] As expected, focusing factors reflect the same tem-
Although the definition of shorter time intervals may not poral and regional trends displayed by bulk MARs
necessarily be justified, particularly in cores TR163-31, (Figure 5) when calculated over the same time intervals.
TR163-19 and ME0005-27, which have a lower number Similar to bulk MAR, the focusing factor is maximal
of age control points, we nevertheless obtained MARs and (y = 7.9) at site ME0005-24 during the 9.5– 13.4 ka time
focusing factors for the core top to 9.5, 9.5 to 13.4, 13.4 to interval, implying that nearly 90% of the total sediment
21, and 21 to 27 ka BP time intervals in order to facilitate cannot be accounted for by vertical particle rain. This brief
comparison with the results of Loubere et al. [2004]. event is not evident in the other records. Holocene focusing
factors are >2 at the foot of the Carnegie Ridge (sites
4. Results ME0005-24JC and Y69-71) and Cocos Ridge (TR163-19P)
4.1. The 230Th-Normalized Fluxes indicating that more than 50% of the bulk sediment at
[24] Th-normalized fluxes of bulk sediment in the Panama these sites has been advected laterally during this period
Basin region range from lower values during the Holocene (Figures 5a and 5b). At all sites except ME0005-27 focusing
to higher values during OIS 2 (Figure 3a). As expected for factors are higher during OIS 2 (but see section 4.3). During
nearby sites, cores ME0005-24JC and Y69-71 show very OIS 2, y is 5.4 at ME0005-24JC, the highest measured for
similar Th-normalized bulk fluxes. Th-normalized fluxes of this period (Figure 5a).
organic carbon range from low values during the Holocene 4.3. Effect of Chronology on Focusing Factors
to maximal values during the early deglaciation (Figure 4a).
[27] By definition, focusing factors and MARs are highly
Note that the gradient between cores sites displayed by bulk
dependent on the age control of the sedimentary sequence.
and organic carbon fluxes is maintained throughout the last
Figure 6a compares focusing factors and MARs for core
30 ka. However, Th-normalized organic carbon fluxes differ
Y69-71 calculated on the basis of the new stratigraphy used
by approximately 30% between nearby sites Y69-71 and
here and on the basis of the stratigraphy used previously
ME0005-24JC (Figure 4a; see discussion in section 5.7).
[Loubere et al., 2004]. The shorter (in core depth) glacial
interval based on the new stratigraphy significantly
6 of 19PA2213 KIENAST ET AL.: PARTICLE FLUX IN THE PANAMA BASIN PA2213
Figure 5. Focusing factors for (a) the time interval of OIS 1 (core top –13 ka BP) and OIS 2 (13 –27 ka BP)
and (b) the time intervals from the core top to 9.5, 9.5– 13.4, 13.4 to 21, and 21– 27 ka.
decreases the MAR and focusing factor obtained for the radiocarbon date (at 32 calendar ka BP) to infer the core
interval from 21– 27 ka BP. Acknowledging that the stage depth corresponding to the stage 2/3 boundary at 27 ka,
2/3 boundary is difficult to define in d18O stratigraphies, focusing in the 21– 27 ka time interval would decrease to 3.3,
we examine the effect of a ±1.5 ka age uncertainty at the still higher than during the Holocene but significantly lower
OIS 2/3 transition (see error bars in Figure 6a). The lower than previously estimated [y = 8.2, Loubere et al., 2004].
focusing factors (4.4 –2.6) and MARs obtained in this way [28] On the basis of tight radiocarbon age constraints,
for the 21– 27 ka interval are not very different from those Skinner and Shackleton [2005] recently suggested that the
during the Holocene (y = 2.2). Similarly, if we were to postglacial benthic d 18O rise in the EEP lagged the benthic
reject the tuned age model altogether and rely on the d18O rise in the deep NE Atlantic by 4 ka and the global
Figure 6a. Comparison of bulk MARs (left) and focusing factors (right) of core Y69-71 calculated on
the basis of the age model used here (solid line) and the previous age model (gray dashed line). Vertical
lines indicate the error bars resulting from a ±1.5 ka uncertainty at the stage 2/3 boundary.
7 of 19PA2213 KIENAST ET AL.: PARTICLE FLUX IN THE PANAMA BASIN PA2213
Figure 6b. Comparison of bulk MARs (left) and focusing factors (right) of core TR163-31P calculated
using the stratigraphy of Martin et al. [2002] (gray dashed lines), which is largely based on d18O
correlation to SPECMAP and based on adjusting this chronology by 2 ka during the deglaciation to
account for the potential lag of deep Pacific d18O versus the global glacioeustatic component suggested
by Skinner and Shackleton [2005] (solid lines). Vertical lines indicate the error bars resulting from a
±1.5 ka uncertainty at the stage 2/3 boundary.
glacioeustatic d 18O component by 2 ka because of local less sediment is assigned to the glacial interval, making
hydrographic effects in the deep Pacific. If we adjust the glacial MARs lower, which in turn translates into smaller
chronology of TR163-31P for this effect by subtracting 2 ka glacial focusing factors (Figure 6b). Allowing an age
from core depths corresponding to the benthic d 18O rise, uncertainty of ±1.5 ka at the OIS 2/3 transition could further
Figure 6c. Comparison of bulk MARs (left) and focusing factors (right) of core ME0004-24JC
calculated on the basis of the stratigraphy used here (solid lines) and on the basis of a radiocarbon age
model which requires extrapolation from the oldest radiocarbon date at 20.6 ka to the OIS 2/3 boundary
(dashed lines). Vertical lines indicate the error bars resulting from a ±1.5 ka uncertainty at the stage
2/3 boundary.
8 of 19PA2213 KIENAST ET AL.: PARTICLE FLUX IN THE PANAMA BASIN PA2213
reduce focusing factors and MARs (error bars in Figure 6b). large difference between MARs at closely adjacent sites
Nevertheless, in the case of TR163-31P, the focusing factor Y69-71 and ME0005-24JC. The difference in MAR values
and MAR during OIS 2 remain higher (y = 3– 3.6) than between these two sites is even larger prior to the Holocene
during OIS 1 (y = 2) (Figure 6b). (Figures 3b). This observation suggests that MARs, at least
[29] The age model of ME0005-24JC used in this study is at site ME0005-24JC, are not solely driven by vertical flux.
based on correlation of its down core carbonate profile to [32] Using chirp subbottom and seismic reflection profiles
that of Y69-71 (see section 3.2). Taking the same ±1.5 ka over sites ME0005-24JC and Y69-71, Lyle et al. [2005]
age uncertainty at the OIS 2/3 into account illustrates that noted a consistent bias of sediment deposition to the deeper
focusing factors and MARs during OIS 2 might not basin over the entire depositional period (2.5 Ma yrs),
be significantly different from those observed during the with site Y69-71 collecting sediment at a rate 30% slower
0 – 9.5 kyr time interval (Figure 6c). If, on the other hand, than the deeper site ME0005-24JC. On the basis of the
we were to reject the tuned age model and rely exclusively depth of a major seismic horizon which has a mean depth of
on the radiocarbon dates, we would have to linearly 15.7 m in the subbottom profile, but is found at 16.7 m at
extrapolate sedimentation rates from the 14C age at 20 ka site Y69-71 and 24.3 m depth at sites ME0005-24JC, Lyle et
to the base of OIS 2 at 27 ka. Doing so increases the al. [2005] estimated focusing factors of 1.1 (Y69-71) and
sediment interval corresponding to the 21– 27 ka BP time 1.5 (ME0005-24JC), assuming that sediment focusing is
interval, which in turn increases the corresponding MARs supplied by local sediment redistribution within the area
and focusing factors (y = 7.9 – 12.6) significantly over those acoustically surveyed. The relative difference between these
observed in the 0 – 9.5 ka interval (y = 4.3, Figure 6c). Note estimates (1.1/1.5 = 0.7) is consistent with the difference in
230
also that the maxima in focusing and MAR between 9.5 and Th-based focusing factors at both sites averaged over the
13.4 ka BP in the carbonate based age model (Figures 3b last 27 ka (3.1 for Y69-71 versus 5.3 for ME0005-24JC;
and 5b) decrease in comparison with glacial time intervals 3.1/5.3 = 0.6). Thus on this regional scale at least, there is
when using the radiocarbon base age model (Figure 6c), good agreement between seismic and geochemical evidence
once again illustrating the delicate dependence of focusing for sediment focusing. Both methods thus show that, despite
factors and MARs on core chronology. similar vertical fluxes at both sites (due to their proximity),
there is more lateral input of sediment at the deeper site. The
4.4. Geochemistry chief difference between the seismic and geochemical
[30] The down core record of ME0005-24JC exhibits a approach is that 230Th based estimates of focusing are much
pronounced maximum in Fe/Al and Mg/Al ratios higher and suggest that both sites received an additional
between 13.5 and 10 cal ka (Figures 7b and 7c), and lateral input of sediment from outside the region acousti-
Sinonbiogenic/Al and Mn/Al ratios are also elevated during cally surveyed.
this period (Table 3). This metal enrichment is also
observed in the same time interval in nearby core 5.2. Sources of Lateral Advection to Sites
Y69-71 (S. E. Calvert, unpublished data, 2006), but is ME005-24JC and Y69-71
absent in all the other cores considered here. The period [33] We see two potential sources of laterally advected
of metal enrichment corresponds to the time of maximal sediment to sites ME0005-24JC and Y69-71. The first one
y (Figures 5b and 7d) and MAR values (Figure 3b) in is general downslope transport of sediment from the sur-
the carbonate based age model and a minimum in rounding Carnegie and Cocos Ridges into the southern
%CaCO3 content at site ME0005-24JC (Figure 7a). A boundary region of the Panama Basin. The second one is
more modest % CaCO3 minimum is also apparent at site the episodic advection of hydrothermally influenced mate-
Y69-71 at this time (Figure 7a). rial, presumably from the Galapagos Spreading Center (see
Figure 1 for location).
5. Discussion 5.2.1. Downslope Transport
5.1. The 230Th-Normalized Fluxes and Focusing [34] On the basis of seismic reflection profiles from the
Factors in the Equatorial Pacific early 1970s, it has been known for some time that the
sediment cover to the acoustic basement on the Carnegie
[31] The advantages of Th normalization are its relative and Cocos Ridges is thin and even partially absent [Van
insensitivity to stratigraphic errors and the possibility of a Andel et al., 1971]. Seismic imaging during ODP Leg 202
high-resolution, point-by-point determination of paleofluxes confirmed these observations for the eastern Carnegie Ridge
[François et al., 2004]. Earlier studies have also docu- [Mix et al., 2003]. Textural and compositional analyses
mented a much higher degree of consistency in the sedi- revealed that the Carnegie and Cocos Ridges are indeed
mentary record of adjacent cores when using 230 Th characterized by lag deposits mainly composed of coarse
normalization versus MARs [e.g., Anderson et al., 2006; carbonate (intact planktonic foraminiferal shells), sand-
Loubere et al., 2004; François et al., 2004; Thomson et al., sized ash particles and hydraulically equivalent volcanic
1999; Frank et al., 2000, 1999; Rühlemann et al., 1996]. minerals, whereas fine carbonate and opal are transported
The same is clearly true for this study, where Th-normalized into the Panama Basin by downslope transport [Van Andel,
fluxes display a much more coherent pattern between core 1973; Moore et al., 1973; Kowsmann, 1973]. Substantial
sites than MARs. (Figures 3 and 4). Both Th-normalized sediment transport was also deduced from observations of
fluxes and MARs follow the trend expected from modern transverse dunes and barchans in an erosional valley
surface productivity (Figure 8), although absolute MARs excavated into the northern flank of the Carnegie Ridge
are much higher than Th-normalized fluxes and there is a
9 of 19PA2213 KIENAST ET AL.: PARTICLE FLUX IN THE PANAMA BASIN PA2213
Figure 7. (a) Carbonate weight percent in core ME0005-24JC (solid gray line) and core Y69-71
(dashed gray line; data from Lyle et al. [2002]) and Th-normalized carbonate flux in core ME0005-24JC
(solid black line) compared with (b) Fe, (c) Mg, and (d) focusing factors. Black lines indicate 230Th-
normalized fluxes of Fe and Mg and gray lines indicate metal/Al ratios.
[Lonsdale and Malfait, 1974]. The valley itself is a several seafloor (>10 cm/sec, Beaulieu [2002],) especially in areas
hundred meter deep depression cut into pelagic sediments. of high relief and where flow is channeled [e.g., Lonsdale et
The dunes in the valley point northwestward, indicating al., 1972; Cacchione et al., 2002; Shanmugam, 2003]. Such
down-valley sediment transport from the saddle in the resuspension would automatically lead to downslope trans-
central Carnegie Ridge into the Panama Basin. They are port and preferential sediment accumulation in troughs such
composed of sand-sized, broken (70%) and intact tests of as the abyssal valley where sites Y69-71 and ME0005-24JC
Quaternary foraminifera [Lonsdale and Malfait, 1974]. are located. Indeed, tidal currents reaching 15– 20 cm/sec
[35] Although deep sea tidal currents are neither unidi- were observed in an erosional valley on the southern side of
rectional nor continuous, they are often strong enough to the Carnegie Ridge (Spiess et al. [1973], as cited by
entrain pelagic sediments and remove fine particles from the Lonsdale and Malfait [1974]), and barchans and related
10 of 19PA2213 KIENAST ET AL.: PARTICLE FLUX IN THE PANAMA BASIN PA2213
Table 3. Summary of Major and Minor Element Data of Hydrothermal Deposits From the Vicinity of the
Galapagos Rift in the Panama Basin Compared With Average Continental Crust and Basalt
Upper Continental Average Hydrothermal ME0005-24JC ME0005-24JC
Crusta Basaltb Depositsc During Eventd Before/After Evente
Fe/Al 0.44 1.3 43 ± 8.7 4.2 0.75
Mg/Al 0.17 0.54 2.9 ± 0.6 2.9 0.5
Si/Al 3.8 2.8 44.7 ± 4.3 5.9f 2.5f
Mn/Al 0.0074 0.0211 0.99 ± 0.64 0.63 0.15
a
Taylor and McClennan [1985].
b
Faure [1991].
c
Ratio of average metal to average Al concentration in well-crystallized nontronites dredged from hydrothermal sediment
mounds south of the Galapagos Spreading Center (samples N1 – N5 [Corliss et al., 1978]).
d
Maximal values during the %CaCO3 minimum event.
e
Average values before and after the %CaCO3 minimum event.
f
Opaline Si was subtracted from total Si.
dune forms generally indicate velocities of 40– 100 cm/sec different between 13.5 to 10 ka BP. During this time period,
in restricted passages [Masson et al., 2004, and references Fe/Al, Mg/Al, Mn/Al, and Si/Al ratios are elevated over
therein]. values commonly observed in upper crust and basalt
5.2.2. Hydrothermal Input (Figures 7b, 7c, and Table 3). The hydrothermal deposits
[36] An additional source of laterally advected sediment found south of the Galapagos Spreading Center are enriched
could be the hydrothermal mound deposits located in an in Fe-rich smectite (nontronite), which is characterized by
area of high heat flow south of the Galapagos Spreading extreme Al depletion (0.01– 1.12 weight%) signifying the
Centre [Lonsdale, 1977; Corliss et al., 1978], which is presence of Fe in the octahedral as well as the tetrahedral
approximately 50 nautical miles to the north of sites sites of this mineral phase. The hydrothermal deposits are
ME0005-24JC and Y69-71 (Figure 1). The bulk chemical also highly enriched in Mn and Si, and somewhat enriched
composition of ME0005-24JC and Y69-71 is significantly in Mg compared to upper crust or basalt. They are thought
Figure 8. Th-normalized fluxes and MARs of organic carbon (averaged from the age of the core top to
9.5 ka BP) versus modern primary production at the core sites [Antoine et al., 1996]. Both proxies display
the regional gradient expected on the basis of modern conditions. However, MARs are larger and show a
significant difference between sites ME0005-24JC and Y69-71. Site P7 is omitted because it only has one
data point for the last 9.5 ka.
11 of 19PA2213 KIENAST ET AL.: PARTICLE FLUX IN THE PANAMA BASIN PA2213
Figure 9. Focusing factors (Y) in the equatorial Pacific during (a) the Holocene, (b) the last glacial
period, and (c) the ratio of glacial to Holocene focusing factors in the eastern equatorial Pacific. Data and
references are reported in Table 4.
to form by deposition of Fe, Mn and Si from hydrothermal normalization is thought to somewhat underestimate the
fluids, which circulate through the basaltic crust and over- vertical particle flux of individual sediment components in
lying sediments in this region [Corliss et al., 1978]. The settings where a deep nepheloid layer advects material with
geochemistry of core ME0005-24JC thus points to the a composition that is different from that found at the final
influence of allochthonous hydrothermal (nontronitic) deposition site [François et al., 2004]. Nearby core Y69-71
material between 13.5 – 10 ka BP, which has diluted the also displays a drop in %CaCO3 at this time (Figure 7a), as
carbonate fraction, thereby producing the marked %CaCO3 well as enrichments in Fe, Si and Mg (not shown) indicating
minimum in this core (Figure 7a). The addition of laterally that this site was also affected by hydrothermal input, albeit
sourced sediment during this brief time interval is consistent to a lesser extent.
with the high focusing (Figure 7d) and MAR (Figure 3b) [37] These two sources of sediment, the Carnegie Ridge
values based on the correlated age model at that time. It is and the Galapagos Spreading Center lie outside the sub-
also consistent with the slight decrease in Th-normalized bottom profile presented by Lyle et al. [2005], suggesting
CaCO3 fluxes during this time period (Figure 7a), as Th that their acoustically surveyed section might not represent a
12 of 19PA2213 KIENAST ET AL.: PARTICLE FLUX IN THE PANAMA BASIN PA2213
Table 4. Focusing Factors (Y) in the Central and Eastern Equatorial Pacific
Core id Latitude Longitude Depth, m Y Holocene Y Glacial Y Gl/Y Hol Reference
TT013 MC112 5.00N 140.00W 4560 1.0 Berelson et al. [1997]
TT013 MC34 5.00S 140.00W 4391 1.1 Berelson et al. [1997]
TT013 MC27 3.00S 140.00W 1.1 Berelson et al. [1997]
TT013 MC97 2.00N 140.00W 4540 1.1 Berelson et al. [1997]
TT013 MC69 0.00N 140.00W 4440 1.9 Berelson et al. [1997]
TT013 MC19 2.00S 140.00W 4475 1.9 Berelson et al. [1997]
61 BX1 0.91N 140.04W 4328 1.4 1.9 1.4 Yang et al. [1990]
MANOP B25 1.05N 139.02W 4401 0.7 0.8 1.1 Marcantonio et al. [2001]
TT013-PC18 2.00S 139.00W 4354 2.8 0.7 0.3 Marcantonio et al. [1996]
TT013-PC72 0.00N 139.00W 4298 2.3 2.3 1.0 Marcantonio et al. [1995]
MANOP B18 1.06N 138.80W 4281 0.9 0.6 0.7 Marcantonio et al. [2001]
54 BX1 1.01N 133.70W 4212 1.5 2.0 1.3 Yang et al. [1990]
53 BX1 0.98N 124.63W 4516 1.8 3.0 1.7 Yang et al. [1990]
52 BX1 1.01N 118.20W 3857 1.2 1.8 1.5 Yang et al. [1990]
ODP-849B 0.18N 110.52W 3851 2.1 3.0 1.4 Pichat et al. [2004]
50 BX1 1.03N 104.41W 3473 1.8 2.3 1.3 Yang et al. [1990]
RC13-110 0.10N 95.65W 3231 2.0 1.6 0.8 Loubere et al. [2004]
ODP-846B 3.10S 90.82W 3307 2.1 3.7 1.8 Loubere et al. [2004]
ME0005-24JC 0.02N 86.46W 2941 4.9 5.5 1.1 this study
Y69-71 0.10N 86.48W 2740 2.5 3.6 1.4 this study
P7 2.60N 83.79W 3085 1.2 1.9 1.6 this study
Y71-6-12 16.45S 77.57W 2734 1.4 0.9 0.6 S. S. Kienast et al.,
unpublished data, 2006
ME0005-27JC 1.85S 82.79W 2203 1.8 1.7 0.9 this study
VNT01-8PC 0.03N 110.48W 3791 1.6 2.3 1.4 S. S. Kienast et al.,
unpublished data, 2006
TR163-19 2.26N 90.95W 2348 2.2 2.5 1.1 this study
TR163-31 3.60S 83.95W 3209 1.6 3.4 2.1 this study
V21-40 5.52S 106.76W 3128 3.5 3.2 0.9 S. S. Kienast et al.,
unpublished data, 2006
V19-28 2.37S 84.65W 2720 2.0 3.5 1.8 Lao et al. [1992]
V19-29 3.58S 83.93W 3157 2.4 2.4 1.0 Lao et al. [1992]
KLH 093 1.50N 102.06W 3260 2.1 2.5 1.2 Frank et al. [1994]
KLH 068 1.23N 101.61W 2870 1.3 1.6 1.2 Frank et al. [1994]
RC13-140 2.87N 87.75W 2246 2.9 3.6 1.2 L. I. Bradtmiller et al.,
unpublished data, 2006
RC11-238 1.52S 85.82W 2573 3.0 2.0 0.7 L. I. Bradtmiller et al.,
unpublished data, 2006
V19-30 3.38S 83.52W 3091 3.2 4.4 1.3 L. I. Bradtmiller et al.,
unpublished data, 2006
RC13-114 1.65S 103.63W 3436 3.8 2.2 0.6 L. I. Bradtmiller et al.,
unpublished data, 2006
closed system with respect to sedimentation. This implies [2004], Lyle et al. [2005] disputed the validity of 230Th-
that their claim that 230Th normalization overestimates normalized fluxes by arguing that such high sediment
sediment focusing is unwarranted. focusing extrapolated over the entire region where they
have identified a glacial MAR maximum (a 6° square
5.3. Local Differences in the Degree of Focusing in the area) would necessitate a source region barren of sediment
Panama Basin and Regional Sediment Mass Balance covering a 17° square area, which would be easily noticed
[38] The compilation of data from the Panama Basin in but has not been observed in the equatorial Pacific [Lyle et
Figure 5 indicates that focusing factors are highly variable al., 2005]. Our data show, however, in light of the spatial
in time and space. High values are restricted locally to the and temporal heterogeneity of focusing factors reported
area of the seafloor at the foot of the Carnegie Ridge here, that extrapolating a focusing factor estimated from
(ME0004-24JC and Y69-71) and the Cocos Ridge one site to the entire EEP cannot be justified. In addition,
(TR163-19P). They are less pronounced on the slope of the original glacial focusing factors reported at site Y69-71
the Carnegie Ridge (ME0005-27JC) and do not extend far need to be revised down significantly (see section 4.3 and
into the Panama Basin (P7). This is consistent with the view below), further decreasing the need for an inordinately large
that sediment focusing and winnowing are controlled by source region to account for the glacial increase in focusing.
bathymetry and current flow on a local scale [e.g.,
Turnewitsch et al., 2004; Loubere et al., 2004; Scholten 5.4. Focusing Factors in the Central and Eastern
et al., 1994]. Equatorial Pacific
[39] On the basis of earlier findings of very high glacial [40] Focusing factors reported thus far for the central and
focusing factors at site Y69-71 (y = 8.2; Loubere et al. eastern equatorial Pacific region are summarized in Figure 9
13 of 19PA2213 KIENAST ET AL.: PARTICLE FLUX IN THE PANAMA BASIN PA2213
and Table 4. At most sites, focusing factors are greater than erroneously high. Previously published Holocene focusing
one during the Holocene (Figure 9a). This is not surprising factors and MARs might also not be free of uncertainties.
given that high-sedimentation sites are preferentially chosen Piston cores often overpenetrate the sediment during coring
for coring operations because of their expected high tem- operations, which leads to a real age of the top most core
poral resolution. The compilation also reveals that focusing sample that is unknown and non zero. Assigning an age of
factors are generally higher in the eastern equatorial Pacific, zero years to the core top, however, results in a longer time
particularly in the vicinity of the Panama Basin. This interval for the Holocene core interval. This results in
observation is consistent with the view that topographic MARs and focusing factors that are erroneously low,
relief should favor downslope sediment transport and thereby further enhancing the apparent glacial-interglacial
focusing. Note, however, that a more modest, but still contrast in focusing factors and MARs. Analyzing multi-
prevalent focusing effect is also found at sites between cores with undisturbed sediment surfaces together with
95° and 140°W and 0° and 2°N, far away from major piston/gravity cores, such as done in the Southern Ocean
topographic features. Another remarkable observation is the [Frank et al., 2000], would allow evaluation of this
relative increase in focusing during the last glacial period potential bias.
apparent at many sites, especially those near topographic [42] If, on the other hand, we assume that the increase in
features (Figure 9c). glacial focusing is real and not solely driven by uncertain-
ties in age control, we need a mechanism that can explain
5.5. Possible Mechanisms for Higher Glacial Focusing this general increase in sediment redistribution during
Factors glacial periods. One possibility could be related to an
[41] We see two principal ways to explain the higher increase in tidal dissipation during glacial stages. Wunsch
glacial focusing factors observed in the EEP. One possibility [2003] suggested that tidally induced ocean mixing should
is that the glacial increase in focusing in this EEP is only have increased during the LGM because of an increase in
apparent and partly or largely results from inaccurate age deep ocean tidal dissipation when shallow energy sinks
control. Focusing factors are essentially the accumulation were removed by lower sea level stands. Recent modeling
rate of scavenged 230Th divided by its rate of production, studies indeed suggest that globally averaged barotropic
and thus the largest source of uncertainty in estimates of tidal kinetic energies and deep ocean dissipation were
focusing comes from uncertainties in age models and significantly greater for LGM bathymetries [Egbert et al.,
MARs. Very high focusing factors (y = 8.2) were reported 2004; Arbic et al., 2004]. Since there is significant dissipa-
for the 23– 27 ka time interval of core Y69-71 on the basis tion of tidal energy over rough topography in the open
of an earlier chronology [Loubere et al., 2004]. Using the ocean [Egbert and Ray, 2000, 2001], this effect could have
revised chronology now available for this core (see been particularly strong in the Panama Basin area in view of
section 3.2), MARs and focusing factors are reduced here the rugged local seafloor topography. The overall increase
by more than a factor of 2 (y = 3.6) for this time interval. in tidal dissipation would have caused an enhancement in
Allowing for a ±1.5 ka age uncertainty at the stage 2/3 abyssal tidal currents and is likely to have resulted in greater
boundary could either increase or further reduce focusing entrainment and redistribution of sediment particles. The
and MARs in this time interval (y = 4.4– 2.6), with the tidally induced forcing of sediment redistribution proposed
reduced values being much closer to Holocene ones (y = 2.2; here is time variant and thereby addresses one of the
Figure 6a). In core ME0005-24JC, which displays the requirements of Paytan et al. [2004] for a climatically
highest overall focusing values and MARs observed in driven physical mechanism to explain glacial-interglacial
this study, a ±1.5 ka age uncertainty could similarly changes in sediment focusing.
increase or reduce the difference between Holocene and
glacial focusing and MARs (Figure 6c). In core TR163-31, 5.6. Paleoproductivity Reconstructions in the EEP
the same error would still leave glacial focusing factors From Th-Normalized Fluxes of Organic Carbon
slightly higher than Holocene ones (Figure 6b). It is obvious [ 43 ] Despite the difference between MARs and
that focusing factors and MARs are highly sensitive to the 230
Th-normalized fluxes in the Panama Basin, both proxies
age model, and it is possible that the apparent increase during show overall higher Corg fluxes in OIS 2. These findings are
the glacial period observed here might be partly due to in qualitative agreement with previous studies pointing to
inaccuracies in age control. Many of the records compiled higher export production during OIS 2 [Pedersen, 1983,
in Figure 9 are dated using d 18O stratigraphies, in which the 1988; Farrell et al., 1995; Yang et al., 1995; Herguera,
base of glacial stage OIS 2 at 27 ka BP is notoriously difficult 2000; Lyle et al., 2002]. However, 230Th normalized Corg
to identify. Additional uncertainty has recently been implied fluxes are maximal during the deglaciation (18– 13 ka BP)
during the deglaciation and at the beginning of OIS 2. Skinner rather than the full glacial per se, suggesting enhanced
and Shackleton [2005] suggested that the postglacial benthic export production or organic matter preservation at that
d 18O rise in the EEP lagged the benthic d18O rise in the deep time, which is consistent with a recent study identifying the
NE Atlantic by 4 ka and the global glacioeustatic d 18O time interval from 20– 15 ka BP as the period of most
component by 2 ka because of local hydrographic effects in intense upwelling in the EEP over the last 40 ka [Martinez
the deep Pacific. If true, this effect would have led to an et al., 2006].
overestimation of the thickness of the glacial sediment [44] On the other hand, higher glacial 230Th-normalized
intervals in previous studies based on d 18O stratigraphies Corg fluxes are at odds with lower estimates of paleoexport
in the Pacific, rendering glacial focusing factors and MARs production during OIS 2 in the Panama Basin based on a
14 of 19PA2213 KIENAST ET AL.: PARTICLE FLUX IN THE PANAMA BASIN PA2213
Figure 10. 230Th-normalized organic carbon flux compared to paleoproductivity estimates based on
benthic foraminifera [Loubere et al., 2003] at site Y69-71.
benthic foraminiferal transfer function [Loubere et al., remains even when using organic carbon data produced by
2003]. Both methods have been applied at site Y69-71, the same laboratory (Figure 11a). We recognize three non
and lead to opposite results (Figure 10). This discrepancy is exclusive possibilities to explain the difference in weight
perplexing, and unresolved at the time of writing. Benthic percentages and hence 230Th normalized fluxes of organic
foraminiferal assemblages are known to record the relative carbon and opal at these sites:
changes in the flux of labile organic carbon to the seabed [46] 1. Higher sedimentation rates at ME0005-24JC could
[e.g., Kuhnt et al., 1999; Loubere and Fariduddin, 1999; have led to faster burial and better preservation of organic
Wollenburg and Kuhnt, 2000], as does the 230Th normalized carbon and biogenic opal at this site compared to Y69-71
organic matter burial. Further work will be needed to [sensu Müller and Suess, 1979].
resolve this discrepancy. [47] 2. A subtle increase in carbonate dissolution with
depth would lead to increased weight percentages of organic
5.7. Difference in 230Th-Normalized Organic Carbon carbon, opal as well as terrigenous material at site ME0005-
and Opal Fluxes Between Sites Y69-71 and 24JC, which is 200 meters deeper than site Y69-71. Indeed,
ME0005-24JC %opal and %terrigenous material (not shown) are slightly
[45] 230Th-normalized organic carbon fluxes are approx- higher in core ME0005-24JC than in core Y69-71, where as
imately 30% higher at deeper site ME0005-24JC compared %carbonate is slightly higher in core Y69-71 (Figure 7a).
to Y69-71 from 27 to 9 ka BP (Figures 4a and 11a). [48] 3. Preferential removal and advection of organic
A similar offset between both sites is observed in 230Th- matter and opal concentrated in the fine sediment fraction
normalized opal fluxes (Figure 11b). Sedimentation rates to site ME0005-24JC offers a third explanation. In this
(Figure 2) and focusing factors (Figure 5b) are also signif- scenario, the preferential advection of a minor sediment
icantly higher at ME0005-24JC than at site Y69-71 in the constituent such as organic carbon or opal would not
time interval from 27 to 9 ka BP. Thorium normalized significantly affect the 230Th-normalized flux of bulk sed-
fluxes of bulk sediment on the other hand which are iment and major sediment constituents, but would increase
dominated by carbonate are very similar at both sites the %Corg and % opal at the receiving site, resulting in
throughout the last 30 ka (Figure 3a). The higher 230Th higher 230Th-normalized values of these constituents (see
normalized biogenic fluxes at site ME0005-24JC compared section 3.4).
to Y69-71 are related to higher weight percentages of these [49] These possibilities need to be investigated further,
constituents at the former site, which translate directly into particularly in light of the discrepancy with paleoproduc-
higher 230Th-normalized flux estimates (see equations in tivity reconstructions based on benthic foraminiferal trans-
section 3.4). At least for organic carbon, analytical differ- fer functions (Figure 10). It is possible that this discrepancy
ences between ME0004-24JC and Y69-71 (see section 3.1) might be related, in part, to a possible preference of benthic
cannot fully account for the intersite difference, as an offset foraminifera for very fresh organic matter delivered directly
15 of 19PA2213 KIENAST ET AL.: PARTICLE FLUX IN THE PANAMA BASIN PA2213
Hence we suspect that while preferential advection of
organic carbon (and opal) under conditions of elevated
focusing is possible, it is not the dominant control on the
Th-normalized organic carbon and opal fluxes in core
ME0005-24JC.
6. Summary and Conclusions
[50] The use of Th normalization as a tool for recon-
structing past particle fluxes from the sea surface to the
seafloor is still controversial [Lyle et al., 2005; François et
al., 2007]. This study shows that 230Th-normalized fluxes
of bulk sediment and organic carbon display a regionally
coherent pattern in the EEP, which is consistent with
present-day surface oceanographic conditions. Nearby sites
show almost identical 230Th-normalized bulk fluxes and a
30% difference in 230Th-normalized Corg fluxes. Traditional
MARs of bulk sediment and Corg, on the other hand, are
significantly higher, and display large site-to-site variability.
Thus the results of this study further validate 230Th
normalization.
[51] Holocene focusing factors are 2 – 4 at the foot of the
Carnegie Ridge, suggesting that lateral sediment transport to
this region is significant. This observation is consistent with
earlier observations of lag deposits and bare rock on top of
the Carnegie Ridge and of an erosional valley on the basin-
facing slope of the ridge. The relative difference between
focusing factors at two nearby sites the Panama Basin
estimated by 230Th normalization and using seismic profiles
[Lyle et al., 2005] is comparable.
[52] Sites that are affected by focusing in the Holocene
show even higher focusing factors during OIS 2, similar to
previous findings in the central and eastern EEP. Examina-
tion of the effect of chronological uncertainties at the OIS 2/3
and 1/2 boundaries in our records shows that the magnitude
of the glacial increase in focusing factors and MARs is very
sensitive to chronological uncertainties. We thus offer two
possible explanations for the glacial increase in focusing and
MARs. The first one is that the apparent increase in lateral
sediment redistribution is partly or even largely an artifact of
Figure 11. Th-normalized fluxes of organic carbon (a) and insufficient age control in the EEP. The second explanation,
biogenic opal (b) at sites ME0005-24JC and Y69-71. Note which assumes that the observed increase is real, invokes
that the difference in organic carbon fluxes between both sites enhanced deep sea tidal current flow during periods of low
largely remains when using Corg data produced by the same sea level stand [Wunsch, 2003]. Only improved stratigraphic
laboratory (OSU) for the flux calculations. Percent organic control will help to distinguish between these two scenarios.
carbon data of ME0005-24JC used for Th-normalized flux [53] The controversy revolving around 230Th normaliza-
calculations are from this study (red solid line), from Lyle et tion was partly triggered by very high estimates of glacial
al. [2005], red dashed line), and from Lyle et al. [2002] for focusing (y = 8.2) at site Y69-71 in an earlier study
core Y69-71 (blue line). Percent biogenic opal data used for [Loubere et al., 2004]. Extrapolating from this site to the
Th-normalized flux calculations are from this study entire EEP, Lyle et al. [2005] assumed the need for a
(ME0005-24, red line) and Lyle et al. [2002], Y69-71, sediment source covering a 17° square area to account for
blue line). the high focusing in the Panama Basin during the LGM,
which is not observed in seismic surveys. Using improved
chronological control at site Y69-71, we show here that
from the sea surface versus laterally advected organic matter glacial focusing values have to be revised down consider-
which could be more refractory. However, we note that the ably (y = 4.4– 2.6), although lateral sediment input is still
pattern of 230Th-normalized Corg flux at ME0005-24JC considerable. In addition, the large spatial and temporal
strongly resembles that at other sites in the Panama Basin, heterogeneity of focusing factors observed in the EEP and
including sites ME0005-27JC and P7, which are only elsewhere does not warrant extrapolation from one site to
marginally affected by focusing (Figures 4a, 5a, and 5b). the entire region. Thus there appears to be no requirement
16 of 19You can also read