The Housing Stock of The United Kingdom - Justine Piddington, Simon Nicol, Helen Garrett, Matthew Custard - BRE Group

Page created by Jeff Navarro
 
CONTINUE READING
The Housing Stock of The United Kingdom - Justine Piddington, Simon Nicol, Helen Garrett, Matthew Custard - BRE Group
www.bretrust.org.uk

The Housing Stock of
The United Kingdom
Justine Piddington, Simon Nicol, Helen Garrett, Matthew Custard
The Housing Stock of The United Kingdom - Justine Piddington, Simon Nicol, Helen Garrett, Matthew Custard - BRE Group
2                                                                                                     The Housing Stock of The United Kingdom     The Housing Stock of The United Kingdom                                                    3

                                                                      not an option. Improving our existing dwellings does not, however,
    Executive summary                                                 need to be overly expensive and has multiple benefits to society as a
                                                                      whole, both economic and social. It is also more sustainable.
    There is a regular call for statistics on the United Kingdom
    (UK) housing stock, usually to compare them with statistics       The report concludes that investments in national housing condition
    of other European or world nations. This is, however, not         surveys will pay for themselves time again in well-informed, funded
    straightforward, as they have to be compiled from the four        and targeted housing policies that will ultimately deliver social and
    separate housing surveys of England, Scotland, Wales and          economic benefits. All the better if these surveys have comparable

                                                                                                                                                                                   Contents
    Northern Ireland. The four surveys are undertaken over            methodologies and timeframes.
    different timescales, with different sampling criteria and
    survey instruments. Even questions that appear similar are
    often subtly different. Scotland and Wales do not include
    vacant dwellings whereas England and Northern Ireland do.         Acknowledgements
    Nevertheless, key information which describes the housing         This report was funded by the BRE Trust.
    stock of the four nations is comparable.
                                                                      The authors would like to thank the following for their guidance and
    This report is a follow-up to the BRE Trust publication           advice:
    ‘Housing in the UK’, which used data from the four national
    housing surveys when they were last aligned in 2008.              – Reannan Rottier and Stephanie Freeth of MHCLG
    This update uses the latest published survey data and the         – Gowan Watkins of the Welsh Government
    reference year is ‘2017’.
                                                                      – Jahnet Brown of the Northern Ireland Housing Executive
    To compile this report, a UK dataset has not been created.
                                                                                                                                                                                   1. The need for statistics on the UK housing stock   4
                                                                      –	Diarmuid Lloyd and Adam Krawczyk of the Scottish Government
    Rather, the published findings from the latest national reports
    have been taken and combined. This ensures that (unless           and the following for providing images of housing in Denmark and                                             2. The UK housing stock                              14
    otherwise explained) there are no contradictions between          Africa respectively:
    the UK and individual national reports and that, if more detail
    is required, these can be obtained through the published          – Anders Gade Jeppesen of BL Danish Housing                                                                  3. Housing quality and condition                     22
    national reports and referenced back to the UK picture.
                                                                      – Gwyn Roberts of BRE
    The results show that there are subtle differences between                                                                                                                     4. Comparisons between the UK and other nations      31
    the housing stocks of the four nations. Scottish workers’         Any third-party URLs are given for information and reference purposes
    housing was traditionally provided in tenements rather            only and the BRE Trust does not control or warrant the accuracy,
    than terraces, and flatted accommodation still dominates          relevance, availability, timeliness or completeness of the information                                       5. The future housing stock of the UK                38
    in urban areas. Northern Ireland has a much higher                contained on any third-party website. Inclusion of any third-party
    proportion of bungalows. The revolution in home heating           details or website is not intended to reflect their importance, nor is it
    powered by North Sea gas in Great Britain passed Northern         intended to endorse any views expressed, products or services offered,                                       6. Conclusions                                       42
    Ireland (and many rural areas) by and the main form of            nor the companies or organisations in question.
    heating there is still from expensive fuel oil.                                                                                                                                7. References                                        43
                                                                      Any views expressed in this publication are not necessarily those
    The UK has the oldest housing stock in Europe, and most           of the BRE Trust. Every effort has been made to ensure that
    likely in the world. This is largely due to the legacy of         the information and guidance in this publication were accurate
    dwellings built during the industrial revolution, which still     when published, but the Trust can take no responsibility for the
    form the backbone of our urban areas today. While still           subsequent use of this information, nor for any errors or omissions it
    widely valued, these homes present challenges in making           may contain. To the extent permitted by law, the BRE Trust shall not
    them healthy, safe and suitable for the future. Wales has         be liable for any loss, damage or expense incurred by reliance on the
    the oldest, and poorest, housing stock in the                     information or any statement contained herein.
    UK; Northern Ireland the youngest and least
    likely to contain health and safety hazards.

    The UK housing stock is changing very
    slowly over time and it is clear that
    substantial replacement by newbuild is
The Housing Stock of The United Kingdom - Justine Piddington, Simon Nicol, Helen Garrett, Matthew Custard - BRE Group
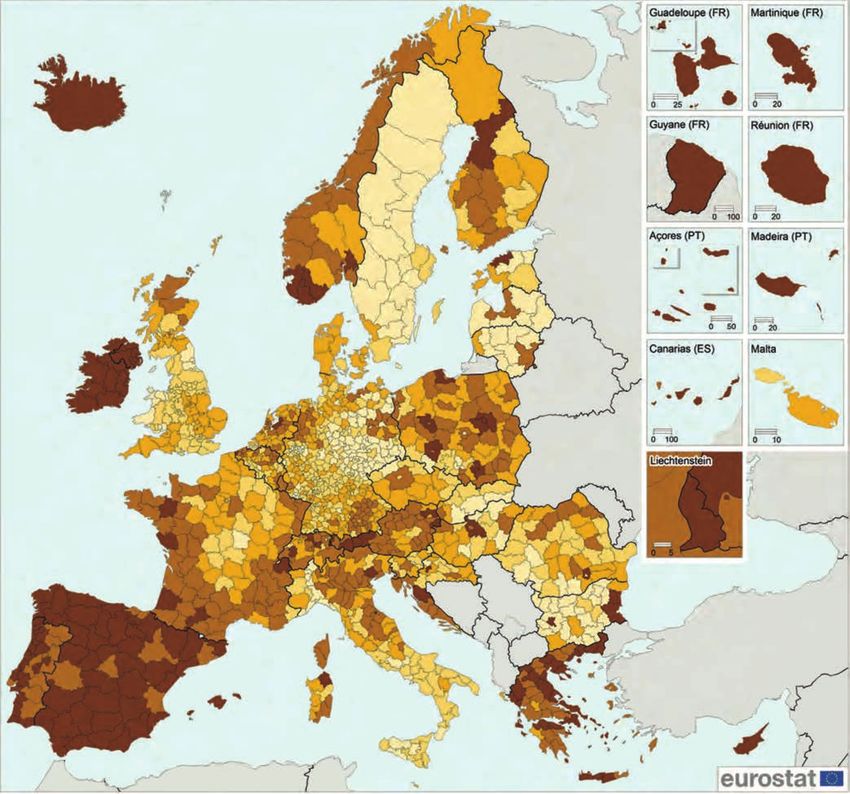
4                                                                                                                                                     The Housing Stock of The United Kingdom             The Housing Stock of The United Kingdom                                                                                                        5

                                                                                                                                                                                                                   1.2 A short history of UK national
                                                                                                                                                                                                                   housing surveys

    1. The need for statistics                                                                                                                                                                                     The first house condition survey in the world, using trained
                                                                                                                                                                                                                   inspectors to visit a representative sample of the national
                                                                                                                                                                                                                   housing stock, was undertaken in England and Wales in

    on the UK housing stock                                                                                                                                                                                        1967[2] . At the time, slum clearance was going ahead at
                                                                                                                                                                                                                   pace and new housebuilding was at a historical high. There
                                                                                                                                                                                                                   was a growing feeling that housing renewal should be
                                                                                                                                                                                                                   based on more robust evidence. A sub-committee of the
                                                                                                                                                                                                                   Central Housing Advisory Committee [3] recommended in its
                                                                                                                                                                                                                   1966 report: ‘Our older homes – a call for action’ that: “a
                                                                                                                                                                                                                   national survey, scientifically designed and carried out by
                                                                                                                                                                                                                   skilled investigators, was necessary to provide reliable data
                                                                                                                                                                                                                   on house condition”, and the survey was the outcome
    1.1 Introduction                                                                                                                                                                                               of this.

    There is a regular call for statistics on the UK housing stock,                                                                                                                                                The survey method was very simple and consisted of a
    usually to compare them with statistics of other European                                                                                                                                                      one-page form to be completed by specially trained Public
    or world nations. This is, however, not straightforward, as                                                                                                                                                    Health Inspectors, Figure 1.1. It was based on a sample of
    they have to be compiled from the four separate housing                                                                                                                                                        6,000 randomly selected homes across England and Wales.
    surveys of England, Scotland, Wales and Northern Ireland.                                                                                                                                                      The results were reported in Economic Trends in 1968 [4] .
    The four surveys do not use identical methodologies. They                                                                                                                                                      They showed that the condition of the housing stock in
    are undertaken over different timescales, with different                                                                                                                                                       England and Wales was worse than expected. There were
    sampling criteria and survey instruments. Even questions                                                                                                                                                       15.7 million homes in England and Wales in 1967. Some
    that appear similar are often subtly different. Scotland and                                                                                                                                                   40% of these were built before 1919; 25% lacked a basic
    Wales do not inspect vacant dwellings whereas England                                                                                                                                                          amenity (bath, wash hand basin, hot water); 19% lacked
    and Northern Ireland do.                                                                                                                                                                                       an indoor WC; 7% were in potential clearance areas; 5%
                                                                                                                                                                                                                   required repairs exceeding £1,000 (around £17,000 at 2017
    Nevertheless, key information which describes the housing                                                                                                                                                      costs, based on the RPI index, the most relevant index of
    stock of the four nations is comparable. All the surveys have                                                                                                                                                  those dating back to 1967).
    a common heritage, particularly the physical inspection,
    which is the focus for this report. The physical inspection                                                                                                                                                    The 1967 housing survey was very significant because
    methodology for the English Housing Survey (EHS), Welsh                                                                                                                                                        it provided the evidence base for future housing
    Housing Conditions Survey (WHCS) and Northern Ireland                                                                                                                                                          policies. These included the targeting of slum clearance
    House Condition Survey (NIHCS) is the same, with all three                                                                                                                                                     programmes, rather than the previous ‘scattergun’
    using the consistent surveyor briefing provided by BRE. The                                                                                                                                                    approach, and the identification of areas for grant-aided
    Scottish House Condition Survey (SHCS) methodology is                                                                                                                                                          improvement work. It also enabled limited resources
    based on that used by the other three nations prior                                                                                                                                                            for public expenditure on housing improvement to be
    to 1986.                                                                                                                                                                                                       distributed on a scientific basis.

    This report is a follow-up to the BRE Trust publication                                                                                                                                                        From then on, national housing surveys have been
    ‘Housing in the UK’ [1] which used data from the four national                                                                                                                                                 undertaken at regular intervals to monitor the condition
    housing surveys when they were last aligned in 2008.                                                                                                                                                           and performance of the housing stock and to develop
                                                                                                                                                                                                                   and target policies for its continued improvement. Wales
                                                                                                                                                                                                                   introduced its own individual survey (the Welsh House
                                                                                                                                                                                                                   Condition Survey 1968), following on from the alarming
                                                                                                                                                                                                                   results coming from the small Welsh sample of the 1967
                                                                                                                                                                                                                   survey of England and Wales. England followed with its
                                                                                                                                                                                                                   own individual survey in in 1971, Northern Ireland in 1974
                                                                                                                                                                                                                   and Scotland in 1991.

                                                                                                                                                                                                                   In 1976 a complementary interview survey was introduced
                                                                                                                                                                                                                   to the English House Condition Survey (EHCS) to collect
                                                                                                                                                                                                                   information on the people who lived in the English housing
                                                                                                                                                                                                                   stock. This trend was followed by the other UK nations.

                                                                                                                                                                                                                   By 2017 England and Scotland had a continuous combined
                                                                                                                                                                                                                   physical and interview housing survey which was reporting        Photos: Top: Demolition in Grove House Lane Leeds, Gill Demolition Ltd
                                                                                                                                                                                                                   annually, Wales had a continuous household interview             ©1967. Bottom: Two-bedroom Victorian terrace in Aston Birmingham, Nick
                                                                                                                                                                                                                   survey with an occasional physical inspection and Northern       Hedges © 1967
                                                                                                                                                                                                                   Ireland had a combined physical and interview survey every
    Photos: Housing in the UK, 2008 [1]                                                                                                                                                                            five years (with occasional interim survey). In 2017, England,
                                                                                                                                                                                                                   Scotland and Wales all had a physical survey in the field
    More recently, England, Wales and Scotland all had                                               noted, there are no contradictions between this UK report                                                     at the same time, for the first time since 2008. Northern
    national housing surveys in the field in 2017, and Northern                                      and individual national reports and that, if more detail is                                                   Ireland had completed their survey just one year earlier, in
    Ireland’s latest survey was in 2016, and each nation has                                         required, these can be obtained through the published                                                         2016. Figure 1.2 shows the frequency of these surveys
    published findings based on their own surveys. For ease of                                       national reports and referenced back to the UK picture.                                                       over time.
    presentation, in this report, the common date for statistics
    will be presented as ‘2017’ and it combines information                                          All four national surveys are National Statistics accredited.
    already published by these nations1. This ensures that, unless
    1Detailed cavity/solid wall insulation info has not been published for Wales. Detailed Northern Ireland wall insulation figures are based on a different method to that published in their reports.
The Housing Stock of The United Kingdom - Justine Piddington, Simon Nicol, Helen Garrett, Matthew Custard - BRE Group
6                                                    The Housing Stock of The United Kingdom   The Housing Stock of The United Kingdom                                                                                  7

    Figure 1.1: Example completed 1967 survey form                                             Figure 1.2 Timeline of UK national housing surveys

                                                                                                              Physical survey
                                                                                                              Interview survey
                                                                                                                                                                                England   Wales   Northern   Scotland
                                                                                                                                                                                                   Ireland
                                                                                                                                                                   19
                                                                                                                                      1967                            6   5
                                                                                                                                      First National House           19
                                                                                                                                                                        6   6
                                                                                                                                      Condition Survey
                                                                                                                                                                     19
                                                                                                           1968                       (England & Wales)                 6   7
                                                                                                                                                                     19
                                                                                                           First single nation                                          6   8
                                                                                                           survey (Wales)                                            19
                                                                                                                                                                        6
                                                                                                                                                                   19 9
                                                                                                                                                                     70
                                                                                                                                                                    19
                                                                                                                                                                       71
                                                                                                                                                                    19
                                                                                                                                                                       72
                                                                                                                                      1974                          19
                                                                                                                                                                       73
                                                                                                                                      First survey in Northern
                                                                                                                                                                    19
                                                                                                                                      Ireland (1 page)                 7
                                                                                                           1976                                                    1 4
                                                                                                                                                                    97
                                                                                                           5-year (big bang) survey                                   5
                                                                                                           cycle begins in England                                   19
                                                                                                                                                                        76
                                                                                                           (runs until 2001)                                         19
                                                                                                                                                                        77
                                                                                                                                                                     19
                                                                                                                                                                        78
                                                                                                                                                                     19
                                                                                                                                                                        79
                                                                                                                                                                   19
                                                                                                                                                                      8   0
                                                                                                                                                                     19
                                                                                                                                                                        81
                                                                                                                                                                     19
                                                                                                                                                                        82
                                                                                                                                                                     19
                                                                                                                                                                        83
                                                                                                                                      1986                           19
                                                                                                                                                                        84
                                                                                                                                      New physical survey          198
                                                                                                                                      methodology launched                5
                                                                                                                                                                     19
                                                                                                                                      (England and Wales)               8   6
                                                                                                                                                                     19
                                                                                                                                                                        8   7
                                                                                                                                      First interview survey         19
                                                                                                                                      in Wales                          8   8
                                                                                                           1991                                                      19
                                                                                                                                                                        8
                                                                                                           First national survey in                                19 9
                                                                                                                                                                     90
                                                                                                           Scotland (physical and
                                                                                                           interview)                                               19
                                                                                                                                                                       91
                                                                                                                                                                    19
                                                                                                                                                                       92
                                                                                                           First interview survey
                                                                                                                                                                    19
                                                                                                           in Northern Ireland                                         93
                                                                                                                                                                    19
                                                                                                                                                                       9
                                                                                                                                                                   1 4
                                                                                                                                                                    99
                                                                                                                                                                          5
                                                                                                                                                                     19
                                                                                                                                                                        96
                                                                                                                                                                     19
                                                                                                                                                                        97
                                                                                                                                                                     19
                                                                                                                                                                        98
                                                                                                                                                                     19
                                                                                                                                                                        99
                                                                                                                                                                   20
                                                                                                                                                                        00
                                                                                                                                      2002                           20
                                                                                                                                      EHCS moves to continuous.           01
                                                                                                                                      Two years data combined.       20
                                                                                                                                                                          02
                                                                                                           2004                       First results in 2003          20
                                                                                                                                                                          03
                                                                                                           Welsh household data                                      20
                                                                                                           collected via the Living                                       04
                                                                                                                                                                   20
                                                                                                           in Wales survey                                              05
                                                                                                                                              2006
                                                                                                                                                                     20
                                                                                                                                              SHCS moves               06
                                                                                                           2008                               to continuous         20
                                                                                                           EHCS combined                                               07
                                                                                                           with SEH to become                                       20
                                                                                                                                                                       08
                                                                                                           English Housing                                          20
                                                                                                           Survey (EHS)                                                0
                                                                                                                                      2012                         2 9
                                                                                                                                                                    01
                                                                                                                                      Welsh household data            0
                                                                                                                                      collected via the National     20
                                                                                                                                                                        11
                                                                                                                                      Survey for Wales (NSW)         20
                                                                                                                                                                        12
                                                                                                                                                                     20
                                                                                                                                      Scottish House Condition         13
                                                                                                                                      Survey combined into the       20
                                                                                                                                                                       14
                                                                                                                                      Scottish Household Survey    20
                                                                                                                                                                     15
                                                                                                           2017                                                      20
                                                                                                           Income and housing                                          16
                                                                                                           costs questions added to                                  20
                                                                                                                                                                        17
                                                                                                           the NSW to enable fuel                                    20
                                                                                                           poverty calculations                                        18
                                                                                                                                                                     20
                                                                                                                                                                        19
                                                                                                                                                                   20
                                                                                                                                                                        20
The Housing Stock of The United Kingdom - Justine Piddington, Simon Nicol, Helen Garrett, Matthew Custard - BRE Group
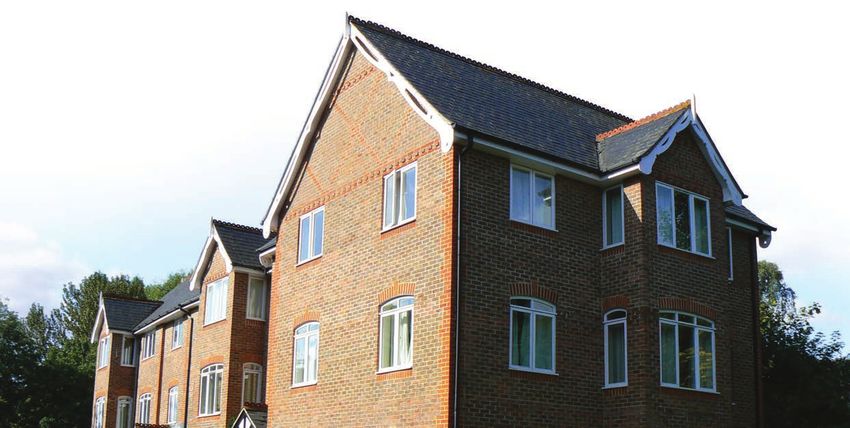
8                                                                                                        The Housing Stock of The United Kingdom    The Housing Stock of The United Kingdom                                                                                  9

                                                                                                                                                    Figure 1.3 Private sector improvement grants per 1,000 homes, England and Wales 1978-91

                                                                                                                                                             Old system grants per 1,000 dwellings

                                                                                                                                                                150 to 750
                                                                                                                                                                100 to 150
                                                                                                                                                                50 to 100
                                                                                                                                                                0 to 50

    Photo: Validating the digitised Scottish House Condition Survey form, 2017

    Technological developments                                           Policy uses of the national surveys
    While the survey methodologies have evolved slowly over              The purpose of these surveys has been to monitor housing supply,
    the years to ensure comparability of measurement with                conditions, energy performance and fuel poverty, and to direct
    both each other and what has gone before, improvements               policies towards continued improvement. The initial problems of
    in technology have been more dramatic. Data is now                   unfitness, disrepair and lack of basic amenities identified in the early
    collected in the field by surveyors using a paper/digital pen        surveys were targeted with substantial investment programmes in
    system in England, Scotland and Wales, while Northern                the 1970s and 1980s and have largely been eradicated [2] . During the
    Ireland uses tablet PCs. The technology has improved                 1980s, over £1 billion of public money per annum was being spent
    efficiency and data quality and speeded up the reporting             on Private Sector Renewal, based on the results of the UK national
    process. Headline results from all surveys are published             housing surveys [5] . Due to the serious problems identified through
    within a year of the end of the latest fieldwork period.             the surveys, Wales received a proportionately larger share of the
                                                                         available funding, Figure 1.3.

                                                                         The current policy focus is on increasing the supply and quality of
                                                                         housing, providing a safe and healthy home and improving energy
                                                                         efficiency (see Chapter 3). Reducing fuel poverty is also a policy
                                                                         target, although this is not covered in this report, which focuses on
                                                                         physical housing conditions.

                                                                                                                                                                                                                                   Source: Leather P. and Morrison T. 1997
The Housing Stock of The United Kingdom - Justine Piddington, Simon Nicol, Helen Garrett, Matthew Custard - BRE Group
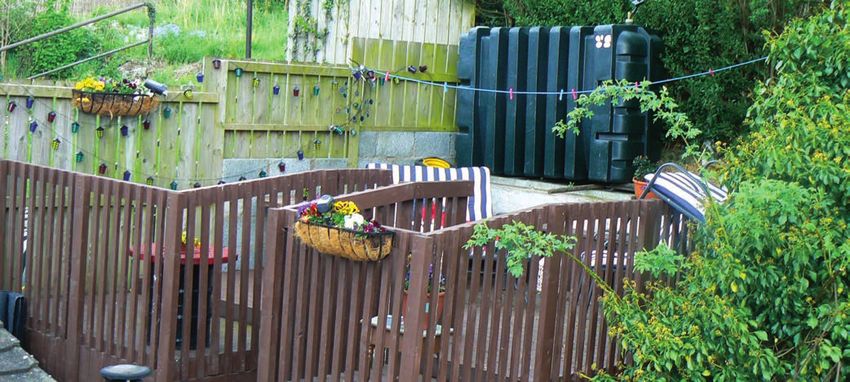
10                                                                                                 The Housing Stock of The United Kingdom   The Housing Stock of The United Kingdom                                           11

                                                                                                                                                      Figure 1.4 Internal repair and defects, page 3 from the 2017 SHCS form
     1.3 The current UK national housing survey models
     The current models for the UK national housing surveys, from which data are drawn for this study, are as follows:

       The English Housing Survey (EHS)

       The EHS has settled into a continuous survey consisting of:

       – A household questionnaire with an annual achieved sample of 13,300 interviews

       – A follow-up physical survey with an annual achieved sample of 6,200 inspections.

       For more detailed analysis, physical survey data is combined over two years to give a sample size of 12,400. For the purposes
       of this report the benchmark year is 2017, based on a combination of 2016-17 data and 2017-18 data.

       The survey form used by the surveyors is a development of that introduced in 1986, although now grown to some 23 pages
       in length.

       Full details of the EHS methodology are contained on the Ministry for Housing, Communities and Local Government
       (MHCLG) website.

       https://www.gov.uk/guidance/english-housing-survey-guidance-and-methodology

       The Scottish House Condition Survey (SHCS)

       Since 2003, the SHCS has been an annual continuous survey. The 2017 model consists of:

       – A household questionnaire with an annual achieved sample of 11,000 interviews (the Scottish Household Survey)

       – A follow-up physical survey with an annual achieved sample of 3,000 (the SHCS).

       Although key statistics are published using annual data, detailed analysis is based on a three-year sample of some 9,000
       homes.

       While much of the information collected is broadly comparable with England, Wales and Northern Ireland, the methodology
       is different, particularly around the collection and costing of repair and improvement work (Figure 1.4 and Figure 1.5). The
       full survey form contains 12 pages.

       Full details of the SHCS methodology are found on the Scottish Government website.

       https://www2.gov.scot/Topics/Statistics/SHCS/Downloads
The Housing Stock of The United Kingdom - Justine Piddington, Simon Nicol, Helen Garrett, Matthew Custard - BRE Group
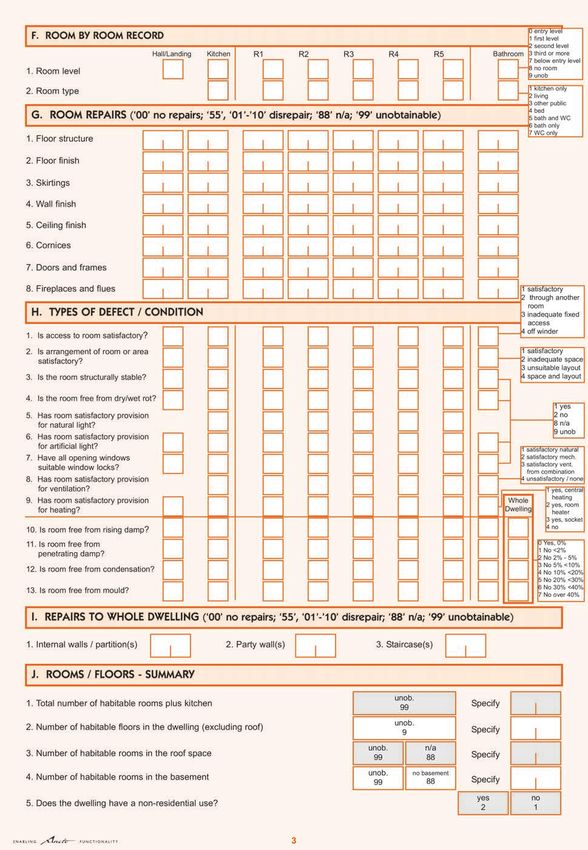
12                                                                                    The Housing Stock of The United Kingdom   The Housing Stock of The United Kingdom                                                                                                    13

     Figure 1.5 The same page (internal repair/defects) from the latest EHS, WHCS and NIHCS forms

                                                                                                                                            The Welsh Housing Conditions Survey (WHCS)

                                                                                                                                            The WHCS went into the field for the first time in nine years in 2017-18. The method used was the same as England but with
                                                                                                                                            additional information collected to inform the Welsh Housing Quality Standard and other Wales specific policy needs.
                                                                                                                                            The 2017-18 WHCS consisted of:

                                                                                                                                            – A household questionnaire with an annual achieved sample of 11,000 interviews (the National Survey of Wales)

                                                                                                                                            –	A one-off follow-up physical survey with a sample of 2,500 inspections.

                                                                                                                                            The survey is owned by the Welsh Government who published a headline report on the findings in December 2018. Further
                                                                                                                                            detailed reports have been produced throughout 2019 and are available from the Welsh Government website.

                                                                                                                                            https://gov.wales/welsh-housing-conditions-survey

                                                                                                                                            The Northern Ireland House Condition Survey (NIHCS)

                                                                                                                                            The NIHCS, undertaken by the Northern Ireland Housing Executive (NIHE), is not a continuous survey and is generally every
                                                                                                                                            five years (with two interim surveys in 2004 and 2009). The latest survey was in 2016, and the physical inspection component
                                                                                                                                            was similar to that in the EHS/WHCS (Figure 1.5).

                                                                                                                                            The survey consisted of 2,000 full inspections, including a five-page questionnaire with the household, undertaken by the
                                                                                                                                            surveyor, mid-way though the visit.

                                                                                                                                            Further details of the 2016 survey can be found on the Housing Executive website.

                                                                                                                                            https://www.nihe.gov.uk/Working-With-Us/Research/House-Condition-Survey

     EHS form 2017-18 Page 3                                      WHCS form 2017-18 Page 3

                                  NIHCS 2016 form Page 3
The Housing Stock of The United Kingdom - Justine Piddington, Simon Nicol, Helen Garrett, Matthew Custard - BRE Group
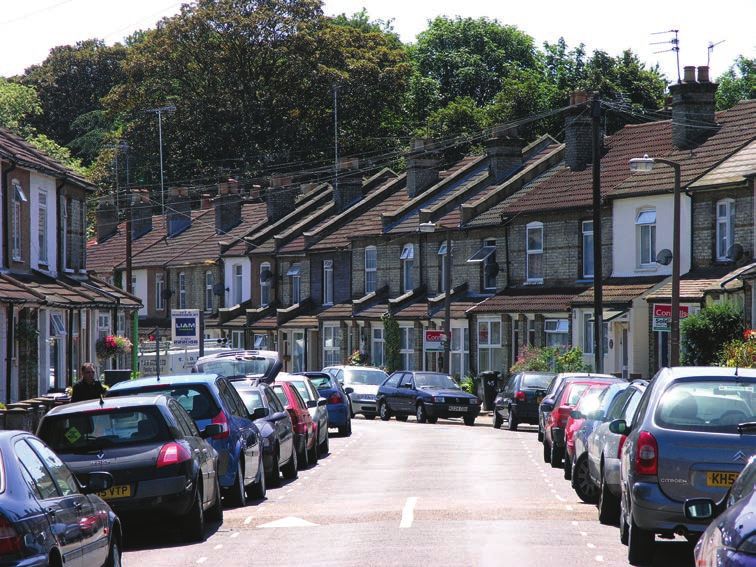
14                                                                                                                                           The Housing Stock of The United Kingdom   The Housing Stock of The United Kingdom                                                                    15

                                                                                                                                                                                                2.2 Age, type and size of dwellings
                                                                                                                                                                                                in the UK
                                                                                                                                                                                                The housing stock of the United Kingdom is very diverse,
                                                                                                                                                                                                representing a long history of housebuilding, local building
                                                                                                                                                                                                preferences and materials, and policy interventions [6] . Every

     2. The UK housing stock                                                                                                                                                                    dwelling type shown in Figure 2.2 is represented in each of
                                                                                                                                                                                                the four UK nations but in differing proportions, Table 2.2.

                                                                                                                                                                                                                         Figure 2.2. The age and type of UK housing

                                                                                                                                                                                                                                  Pre-1919                    1919-1944   1945-1964   Post-1964
     The data sources for the tables and figures for this report
     are English Housing Survey 2017, Welsh Housing Conditions
     Survey 2017-18, Northern Ireland House Condition Survey
                                                                                                2.1 Distribution and description of
     2016 and Scottish House Condition Survey 2017 (unless                                      housing in the UK
     otherwise stated). Although the most recent Northern                                                                                                                                         Terraced
     Ireland House Condition Survey took place in 2016, for                                     In 2017 there were some 28.5 million homes in the UK. The
     ease of presentation the common date for findings will                                     great majority of these were in England, Figure 2.1, reflecting the
     be presented as ‘2017’. The physical surveys of England                                    distribution of the UK population, Table 2.1.
     and Northern Ireland include vacant dwellings. These are
     not surveyed in Scotland or Wales and are not included in                                  Figure 2.1 Distribution of housing stock in the UK, 2017
     their housing stock totals. As this report references data
     that can be traced back to the four national survey reports                                                                                       5%
     we have not made any adjustment for vacant dwellings. A                                                                                  9%                                                  Semi-detached
     report by National Records of Scotland (NRS) 2 suggest that
     there were around 79,000 vacant dwellings in Scotland in                                                                           3%
     2017. In Wales, 18,000 were empty and unfurnished and a
     further 6,000 were vacant following death as reported by
     the Welsh Government.                                                                               England
                                                                                                         Northern Ireland
                                                                                                         Scotland
                                                                                                         Wales                                                                                    Detached
                                                                                                                                                               84%

     Table 2.1: Population and Households by nation, 2017

                                                                                                                                                   Northern                                       Bungalow
                                                                            England                  Scotland                   Wales                                    UK
                                                                                                                                                    Ireland1
       Total population (thousands) 2                                        55,619                    5,425                     3,125                1,871           66,040

       Total households (thousands) 3                                        23,272                    2,464                     1,350                 742             27,828

       Average household size                                                  2.39                     2.20                         2.31             2.52              2.37
                                                                                                                                                                                                  Converted flat
       Average number of persons per                                           2.43                     2.20                         2.33             2.49              2.41
       occupied dwelling

       Total population                                                      84.2%                      8.2%                     4.7%                 2.8%            100.0%

       Total households                                                      83.6%                      8.9%                     4.9%                 2.7%            100.0%

                                                                                                                                                                                                  Purpose built
                                                                                                                                                                                                  flat – low rise
        Notes:

        1. Data for Northern Ireland is based on 2016
        2.	2017 Population statistics are sourced from Office for National Statistics Population estimates for the UK, England and
           Wales, Scotland and Northern Ireland: mid-2018, Table 1
        3.	Household data is sourced from published national survey reports. Average household size and average number of persons                                                                Purpose built
           per occupied dwelling are derived from these sources.                                                                                                                                  flat – high rise

     2https://www.nrscotland.gov.uk/files/statistics/household-estimates/2017/house-est-17-publication.pdf
     3 https://gov.wales/sites/default/files/statistics-and-research/2019-01/council-tax-dwellings-financial-year-2017-to-2018.pdf
The Housing Stock of The United Kingdom - Justine Piddington, Simon Nicol, Helen Garrett, Matthew Custard - BRE Group
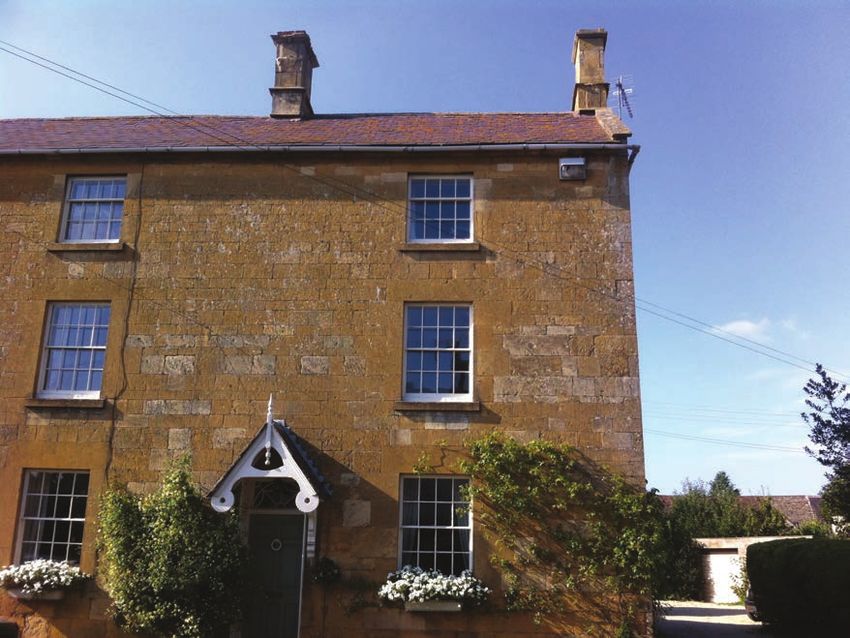
16                                                                                                       The Housing Stock of The United Kingdom     The Housing Stock of The United Kingdom                                                                                                                        17

     Table 2.2: The UK housing stock, by nation, 2017 (thousands of dwellings / %)                                                                              Dwelling age
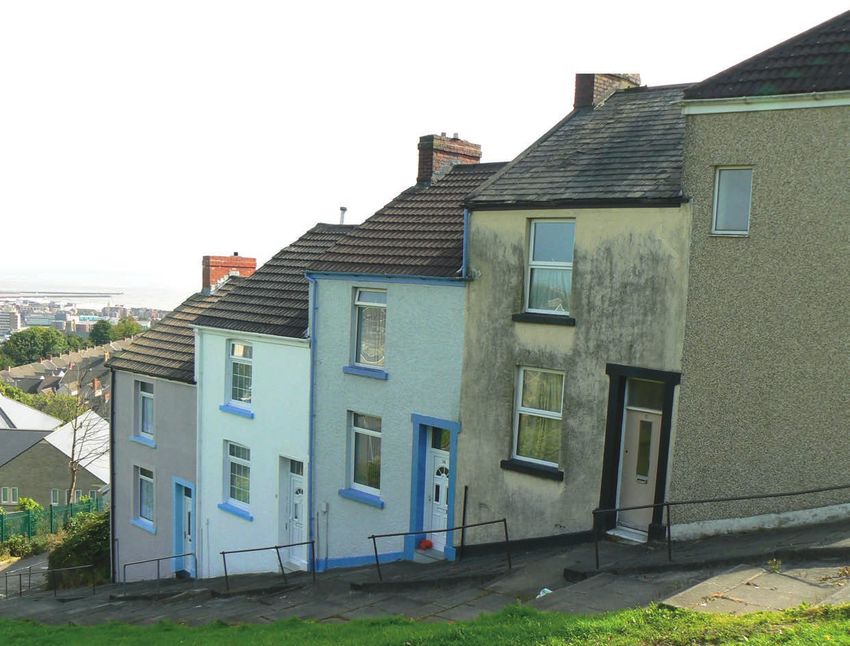
                                                                                                                Northern                                        While the housing of the four UK nations has
                                                     England           Scotland              Wales                                       UK                     developed in parallel, it is noticeable that Wales
                                                                                                                 Ireland1
                                                                                                                                                                has the oldest housing stock, with over one
      Dwelling age                                                                                                                                              quarter (26%) of homes being around 100
      Pre 1919                                        4,972                467                 351                 82                 5,871                     years old or more, Figure 2.3, while Northern
      1919-1944                                       3,793                291                 133                 68                 4,284                     Ireland has the most modern, with 40% of
      1945-1964                                       4,582                544                 219                 126                5,472                     homes being built since 1981. Wales’ older
                                                                                                                                                                housing stock is largely due to the legacy of
      1965-1980                                       4,689                515                 304                 189                5,698
                                                                                                                                                                terraced houses built for workers during its
      1981-1990 2                                     1,895                194 3                99                 99                 2,2874                    rapid nineteenth century industrialisation,
      Post 1990                                       4,019                4525                235                 216                4923 6                    based on the exploitation of the coalfields.
      Dwelling type
      Terrace                                         6,669                534                 376                 221                 7,829                                                                              Photo: Wales has the oldest housing stock in the UK, largely due to its legacy of pre 1919
                                                                                                                                                                                                                          terraced houses
      Semi-detached                                   6,100                481                 369                 180                 7,129
      Detached                                        4,093                554                 296                 164                 5,107
                                                                      inc. within other
                                                                                                                                                                Figure 2.3 Dwelling age by UK nations, 2017
      Bungalow                                        2,195              categories            154                 164                 2,512
      Flat                                            4,864                895                 147                  52                 5,958                              45
      Dwelling tenure                                                                                                                                                     40                     England   Northern Ireland     Scotland       Wales       All nations
      Owner occupied                                 15,089               1,491                924                 512                18,016
      Private rented                                  4,789                346                 180                 146                5,460                               35
      Social rented                                   4,072                626                 238                 122                5,058
                                                                                                                                                                          30
      Location   7

                                                                                                                                                             percentage
                                                                                                                                                                          25
      Urban                                           19,796              2,055                900                 503                23,254
      Rural                                            4,154               409                 441                 277                 5,281                              20
      Total dwelling stock                           23,950               2,464               1,342                780                28,536                              15
      Average dwelling size                           94m   2
                                                                          98m    2
                                                                                             102m    2
                                                                                                                  105m   2
                                                                                                                                       95m    2

                                                                                                                                                                          10
      Dwelling age
                                                                                                                                                                           5
      Pre 1919                                        20.8%              19.0%               26.2%                10.5%               20.6%
      1919-1944                                       15.8%              11.8%                9.9%                 8.7%               15.0%                                0
      1945-1964                                       19.1%              22.1%               16.3%                16.2%               19.2%                                           Pre 1919               1919-1944                  1945-1964                  1965-1980                    Post 1980
      1965-1980                                       19.6%              20.9%               22.7%                24.3%               20.0%                                                                                                                   (1965-82 for Scotland)     (Post 1982 for Scotland)
      1981-1990 2                                      7.9%               7.9% 3              7.4%                12.8%               8.0% 4                    Dwelling type
      Post 1990                                       16.8%              18.4% 5             17.5%                27.7%               17.3% 6
                                                                                                                                                                The UK housing stock is dominated by houses, with over half (52%) of homes being conjoined (built in terraces or in pairs) and just
      Dwelling type                                                                                                                                             under one fifth (18%) being detached. Just over a fifth (21%) of UK dwellings are flats, Table 2.2.
      Terrace                                         28.0%              21.7%               28.0%                28.3%               27.4%                     Within the UK, there are subtle differences between the housing stocks of the four nations. Scottish workers’ housing was
                                                                                                                                                                traditionally provided in tenements rather than terraces, and flatted accommodation still dominates in urban areas. Northern
      Semi-detached                                   25.5%              19.5%               27.5%                23.0%               25.0%                     Ireland has a much higher proportion of bungalows, Figure 2.4.
      Detached                                        17.1%              22.5%               22.1%                21.0%               17.9%
                                                                      inc. within other
      Bungalow                                         9.2%              categories          11.5%                21.0%               8.8%
                                                                                                                                                                Figure 2.4 Dwelling type by UK nations, 2017
      Flat                                            20.3%              36.3%               11.0%                 6.7%               20.9%
                                                                                                                                                                          40
      Dwelling tenure
      Owner occupied                                  63.0%              60.5%               68.9%                65.6%               63.1%                               35                     England   Northern Ireland     Scotland       Wales       All nations
      Private rented                                  20.0%              14.0%               13.4%                18.7%               19.1%
      Social rented                                   17.0%              25.4%               17.7%                15.6%               17.7%                               30
      Location   7

                                                                                                                                                                          25
      Urban                                           82.7%              83.4%               67.1%               64.0%                81.5%
      Rural                                           17.3%              16.6%               32.9%               36.0%                18.5%                  percentage
                                                                                                                                                                          20

                                                                                                                                                                          15
       Notes:                                                            6. P ost 1990 UK figures estimated as Scotland figures for
                                                                             1982-1990 are modelled                                                                       10
       1. Data for Northern Ireland is based on 2016                     7. Location statistics are based on different definitions. Wales use
       2. 1982-1990 for Scotland                                             an ONS definition, where an area is considered rural if it is outside                         5
       3. 1982-1990 figures modelled from post 1982 Scotland                of settlements with a population of more than 10,000. Scotland
           figures based on distributions in England, Wales and              use a definition based on settlement size and remoteness.
                                                                                                                                                                           0
           Northern Ireland                                                  England and Northern Ireland are based on surveyor judgement
                                                                                                                                                                                      terraced             semi-detached                 detached                   bungalow                        flat
       4. 1981-1990 UK figures estimated as Scotland figures for        8. D welling size = Internal floor area in square metres based
           1982-1990 are modelled                                            on the UK Building Regulations definition
       5. P ost 1990 figures modelled from post 1982 figures based      9. Scotland and Wales figures are for occupied stock only (England                              Note: Bungalows are included in terraced, semi-detached and detached house types for Scotland
           on distributions in England, Wales and Northern Ireland           and Northern Ireland figures include vacant dwellings)
The Housing Stock of The United Kingdom - Justine Piddington, Simon Nicol, Helen Garrett, Matthew Custard - BRE Group
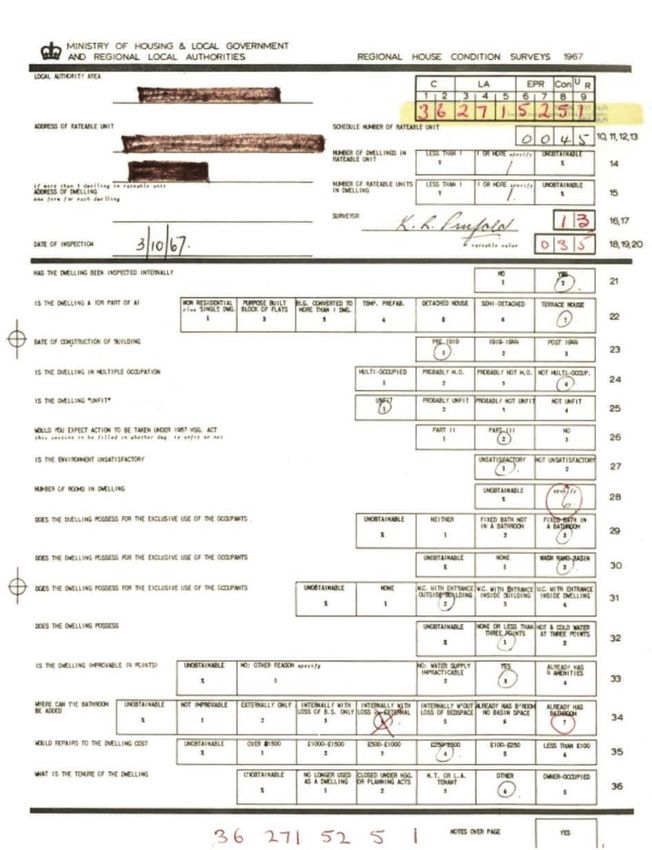
18                                                                                                   The Housing Stock of The United Kingdom   The Housing Stock of The United Kingdom                                                                                                           19

     Dwelling size                                                   Pre 1919 housing is generally located in the centre of our cities,                 Dwelling construction
     On average, homes in England are the smallest in the UK
                                                                     towns and villages, or in isolated rural situations. Nearly 70% of all
                                                                     homes in England built before 1850 are in rural locations. Housing                 The great majority of dwellings in the UK are built in the            2.4 Dwelling heating, insulation and
     (94m2), with dwellings in Northern Ireland (105m2) being        becomes increasingly modern, as it is located away from the centre                 ‘traditional’ way using brick, blockwork or stone and                 energy efficiency in the UK
     the largest (Table 2.2). One reason for this is the large       towards the suburbs [6] .                                                          constructed on site [6] . Prior to 1919 the walls would most
     proportion of flats (which tend to be smaller than houses)                                                                                         likely have been solid. Cavity walls gradually became                 Around eight in ten homes in the UK use a gas fired central heating
     in England compared with Northern Ireland.                                                                                                         the dominant form of wall construction in the inter-war               system as the primary method for heating. Among those not using
                                                                                                                                                        period with the transition taking place at different rates            this heating method, electric storage heaters or central heating
                                                                                                                                                        in different parts of the country. In recent years, there has         using oil were the most frequent types, Table 2.3. Northern Ireland
                                                                                                                                                        been a growing number of homes built with timber frames               has a distinctly different fuel mix from the rest of the UK due to an
     2.3 Dwelling tenure, location and                                                                                                                  supporting the roof structure, but finished to resemble               increased reliance on oil for domestic heat. (Figure 2.7).
                                                                                                                                                        traditional cavity walls, while larger blocks of flats tend to
     construction in the UK                                                                                                                             be built with concrete and steel frames.

     Dwelling tenure
     Some 63% of dwellings in the UK are owner-occupied.                                                                                                Figure 2.6 Dwelling construction by age (England 2013)
     The remainder are almost equally split across social rented,
     (18%) and private rented sectors (19%). Wales has the
     highest proportion of owner-occupied homes (69%),
                                                                                                                                                                Post 2002
     while Scotland has the highest proportion of social rented
     housing (25%). (Figure 2.5).
                                                                                                                                                               1981-2002
     Dwelling location                                                                                                                                         1965-1980
     Just over 80% (81%) of housing in the UK can be described
     as ‘urban’ while 19% is ‘rural’. This varies between the four                                                                                             1945-1964
     UK nations, with Wales and Northern Ireland being the
     most rural, Table 2.2.                                                                                                                                     1919-1944
                                                                     Photo: Tenement flats, Dundee
                                                                                                                                                                1900-1918

                                                                                                                                                               1850-1899
     Figure 2.5 UK dwellings by tenure, 2017
                                                                             Scotland                                                                             Pre 1850

                                                                                                                                                                              0                  20                   40                60                80                100
                Owner occupied                                               14%                                                                                                                                           percentage
                Local authority/Housing exec.                            10%
                                                                                                                                                                                  Timber Frame          Solid       Cavity Wall      Concrete, Steel
                                                                                    61%
                Housing association                                        15%
                Private rented                                                                                                                          Source: The age and type of English homes [6]

                                      Northern Ireland
                                                                                                                                                        Table 2.3: The UK housing stock, by type of heating, 2017 (thousands of dwellings / %)
                                          19%
                                       5%                                                                                                                                                                 England          Scotland          Wales        Northern            UK
                                                                                                                                                                                                                                                           Ireland
                                       11%       66%
                                                                                                        England                                             Gas central heating                            20,375            1,966           1,100             186         23,627
                                                                                                                                                            Oil central heating                             929               143             135              526          1,733
                                                                                                                                                            Other central heating                           716               105              35               61           917
                                                                                                       20%                                                  Electric (storage heaters)                     1,223              183              48              N/A           N/A
                                                                                                                                                            Fixed heating                                   707                67              23              N/A           N/A
                                                                           Wales                     10%
                                                                                                               63%
                                                                                                     7%
                                                                                                                                                            Gas central heating                             85.1%            79.8%           82.0%          23.8%          82.8%
                                                                         13%                                                                                Oil central heating                             3.9%             5.8%            10.1%          67.5%           6.1%
                                                                      11%                                                                                   Other central heating                           3.0%             4.3%             2.6%           7.8%           3.2%
                                                                      7%                                                                                    Electric (storage heaters)                       5.1%             7.4%            3.6%            N/A            N/A
                                                                                 69%
                                                                                                                                                            Fixed heating                                   3.0%              2.7%            1.7%            N/A            N/A

                                                                                                                                                          Note: Scotland usually categorise electric storage heaters as central heating but they are shown separately above to enable
                                                                                                                                                          UK comparison
20                                                                                                        The Housing Stock of The United Kingdom   The Housing Stock of The United Kingdom                                                                                                                                                                      21

                Figure 2.7: UK Heating profile
                                                                                                    Scotland                                                             Note: Northern Ireland figures differ from information published by NIHE on number of insulated cavity walls due to different
                                                                                                                                                                         approaches to categorisation of walls. For example, NIHE reports dwellings with more than one wall type as ‘partial cavity
                                                                                                14%7% 3%                                                                 wall insulation’ (where insulation exists) whereas for this analysis (in order to maintain consistency with other nations) each
                   Gas central heating                                                          4%
                                                                                                                                                                         dwelling has been assigned a single wall type according to the predominant wall type present.
                   Oil central heating                                                        6%

                   Other central heating
                                                                                                          80%
                   Electric storage heaters                                                                                                                            Energy efficiency                                                                       – Efficiency and control of the heating system;
                   Fixed room heaters (all fuels)                                                                                                                      The Standard Assessment Procedure (SAP) is the UK                                       –	Fuel used for space and water heating, ventilation and lighting;
                                                                                                                                                                       Government’s recommended system for measuring                                           – Ventilation and solar gain characteristics of the dwelling;
                                                                                                                                                                       the energy efficiency of housing. SAP is expressed on a
                                                        Northern Ireland                                                                                               logarithmic scale from 1 (very inefficient) to 100 (zero                                – Renewable energy technologies
                                                                                                                                                                       energy cost).
                                                               8%                                                                                                                                                                                              SAP is not affected by the individual characteristics of the household
                                                                     24%                                                                                               The SAP ratings provide a measure of the annual unit                                    occupying the dwelling, nor by its geographical location. The SAP
                                                                                                                                                                       energy cost of space and water heating for the dwelling                                 methodology is continually updated to reflect new technologies
                                                                                                                                                                       under a set heating regime, which assumes specific heating                              and knowledge. The version used in this report, for comparison
                                                             68%
                                                                                                                                England                                patterns and room temperatures. The SAP rating takes                                    purposes, is SAP 20124 .
                                                                                                                                5% 3%                                  into account a range of factors that contribute to energy
                                                                                                                           3%                                          efficiency, which include:                                                              From Figure 2.8, it can be estimated that the average UK SAP for
                                                                                                                         4%                                                                                                                                    2017 is approximately 62, which represents a rise of some 17 SAP
                                                                                                                                                                       – Thermal insulation of the building fabric;                                            points since 1996. Wales has the least energy efficient housing
                                                                                                                                                                                                                                                               stock, despite great improvements in recent years, reflecting its high
     Dwelling insulation                                                                         Wales                                                                 – Shape of the dwelling and exposed surfaces;                                           proportion of older, solid-walled buildings.
                                                                                                4%2%                                85%
     Fabric insulation is important in reducing greenhouse                                    3%                                                                       – The materials of construction;
     gas emissions from the housing stock as it acts to reduce
     demand for heat as well as delivering an improved level                                  10%
     of thermal comfort and contributing to affordability of
     warmth. Insulation levels in the UK have risen steadily over
                                                                                                      82%
     time, driven by building regulations for new build housing
     and the retrofit of the existing stock.                                                                                                                           Figure 2.8 Average SAP by UK nation (SAP 2012 time series)
     Cavity wall insulation is a common energy efficiency
     measure. The table below shows that Northern Ireland has                                                                                                     70
     the highest levels of insulated cavity walls in the stock at
     90% of cavity wall dwellings filled, with England and Wales                                                                                                  65                 England                  Northern Ireland                    Scotland                  Wales
     having the lowest penetration at 68%. Grant programmes
     and other schemes have had considerable success in driving                                                                                                   60
     the take-up of measures such as cavity wall insulation and
     while potential remains, future savings will have to be                                                                                                      55
     sought in other parts of the stock, such as the solid

                                                                                                                                                     SAP rating
     wall stock.                                                                                                                                                  50

                                                                                                                                                                  45
     Table 2.4: Wall insulation, 2017 (thousands of dwellings / %)
                                                                                                                                                                  40
                                                            England          Scotland            Wales          Northern
                                                                                                                 Ireland                                          35
                 Cavity insulated                            11,157            1,363                636            570
                                                                                                                                                                  30
                 Cavity uninsulated                           5,242             457                 298            66                                                  1996 1997 1998 1999 2000 2001 2002 2003 2004 2005 2006 2007 2008 2009 2010 2011 2012 2013 2014 2015 2016 2017
                 All cavity walls                            16,399            1,820                934            636                                                                                                                                        Year

                 Solid with insulation                         694              115                  71             11                                                 4The SAP2012 methodology varies slightly between nations; Following the release of version 9.93 of RdSAP 2012, U-values for solid brick, stone and cavity walls were updated to more
                                                                                                                                                                       accurately reflect their thermal performance. As a result of these changes, SAP2012 was modelled for the WHCS and NIHCS data using the updated U-values. Original U-values were used in
                 Solid uninsulated                            6,301             529                 307            107                                                 Scotland and England.
                 All solid walls                              6,996             644                 378            118

                                                                           included above
                 Other                                         555           in solid walls         30             26

                 Cavity insulated                             68%               75%               68%            90%
                 Cavity uninsulated                           32%               25%               32%             10%
                 All cavity walls                            100%              100%              100%            100%

                 Solid with insulation                        10%               18%               19%             9%
                 Solis uninsulated                           90%                82%               81%             91%
                 All solid walls                             100%              100%              100%            100%
22                                                                                                                                                     The Housing Stock of The United Kingdom   The Housing Stock of The United Kingdom                                                                                                                                 23

                                                                                                                                                                                                                                                                                                    The WHQS is made up of 42 individual element assessments.
                                                                                                                                                                                                          3.2 Wales                                                                                 However, it is only possible to assess 13 primary elements and 13
                                                                                                                                                                                                                                                                                                    secondary elements of the standard using the WHCS due to the
                                                                                                                                                                                                                                                                                                    survey’s methodology. This WHCS based measure is known as the
                                                                                                                                                                                                          Wales has the Welsh Housing Quality Standard (WHQS),                                      overall WHQS proxy and is only suitable for comparing WHQS across

                   3. Housing quality                                                                                                                                                                     introduced in 2002. It is the Welsh Government’s standard
                                                                                                                                                                                                          for social housing. Split into primary elements (ones that
                                                                                                                                                                                                          impact on the safety of the residents) and secondary
                                                                                                                                                                                                                                                                                                    tenures and with the Living in Wales 2008 Property Survey 2008
                                                                                                                                                                                                                                                                                                    measure. An overall WHQS modified proxy measure has also been
                                                                                                                                                                                                                                                                                                    calculated (using amended definitions of elements 4b and 4d of

                   and condition
                                                                                                                                                                                                          elements (more focussed around the comfort of the                                         WHQS) which is more in line with the way social landlords have been
                                                                                                                                                                                                          residents), it includes many components similar to the                                    advised to interpret the guidance in practice. Official Statistics on
                                                                                                                                                                                                          Decent Homes Standard (for example; “is the dwelling                                      WHQS produced by the Welsh Government based on returns from
                                                                                                                                                                                                          structurally stable and free from disrepair; is the heating                               social landlords should be used when looking at trends. The two
                                                                                                                                                                                                          system reasonably economical; are the bathroom amenities                                  data sets are not directly comparable.
                                                                                                                                                                                                          less than 25 years old and in good condition; is the staircase
                                                                                                                                                                                                          and balustrade safe?”). However, it goes beyond this to                                   In 2017, 17% of homes met the WHQS, as measured through
                                                                                                                                                                                                          include aspects of modern design, such as “is the cupboard                                the 2017-18 WHCS. Using the WHQS overall modified proxy as a
                   Each of the four UK nations has its own indicators of                                   –	Be in a reasonable state of repair                                                          storage convenient and adequate; is there paved access to                                 measure, this rose to 21%. This is a significant increase on 3% from
                   housing quality and condition.                                                                                                                                                         the drying area and any garden gate?”                                                     2008 and improvement has occurred in each tenure. The social
                                                                                                           –	Have reasonably modern facilities and services
                                                                                                                                                                                                                                                                                                    rented sector had a much higher proportion of dwellings meeting
                                                                                                           –	Provide a reasonable degree of thermal comfort                                              In 2004 the Housing Act introduced the Housing                                            the standard than private housing (Table 3.1), particularly those
                                                                                                                                                                                                          Health and Safety Rating System (HHSRS). Any                                              owned by Registered Social Landlords (34%). This reflects the
                   3.1 England                                                                             A full definition is included in the 2017 EHS Technical report 5.                              element categorised with an HHSRS Category 1 hazard                                       investment that the Welsh Government has made in the social sector
                                                                                                                                                                                                          automatically results in the dwelling ‘failing’ the WHQS.                                 to meet the standard.
                   England has the Decent Homes Standard. For a dwelling to                                The level of non-decency in England was 19% in 2017. This has
                   be considered ‘decent’ it must:                                                         improved from 35% in 2007. The Decent Homes Standard is
                                                                                                           designed to be applied to social housing and it is in this sector where
                   –	Meet the statutory minimum standard for housing                                      there are the lowest levels of non-decent homes (Figure 3.1).                                  Table 3.1. Wales: Dwellings that meet the overall WHQS proxy/modified proxy by tenure 2017
                      (assessed since 2006 using the Housing Health and
                      Safety Rating System (HHSRS))
                                                                                                                                                                                                                                                                                        Overall WHQS proxy 2017                     Overall WHQS modified proxy

                                                                                                                                                                                                            Owner-occupied                                                                               14%                                       15%

                                                                                                                                                                                                            Private rented                                                                               13%                                       19%
                   Figure 3.1: England: Decent Homes Standard by tenure 2007-17
                                                                                                                                                                                                            Social rented                                                                                31%                                       46%
              50
                                                                                                                                                                                                              • Local Authority                                                                          27%                                       40%
                                                                   Private rented                  Owner occupied                     Social rented
              45
                                                                                                                                                                                                              • Registered Social Landlord                                                               34%                                       49%
              40
                                                                                                                                                                                                            All tenures                                                                                  17%                                       21%
              35

              30                                                                                                                                                                                          Source: Statistics for Wales: Statistical bulletin SB 13/2019
 percentage

              25

              20
                                                                                                                                                                                                                                                                                                    –	It is free from dampness prejudicial to the health of the occupants
              15
                                                                                                                                                                                                          3.3 Northern Ireland                                                                         (if any)
              10                                                                                                                                                                                                                                                                                    –	It has adequate provision for heating, lighting and ventilation
              5                                                                                                                                                                                           Northern Ireland has the Decent Homes Standard, but                                       –	It has an adequate supply of wholesome water
                                                                                                                                                                                                          it differs from England in that the ‘minimum standard’
              0                                                                                                                                                                                           component is still the Fitness Standard, which applied                                    –	There are satisfactory facilities in the home for the preparation and
                    2007          2008         2009        2010         2011        2012        2013         2014        2015        2016        2017                                                     in England and Wales prior to 2006, and not HHSRS.                                           cooking of food, including a sink with a satisfactory supply of hot
                                                                                                                                                                                                          However, HHSRS is measured separately to enable                                              and cold water
                                                                                                                                                                                                          comparisons with England and Wales.
                   Source: English Housing Survey 2017-18 Headline Report. MHCLG London.                                                                                                                                                                                                            –	It has, for the exclusive use of the occupants (if any), a suitably
                                                                                                                                                                                                                                                                                                       located fixed bath or shower and wash-hand basin, each of which
                                                                                                                                                                                                          The current Northern Ireland Fitness Standard states that a
                   5 MHCLG,   English Housing Survey technical advice can be found at https://www.gov.uk/government/collections/english-housing-survey-technical-advice                                                                                                                                is provided with a satisfactory supply of hot and cold water
                                                                                                                                                                                                          dwelling is unfit for human habitation if it fails to meet one
                                                                                                                                                                                                          or more of the following requirements:                                                    –	It has an effective system of foul, waste and surface water

                                                                                                                                                                                                          –	It is structurally stable                                                              In the 2016 NIHCS, 7.8% 6 of dwellings failed decent homes (down
                                                                                                                                                                                                                                                                                                    from 11.4% in 2011). The level of unfitness reported was 2.1%, an
                                                                                                                                                                                                          –	It is free from serious disrepair
                                                                                                                                                                                                                                                                                                    improvement from 4.6% in 20117.

                                                                                                                                                                                                          6 From   Northern Ireland House Condition Survey Main Report 2016, Table 6.2
                                                                                                                                                                                                          7From    Northern Ireland House Condition Survey Main Report 2016 Appendix Tables, Table 5.1
24                                                                                                                           The Housing Stock of The United Kingdom   The Housing Stock of The United Kingdom                                                                                                                                          25

                                                                                                                                                                                Table 3.2: The 29 HHSRS hazards
     3.4 Scotland
     Scotland has the Scottish Housing Quality Standard (SHQS).
                                                                                                                                                                                                     Physiological Requirements                                                 Protection Against Infection
     The SHQS is made up of 55 elements grouped into 5 higher                                                                                                                                        Damp and mould growth etc.                                                 Domestic hygiene, pests and refuse
     level criteria:
                                                                                                                                                                                                     Excessive cold                                                             Food safety
     A. Tolerable Standard                                                                                                                                                                           Excessive heat                                                             Personal hygiene, sanitation and drainage
     B. Serious Disrepair                                                                                                                                                                            Asbestos etc                                                               Water supply
     C. Energy Efficiency                                                                                                                                                                            Biocides
     D. Modern Facilities and Services                                                                                                                                                               CO and fuel combustion productions                                         Protection Against Accidents
     E. Healthy, Safe and Secure                                                                                                                                                                     Lead                                                                       Falls associated with baths etc.
                                                                                                                                                                                                     Radiation                                                                  Falling on level surfaces
     Only social sector landlords are obliged to ensure their
     tenants’ homes meet the standard, but enough information                                                                                                                                        Un-combusted fuel gas                                                      Falling on stairs and steps
     is collected to derive failure rate across all tenures.
                                                                                                                                                                                                     Volatile organic compounds                                                 Falling between levels
     In 2017, 40% of all occupied dwellings failed to meet the                                                                                                                                                                                                                  Electrical hazards
     SHQS, an improvement on the 61% in 2010. The highest
                                                                                                                                                                                                     Psychological Requirements                                                 Fire
     failure rate was with respect to the Energy Efficient criterion
     (30%), followed by Healthy, Safe and Secure (10%) and                                                                                                                                           Crowding and Space                                                         Flames, hot surfaces etc.
     Modern Facilities criteria (7%). There were a very small
                                                                                                                                                                                                     Entry by intruders                                                         Collision and entrapment
     number of dwellings that did not meet the Tolerable
     Standard (1%) or the Serious Disrepair Criterion (less                                                                                                                                          Lighting                                                                   Explosions
     than 1%) 8 .
                                                                                                                                                                                                     Noise                                                                      Position and operability of amenities etc.
                                                                                                                                                                                                                                                                                Structural collapse and falling elements

     3.5 Disrepair
     All of the four surveys measure disrepair. The current NIHCS                                                                                                               Further details on the HHSRS and the methodologies                                                  with stairs, and excess cold. Around 1.7 million (7%) dwellings had
     2016 main report 9 and previous published EHS reports                                                                                                                      used to assess hazards, including rating their severity, are                                        one or more Category 1 hazard relating to falls11, 898,000 (3%)
     show that date of original construction is a critical factor                                                                                                               available within the technical information supplied by each                                         dwellings had a Category 1 excess cold hazard.
     when it comes to the state of repair. Also, homes located                                                                                                                  national housing conditions survey as already referenced
     in the private sector and vacant homes also tend to have                                                                                                                   and further details of the HHSRS system can be found on                                             Overall, Category 1 hazards were at least twice as likely to arise in
     higher levels of disrepair, partly due to these tenures having                                                                                                             the MHCLG web site10. Illustrations of Category 1 hazards                                           the private sector (owner occupied 12%, private rented 14%) than
     an older housing stock.                                                                                                                                                    are provided below.                                                                                 among social homes (6%).

                                                                                                                                                                                Overall 11% of the housing stock in England, Wales and                                              There was also a strong relationship between the prevalence of
                                                                                                                                                                                Northern Ireland had at least one of the most serious                                               hazards and dwelling age with pre 1919 built homes having almost
     3.6 Housing Health and Safety                                                        Photos: Older homes are more likely to be in disrepair
                                                                                                                                                                                (Category 1) class of hazard. The most common hazards                                               nine times (26%) the proportion of Category 1 hazards compared
                                                                                                                                                                                are those associated with falls, particularly those associated                                      with the newest homes built after 1980 (3%) as shown in Figure 3.2.
     Rating System (HHSRS)
     The most comparable measure of poor housing is the                                   The HHSRS provides a means of rating the seriousness of any hazard
     Housing Health and Safety Rating System which was                                    in the home so that it is possible to differentiate between minor
     introduced in England and Wales as the minimum standard                              hazards and those where there is a more immediate risk of serious
     for housing in 2006 [7] . It is an evidence-based system                             harm or even death. The most serious hazards are called Category 1
     used to identify and assess defects in dwellings and to                              hazards. The assessment of hazards through the surveys in England,
     evaluate the potential effects of these on the health and                            Wales and Northern Ireland provides an indication of the condition
     safety of occupants, visitors, neighbours and passers-by.                            and quality of the housing stock.
     It is also measured through the NIHCS using the same
     methodologies as England and Wales (although it is not                               The HHSRS identifies and scores 29 potential hazards in the housing
     part of legislation in Northern Ireland). It is not applied in                       stock, which fall into four groups, Table 3.2.
     Scotland, nor measured through the SHCS.

                                                                                                                                                                                                Photo: Falls on stairs and steps hazard                                               Photo: Flames, hot surfaces hazard as cooker too
                                                                                                                                                                                                                                                                                      close to doorway
     8 From   Scottish House Condition Survey: 2017 Tables and Figures, Table 49                                                                                                10 https://www.gov.uk/government/collections/english-housing-survey-technical-advice
     9 https://www.gov.uk/government/statistics/northern-ireland-house-condition-survey-2016-main-report                                                                        11The   four types of falls assessed by the surveys are; falls associated with stairs, falls on the level, falls between levels and falls associated with baths
26                                                                                                                              The Housing Stock of The United Kingdom   The Housing Stock of The United Kingdom                                                                                                             27

       Figure 3.2 Proportion of dwellings with HHSRS Category 1 hazards in England,                                                                                                Figure 3.4 Proportion of dwellings with HHSRS Category 1 hazards by tenure
       Northern Ireland and Wales, by dwelling age                                                                                                                                 and nation

                                                                                                                                                                                                25
                  Pre 1919
                                                                                                                                                                                                                                                                   England
                                                                                                                                                                                                20                                                                 Northern Ireland
      1919-1944
                                                                                                                                                                                                                                                                   Wales
                                                                                                                                                                                                15

                                                                                                                                                                                  percentage
      1945-1964

                                                                                                                                                                                                10
      1965-1980

                                                                                                                                                                                                5
         Post 1980

                             0            5                10               15               20                 25         30                                                                   0
                                                                      percentage                                                                                                                     owner occupied               private rented                  social rented

                                                                                                The reasons for these national variations are complex in nature,                   Figure 3.5. HHSRS Category 1 hazards in 2008 and 2017                              Significant progress has been made in the reduction in
       3.7 National variations                                                                  with interactions between different key stock characteristics
                                                                                                such as dwelling type and age, and other factors such as climate
                                                                                                                                                                                   by nation                                                                          HHSRS Category 1 hazards since the last time comparable
                                                                                                                                                                                                                                                                      information between the three nations was available in
       The prevalence of Category 1 hazards within each nations’                                and topography all likely contributors. For example, the higher                                 35                                                                    2008 (Figure 3.5). We should, however, note that the
       dwelling stock varied. Wales had the highest proportion                                  prevalence of falls and excess cold hazards in Wales is mainly due                                          England       Northern Ireland        Wales
                                                                                                                                                                                                                                                                      HHSRS was still a relatively new means of assessing housing
       of the most serious hazards (18%) compared with England                                  to its older dwelling stock which tends to have steep staircases and                                                                                                  quality in 2008 and likely to have lead to greater surveyor
                                                                                                outside spaces as well as lower average energy efficiency.                                      30                                                                    variability in the assessment of HHSRS hazards at the time.
       (11%) and Northern Ireland (9%). There were also national
       variations in the prevalence of falls hazards and excess                                                                                                                                                                                                       In addition, the modelling of excess cold has changed over
       cold12, Figure 3.3.                                                                                                                                                                      25                                                                    time following changes to the SAP methodology, which
                                                                                                                                                                                                                                                                      underpins the model.

                                                                                                                                                                                   percentage
                                                                                                                                                                                                20

       Figure 3.3 Proportion of dwellings with HHSRS Category 1 hazards by type of                                                                                                              15
       hazard and nation
                                                                                                                                                                                                10
                  20
                  18                                                       England           Northern Ireland          Wales                                                                     5
                  16
                                                                                                                                                                                                 0
                  14                                                                                                                                                                                     2008                           2017
                  12
     percentage

                  10
                    8
                    6
                    4
                    2
                    0
                             any Category 1                     any Category 1                           excess cold
                                hazards                          falls hazards

       The prevalence of Category 1 hazards by dwelling age and                                 It also needs to be born in mind that the sample sizes in Wales and
       dwelling type also varied nationally, Table 3.3. For example,                            particularly Northern Ireland are relatively small compared with
       a higher proportion of homes built before 1919 in Wales                                  England, so comparisons need to be treated with some caution.
       (34%) had Category 1 hazards compared with those of the
       same age in Northern Ireland (27%) and England (26%).                                    Variations in Category 1 hazards by tenure are shown in Figure 3.4.
       As with findings for the whole stock, such differences are                               England and Wales had a notably higher incidence of Category 1
       partly reflective of factors such as climate and topography.                             hazards among private rented dwellings.

        12The SAP2012 methodology used to model excess cold varies slightly between nations. It was modelled

        for Wales and Northern Ireland using updated U-values whereas original U-values were used in England.                                                                      Photo: Where housing is off the gas grid, expensive oil is typically used for heating
28                                                                                                      The Housing Stock of The United Kingdom     The Housing Stock of The United Kingdom                                                                                                        29

     Table 3.3: HHSRS Category 1 hazards in England, Wales and Northern Ireland                                                                              Table 3.4: Comparison between the housing conditions of England, Wales and Northern Ireland
     by dwelling age, dwelling type and tenure
                                                                                                                                                                                                         England              Wales       Northern       England, Wales and
                                                                                 Northern                                                                                                                                                  Ireland        Northern Ireland
                HHSRS Category 1                 England            Wales
                                                                                  Ireland                                                                      % poor condition
                                                                                                                                                                                                           11%                18%            9%                  11%
      Construction date                                                                                                                                        (HHSRS Category1)
      Pre 1919                                      26%             34%             27%
      1919-1944                                     12%             21%             17%                                                                        Total cost of mitigation
                                                                                                                                                                                                        £10,072m           £584m           £305m              £10,961m
      1945-1964                                     8%              14%             10%                                                                        works per annum
      1965-2017                                      5%             9%               5%
                                                                                                                                                               Annual treatment cost to
                                                                                                                                                                                                         £1,413m              £95m          £40m               £1,548m
      Dwelling type                                                                                                                                            NHS per annum
      Terraced house                                13%             22%              6%
      Semi-detached                                 11%             14%              7%                                                                        Full annual health cost of poor
                                                                                                                                                                                                        £18,667m         £1,031m           £401m              £20,099m
      Detached                                      12%             21%             13%                                                                        housing per annum
      Flat                                          8%              9%               6%

      Tenure                                                                                                                                                   Note: Reference dates are England 2015, Wales 2017-18, Northern Ireland 2016.
      Owner occupied                                11%             19%             10%
      Private rented                                14%             24%              9%
      Social rented                                  6%              7%              4%                                                                      Recent estimates for the UK [8] suggest that the annual treatment costs to the NHS of people living in poor housing are in the same
                                                                                                                                                             broad region as that from smoking or alcohol (Table 3.5).
      Location
      Urban                                         13%             15%              7%                                                                      Table 3.5: UK treatment cost burden estimates to the NHS for selected hazards
      Rural                                         18%             24%             13%
      All dwellings                                 11%             18%             9%                                                                         Risk Factor                                            Total cost burden estimates to the NHS

                                                                                                                                                               Physical inactivity                                    £0.9-£1.0 billion

       Notes:                                                                                                                                                  Overweight and obesity                                 £5.1-£5.2 billion

       1.	In order to be consistent national data already published, bungalows are incorporated into the four dwelling type categories
          above for Wales and Northern Ireland but are excluded from these categories for England.                                                             Smoking                                                £2.3-£3.3 billion

       2.	Location statistics are based on different definitions. Wales use an ONS definition, where an area is considered rural if it
                                                                                                                                                               Alcohol intake                                         £3.0-£3.2 billion
          is outside of settlements with a population of more than 10,000. Scotland use a definition based on settlement size and
          remoteness. England and Northern Ireland are based on surveyor judgement.
                                                                                                                                                               Poor housing                                           £1.5-£2.5 billion

                                                                      –	Average NHS costs (Table 3.4) for HHSRS Category 1 hazards are                        Note: £1.5bn is the latest poor housing figure for England, Wales and Northern Ireland using the same HHSRS based method.
                                                                                                                                                               The £2.5bn figure is an extrapolation for the whole of the UK, which includes Category 2 (significantly worse than average for
     3.8 The cost of poor housing                                        applied to the likelihoods and outcomes.
                                                                                                                                                               the type of dwelling), as well as Category 1 (severe) HHSRS hazards, and assumes that Scotland will have similar hazards to the
                                                                      –	A total NHS cost for each dwelling is calculated and summed for                       rest of the UK.
     There is a long established, recognised relationship                the total housing stock.
     between poor housing and poor health. The methodology
     developed by the BRE Trust [8] is perhaps the most rigorous      –	Costs are taken from the surveys’ ‘cost to make healthy and safe’
                                                                         model to reduce the hazard to an acceptable level (at least the                                                                                        both fatal and non-fatal injuries. These costs include human impacts
     attempt to measure the cost of this to the National Health
     Service (NHS) and to society. The latest methodology for            average for the dwelling age and type).                                             3.9 The full cost of poor housing                                  (pain, grief and suffering), indirect economic impacts, as well as
                                                                                                                                                                                                                                direct medical costs. TRL have also conducted research for the Royal
     producing these estimates is documented in ‘The full cost                                                                                                                                                                  Society for the Prevention of Accidents (RoSPA) to value the impact
     of poor housing’ publication and will not be repeated here.      The ‘cost of poor housing’ has been measured separately for                            The BRE Trust ‘cost of poor housing’ methodology focuses
                                                                      England [8] Wales [9] and Northern Ireland [10] and published in individual            on first year treatment costs to the NHS because there is          of home accidents using these costs.
     In summary, however, for each of the surveys of England,
     Wales and Northern Ireland in which the HHSRS                    reports. Data from these reports are aggregated in Table 3.4 to                        comprehensive data available on this which can be linked
     is measured:                                                     provide the total cost of poor housing across these three nations                      directly to the way we measure hazards in the home in the
                                                                      (the HHSRS is not measured in Scotland). The results are not directly                  housing surveys of England, Wales and Northern Ireland.            	Using this approach, it is estimated that the total cost to
                                                                      comparable with those quoted in the 2008 ‘Housing in the UK’                           However, these first-year treatment costs are just part of           society of poor housing in England, Wales and Northern
     –	‘Poor housing’ is defined as that which contains at least                                                                                                                                                                 Ireland is some £20 billion per annum (Table 3.4). This
        one HHSRS Category 1 hazard.                                  report, which used an earlier version of the methodology, nor with                     the cost to society.
                                                                      the HHSRS Category 1 figures for England in Figure 3.5, above, as                                                                                           suggests that the annual treatment costs to the NHS is
     –	The percentage likelihood and spread of HHSRS                 they relate to 2015 rather than 2017.                                                  For many hazards there may be ongoing treatment beyond               around 7.7% of the societal costs of all poor housing in
        outcomes for each hazard is modelled.                                                                                                                the first year. There may be care costs, sometimes for               these countries.
                                                                                                                                                             the rest of the victim’s lifetime. There could be a loss of
                                                                                                                                                             economic potential (poorer educational achievement, loss
                                                                                                                                                             of working days and career prospects). There will also be          Wales has the highest proportion of poor housing among the
                                                                                                                                                             the mental health cost of suffering and trauma.                    UK nations, due largely to its older housing stock (Table 3.4).
                                                                                                                                                                                                                                Consequently, it has a very high burden on the Welsh NHS for the
                                                                                                                                                             The ‘full cost of poor housing’ [8] concluded that the best        treatment of housing related illnesses and accidents. Figure 3.6
                                                                                                                                                             way to assess the total cost to society is to use a tried-and-     shows an example, using data from the WHCS 2017-18, of how
                                                                                                                                                             tested formula, such as the one developed by the Transport         a small intervention to improve poor housing can have
                                                                                                                                                             Research Laboratory (TRL) [20] , which evaluates the costs of      multiple benefits.
30                                                                                     The Housing Stock of The United Kingdom   The Housing Stock of The United Kingdom                                                                                                         31

     Figure 3.6: Case study example of the cost-benefits of housing improvement

                                        This example from Wales [9] shows the impact of poor housing on one household

                                                                                                                                          4. Comparisons between
                                        and some of the cost-benefits of improving the home.

                                        This pre 1919 terraced house is occupied by a vulnerable older owner whose
                                        only income is the state pension. The home has been partially improved over
                                        the years but is still too expensive for the occupant to heat effectively. It
                                        represents a HHSRS Category 1 excess cold hazard and the household is in
                                         fuel poverty.
                                                                                                                                          the UK and other nations
                                        A modest range of energy improvements is suggested to bring this home up
                                        to the average energy efficiency for the age and type of the dwelling. If the
                                        household takes advantage of the heating improvements, the HHSRS cold risk
                                        will be minimised and the household will be taken out of fuel poverty.                            Unlike the UK, no other country in the world has a

                                        The chances of the occupant ending up in hospital requiring treatment will be
                                                                                                                                          continuous series of housing surveys based on inspections
                                                                                                                                          by trained professionals, through which housing condition
                                                                                                                                                                                                             4.1 Comparisons with the European
                                        reduced substantially.                                                                            and performance is monitored over time. However, other             Union
                                                                                                                                          counties do have censuses, social surveys and statistical
                                        If the improvement scheme was to include full insulation to the solid walls                       returns from which housing profiles can be constructed.
                                        and floors, plus solar water heating, the costs of improvement would go up to                                                                                        Table 4.1 shows that the UK has the highest proportion of all EU
                                                                                                                                          These are, very usefully, compiled by organisations such
                                        £23,766 but with no additional health benefits over the basic modelled energy                                                                                        nations with homes dating back to before the Second World War, at
                                                                                                                                          as the United Nations, the European Union, World Health
                                        improvements. However, there would be additional fuel cost and carbon                                                                                                around 38% in 2017. The second highest is Belgium. At the other end
                                                                                                                                          Organisation (WHO), EUROSTAT.
                                        emission savings.                                                                                                                                                    of the scale Cyprus has only 3% of homes dating back to this period.
                                                                                                                                                                                                             As Wales has the oldest housing stock in the UK, it might also be said
                                                                                                                                          The following profiles are based on this information rather
                                                                                                                                                                                                             to have the oldest housing stock in Europe.
                                                                                                                                          than individual housing surveys.

                                         Pre-improvement                    Post-improvement                                              Table 4.1. Dwelling age by EU nation (%)

                                                                                                                                                                                                                                            At the other end of the scale, looking
       Walls                             Solid, uninsulated                 Not improved                                                     EU member state                Pre 1946       1946-1980        1980-2000      Post 2000        at homes built since 2000, we can
                                                                                                                                             UK                               37.8             39.7             15.6           6.9          see that it is the southern European
       Ground floor                      Solid, uninsulated                 Not improved                                                                                                                                                    countries: Cyprus; Spain; Portugal;
                                                                                                                                             Belgium                          37.1             38.2             16.5          8.2           Greece, plus Ireland that lead in new
                                                                                                                                             Denmark                          34.1             44.6             14.0           7.2          house building.
       Loft insulation                   50mm                               Topped up to 270mm
                                                                                                                                             France                           28.7             37.0             23.9          10.4
       Double-glazing                    Partial                            Full                                                             Austria                          25.5             40.1             22.7          11.7
                                                                                                                                             Germany                          24.3             46.5             23.1           6.1
       Space heating                     Gas fire with back boiler          Condensing boiler                                                Sweden                           24.3             47.7             12.3           4.6
                                                                                                                                             Latvia                           22.7             46.6             24.3           5.1
       Heating controls                  Boiler controls only               Room thermostat, programmer and TRVs                             EU28                             22.3             44.1             22.1           9.8
                                                                                                                                             Luxembourg                       21.8             31.5             21.6          14.0
       Hot water cylinder                Un-insulated, no thermostat        80mm jacket and thermostat fitted
                                                                                                                                             Slovenia                         21.3             45.0             25.0           8.7
                                                                                                                                             Italy                            20.7             51.4             19.8           7.9
       Low energy lights                 Partial                            Full
                                                                                                                                             Hungary                          20.3             48.3             21.7           9.7
       Solar water heating               No                                 No                                                               Poland                           19.1             43.0             22.7          11.4
                                                                                                                                             Czech Republic                   19.0             37.1             20.5           7.7
       Cost of upgrade (WHCS)            £0                                 £4,766                                                           Netherlands                      18.9             41.9             26.4           9.5
                                                                                                                                             Estonia                          17.0             47.0             22.8           9.4
       Energy efficiency (SAP)           21                                 57                                                               Croatia                          13.6             42.5             23.6          11.0
                                                                                                                                             Lithuania                        13.5             49.6             28.9          6.2
       Annual fuel cost                  £1,770                             £895
                                                                                                                                             Ireland                          13.3             22.9             20.7          22.0
                                                                                                                                             Malta                            13.0             23.2             23.4           8.7
       Household in fuel poverty         Yes                                No
                                                                                                                                             Romania                          11.2             59.1             19.0           8.0
       CO2 emissions                     8,430                              3,960                                                            Spain                            11.1             43.0             24.7          18.5
                                                                                                                                             Portugal                         10.7             37.1             36.0          16.3
       HHSRS excess cold (band)          A                                  E                                                                Bulgaria                         10.5             55.4             25.5           8.6
                                                                                                                                             Finland                           9.6             48.7             29.7          10.7
       Cost savings to NHS pa            –                                  £730                                                             Slovakia                         8.2              52.6             21.5           5.8
                                                                                                                                             Greece                            7.6             47.8             29.1          15.5
       Payback to NHS (yrs)              –                                  7
                                                                                                                                             Cyprus                            3.0             24.6             36.1          34.1

                                                                                                                                          Source: EUROSTAT, EU-SILC 201511. Note: percentages do not all add up to 100.
You can also read