CSIRO survey of Community Wellbeing and responding to change: Western Downs region in Queensland
←
→
Page content transcription
If your browser does not render page correctly, please read the page content below
LAND AND WATER FLAGSHIP

CSIRO survey of Community
Wellbeing and responding
to change:
Western Downs region in Queensland

Andrea Walton, Rod McCrea and Rosemary Leonard

September 2014
ISBN (print): 978-1-4863-0441-7

ISBN (online): 978-1-4863-0442-4

CSIRO Land and Water

Citation
Walton, A., McCrea, R., & Leonard, R. (2014). CSIRO survey of community wellbeing and responding to
change: Western Downs region in Queensland. CSIRO Technical report: CSIRO, Australia.

Copyright and disclaimer
© 2014 CSIRO To the extent permitted by law, all rights are reserved and no part of this publication
covered by copyright may be reproduced or copied in any form or by any means except with the written
permission of CSIRO.

Important disclaimer
CSIRO advises that the information contained in this publication comprises general statements based on
scientific research. The reader is advised and needs to be aware that such information may be incomplete
or unable to be used in any specific situation. No reliance or actions must therefore be made on that
information without seeking prior expert professional, scientific and technical advice. To the extent
permitted by law, CSIRO (including its employees and consultants) excludes all liability to any person for
any consequences, including but not limited to all losses, damages, costs, expenses and any other
compensation, arising directly or indirectly from using this publication (in part or in whole) and any
information or material contained in it.
Preface

This report presents the findings from the second stage of a three year project entitled “Impacts of Coal
Seam Gas mining on communities in the Western Downs: How features, resources and strategies of a
community affect its functioning and well-being” (or the Community Functioning and Wellbeing Project).
The Western Downs local government area in southern Queensland is in the Surat Basin where most of
Australia’s coal seam gas (CSG) reserves can be found and where most CSG development activity is
presently taking place.
The Community Functioning and Wellbeing Project is one of a suite of projects examining social conditions
of coal seam gas communities in the Western Downs. It compliments other projects examining the
demographic changes in the region and the communities’ aspirations for the future.
The first stage of the Community Functioning and Wellbeing Project, conducted in 2013, investigated how
communities were responding to change in the context of a rapidly expanding CSG industry. Using a case
study approach, it centred on the town of Chinchilla and surrounds in the Western Downs (WD) region.
This second stage, in 2014, focuses on measuring community functioning and wellbeing across the whole
Western Downs region using a representative survey of residents.

                              CSIRO survey of Community Wellbeing and responding to change: Western Downs region in Queensland i
Contents
Preface i
Acknowledgments .............................................................................................................................................. v
Executive summary............................................................................................................................................ vi
1 Introduction .......................................................................................................................................... 1
1.1 Community wellbeing ................................................................................................................. 2
1.2 Community resilience: responding to change ............................................................................ 3
1.3 Future community wellbeing ...................................................................................................... 4
1.4 Community acceptance: Attitudes and feelings towards coal seam gas development ............. 4
1.5 Research questions ..................................................................................................................... 5
2 Method.................................................................................................................................................. 6
2.1 Sample ........................................................................................................................................ 6
2.2 Procedure.................................................................................................................................... 8
2.3 Measures..................................................................................................................................... 8
2.4 Overview of analyses ................................................................................................................12
3 Results .................................................................................................................................................14
3.1 Community wellbeing ...............................................................................................................14
3.2 Community resilience: responding to change ..........................................................................18
3.3 Future community wellbeing ....................................................................................................24
3.4 Community acceptance of CSG development: Attitudes and feelings towards CSG
development .......................................................................................................................................25
3.5 Demographic differences ..........................................................................................................29
4 Summary of Key Findings ....................................................................................................................34
4.1 Community wellbeing: Key Findings .........................................................................................34
4.2 Community resilience: Key findings ..........................................................................................36
4.3 Future community wellbeing: Key findings ..............................................................................37
4.4 Community acceptance of CSG development: Key findings .....................................................38
4.5 Limitations of the research .......................................................................................................38
5 Conclusion ...........................................................................................................................................39
Appendix A Summary statistics for survey items .............................................................................................42
Appendix B Demographic survey items............................................................................................................47
Appendix C Comparative items in CSIRO and LGAQ surveys ...........................................................................49
Appendix D Logistic regression.........................................................................................................................50
Appendix E Tables of demographic differences ...............................................................................................51
References ........................................................................................................................................................60
iiFigures
Figure 1 Dimensions of community wellbeing grouped into six domains ......................................................... 2
Figure 2 Responding to change .......................................................................................................................... 3
Figure 3 Explaining future community wellbeing ............................................................................................... 4
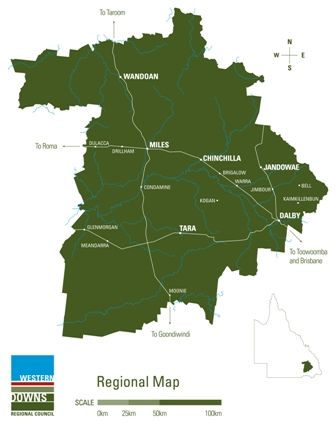
Figure 4 Western Downs region ......................................................................................................................... 6
Figure 5 Perceptions of community wellbeing dimensions: mean scores .......................................................16
Figure 6 Perceptions community responses to CSG development in the area: Percentages ..........................21
Figure 7 Perceptions of community adaptation to CSG development: percentages of favourable and
unfavourable perceptions ................................................................................................................................22
Figure 8 Levels of adaptiveness plotted against perceptions of community functioning and social
engagement ......................................................................................................................................................23
Figure 9 Attitudes towards CSG in the region by sub-regions..........................................................................25
Tables
Table 1 Profile of sample: percentage comparisons with ABS statistics ............................................................ 7
Table 2 Definition of sub-regions by postcodes ................................................................................................. 7
Table 3 Measurement of community wellbeing dimensions ............................................................................. 9
Table 4 Measurement of community resilience...............................................................................................11
Table 5 Measurement of community acceptance............................................................................................12
Table 6 Overall community wellbeing for WD region, sub-regions, and type of location ...............................14
Table 7 Comparing the WD Region with Queensland: Percentage of favourable responses for three
wellbeing measures ..........................................................................................................................................15
Table 8 Dimensions of community wellbeing for Western Downs region, sub-regions, and location type ....17
Table 9 Explaining overall community wellbeing from wellbeing dimensions: Multiple regression analysis .18
Table 10 Overall community resilience for the Western Downs region, sub-regions, and location type .......18
Table 11 Perceptions of community resilience actions ....................................................................................19
Table 12 Most important actions contributing to satisfaction with community responses: Multiple
regression analysis............................................................................................................................................20
Table 13 Explaining perceptions of community efficacy: Multiple regression analysis ..................................20
Table 14 Perceptions of community responses to CSG development in the area: Percentage of
participants .......................................................................................................................................................21
Table 15 Future community wellbeing for the Western Downs region, sub-regions, and location of
residence ..........................................................................................................................................................24
Table 16 Explaining future wellbeing from perceptions of current wellbeing, community resilience, and
place attachment: Multiple regression analysis ...............................................................................................24
CSIRO survey of Community Wellbeing and responding to change: Western Downs region in Queensland iiiTable 17 Attitudes towards CSG: Percentage of participants who reject, tolerate, accept, approve, and embrace CSG ....................................................................................................................................................26 Table 18 Feelings towards coal seam gas development in the area ................................................................26 Table 19 Explaining acceptance of CSG development in the area: Multiple regression analysis ....................27 Table 20 Explaining future wellbeing from perceptions of current wellbeing, resilience, place attachment, and views towards CSG development: Multiple regression analysis ..........................................28 Table 21 Summary of demographic differences ..............................................................................................30 Table 22 Wording for comparative community wellbeing items in LGAQ and SCIRO surveys ........................49 Table 23 Mean scores for community wellbeing, resilience, future wellbeing, place attachment, and attitudes and feelings by sub-region ................................................................................................................51 Table 24 Mean scores for community wellbeing, resilience, future wellbeing, place attachment, and attitudes and feelings by place of residence ....................................................................................................52 Table 25 Mean scores for community wellbeing, resilience, future wellbeing, place attachment, and attitudes and feelings by age............................................................................................................................53 Table 26 Mean scores for community wellbeing, resilience, future wellbeing, place attachment, and attitudes and feelings by gender ......................................................................................................................54 Table 27 Mean scores for community wellbeing, resilience, future wellbeing, place attachment, and attitudes and feelings by age by income brackets ...........................................................................................55 Table 28 Mean scores for community wellbeing, resilience, future wellbeing, place attachment, and attitudes and feelings by newness to the community .....................................................................................56 Table 29 Mean scores for community wellbeing, resilience, future wellbeing, place attachment, and attitudes and feelings by farm ownership........................................................................................................57 Table 30 Mean scores for community wellbeing, resilience, future wellbeing, place attachment, and attitudes and feelings by CSG sector work and other residents ......................................................................58 iv
Acknowledgments

The Community Functioning and Wellbeing Project was funded by the Gas Industry Social and
Environmental Research Alliance (GISERA). GISERA is a collaborative vehicle established to undertake
publicly-reported independent research addressing the socio-economic and environmental impacts of
Australia’s natural gas industries. The governance structure for GISERA is designed to provide for and
protect research independence and transparency of funded research. See www.gisera.org.au for more
information about GISERA’s governance structure, funded projects, and research findings.
The telephone survey was conducted on behalf of CSIRO by Q&A Research, see
http://qandaresearch.com.au

                             CSIRO survey of Community Wellbeing and responding to change: Western Downs region in Queensland v
Executive summary
Aim: The aim of this research was to investigate community wellbeing and responding to change in the
Western Downs Region, an area which has seen major development in coal seam gas. The key topics were
community wellbeing, community resilience, the expected level of future wellbeing; and the attitudes and
feelings towards coal seam gas development in the region.
Method: Attitudes and perceptions were collected from a representative sample of 400 randomly selected
residents in the Western Downs region using a survey design, telephone interviews and quota sampling.
The sample comprised residents that lived in town and out of town and that identified with one of four
major communities within the region: Dalby, Chinchilla, Miles, and Tara.
Benefits of the research: The research provides rich data that can be used by policy makers, community
groups, community leaders, and coal seam gas companies to enhance community wellbeing and resilience
processes in the Western Downs region of southern Queensland, Australia. The data provides opportunity
to support and enrich the region as follows:
• Identifies those areas of wellbeing and resilience that residents believe are functioning at unfavourable
or unsatisfactory levels
• Identifies the most 'important factors' underpinning wellbeing and resilience now and in the future
• Provides a depth of analysis for more targeted interventions and improved outcomes for different
segments of the community in need of support, based on social and geographic characteristics
• Provides the region with baseline data, which can be used for goal setting and measuring progress of
interventions
Key findings and conclusions:
Current wellbeing is robust but there are concerns for the future: Although wellbeing in the region was
robust (3.82 out of 5) and higher than many other regions in Queensland, some aspects of wellbeing and
resilience were cause for dissatisfaction to residents. Moreover, at present Western Downs communities
feel they are on a downward trajectory with expected future wellbeing (3.62 out of 5) being less than
current wellbeing. Findings indicated that 50 % of residents expect their wellbeing to decline.
The need to invest in wellbeing: Our analysis suggests that investments made in several dimensions of
current wellbeing and resilience could lead to a more optimistic outlook for the future. Most notably,
addressing roads, community participation in decision making, and management of the environment over
the long term would be intervening in three key areas of dissatisfaction relevant to wellbeing. We found
that the important factors contributing to a sense of wellbeing were not the same as those that people
were reporting as unsatisfactory. Whilst roads, decision making, and environmental management were
cause for concern, it was services and facilities, community spirit and cohesion, a socially interactive
community, and levels of personal safety and environmental quality that were the drivers of community
wellbeing. These are a mix of social, physical and environmental ingredients that seem to account for a
good quality of life within a community.
Differences across the region: Differences in wellbeing were found across the region. Tara reported
significantly lower levels of overall wellbeing than the other sub-regions and was also lower on eight of the
fifteen wellbeing dimensions. Employment and business opportunities were statistically higher in Chinchilla
than the other regions with both Dalby and Tara indicating unsatisfactory levels for this dimension. People
who lived out-of-town reported lower levels of social interaction, services and facilities, employment and
business opportunities, and overall community wellbeing than in-town residents.
viResilience actions create a positive outlook: The research identified the importance of community
resilience actions in creating a positive outlook for the future. When residents feel their community is
responding to change with good planning, leadership, and access to information they feel more positive
about the future. Moreover, when the community feels that all parties can work together, they feel even
more optimistic. Although the community felt there were good working relationships between community
groups and that they could support their volunteers over the long term, three areas of resilience were
considered as unsatisfactory: planning, leadership, and access to information. Our research shows that
together these aspects are important drivers of community resilience, which in turn contribute to wider
feelings of coping within the community and a sense of wellbeing into the future. When resilient actions
are perceived to be low people are less optimistic about their future and more likely to see their
community as ‘not coping’.
What do people think about coal seam gas? Most people were not enthusiastic about coal seam gas but
they tolerated or accepted it. Our results indicate that more positive attitudes to coal seam gas are
associated with a community feeling that they are being resilient and working together effectively to deal
with changes, that the environment is being managed well for the future and that there are good
employment and business opportunities. Those that believe their community is adapting and working
towards something better are those that see community actions as strong.
Opportunities to reassure residents about their future: There are numerous opportunities to improve
resilience, perceptions of trust, and reassure residents about their future including: demonstrating effective
planning by working together to solve some of the bigger issues, such as roads and dissemination of
information; demonstrating leadership by collaborating to initiate responses to problems and
opportunities; ensuring the implementation and follow through of interventions to those pockets of lower
wellbeing within the community; and to ensure adequate monitoring and rule enforcement, particularly
around environmental management.
A combined stakeholder effort: In combination, these findings provide many reasons for all stakeholders to
ensure that the community has the best opportunity to be resilient and for levels of wellbeing now and in
the future to be supported. By building on strengths and attending to areas of weakness the region can
strengthen its current wellbeing and build its resilience. Thus, it is in the interest of all stakeholders to work
towards building wellbeing and resilience within the community.
CSIRO survey of Community Wellbeing and responding to change: Western Downs region in Queensland vii1 Introduction
This report examines community wellbeing and responses to change in the Western Downs Regional (WD)
local government area in southern Queensland, Australia. Community wellbeing refers to the ‘quality of
life’ within the community and is viewed as an evaluation of important aspects or ‘dimensions’ of
community life at a point in time. Responding to change describes the resilient responses a community
undertakes when it experiences significant change. Underpinning each concept are a range of factors that
influence a sense of wellbeing and community responses to change, however, these factors have been
under-researched in the coal seam gas (CSG) context. Thus, the purpose of this research is to understand
the factors underpinning community wellbeing and community resilience, and how these relate to
expected future wellbeing and acceptance of coal seam gas. In addition, we seek to understand how these
matters are influenced by social and geographic differences, such as age, gender, income levels, and
location.
Adopting a survey design, this research used telephone interviews to collect data from 400 participants
randomly selected across the region. The survey measured the attitudes and perceptions of residents to
investigate four main areas:
1. Levels of community wellbeing
2. Perceptions of community resilience or responses to the changes associated with CSG development
3. Expected levels of future community wellbeing
4. An indication of community acceptance of coal seam gas development or attitudes and feelings
towards coal seam gas development in the area
These perceptions were examined for differences across four communities or sub-regions within the
Western Downs region (Dalby, Chinchilla, Miles, and Tara), and between town-based and out-of-town
based residents. The research participants were randomly selected and quotas used to ensure that there
were 100 participants from each of the four sub-regions and similar numbers of town-based and out-of-
town based participants. In addition, demographic differences such as age, gender, income levels and
newness to the community were also investigated.
By understanding these matters we believe that our research provides a comprehensive empirical base
useful for policy makers, community leaders, service providers, and coal seam gas companies in their
planning and decision making. This research makes a valuable contribution because it provides quantitative
data on important aspects of community functioning and builds on previous qualitative findings. Although
previous qualitative research has provided a rich and deep understanding of the issues experienced by CSG
development in the region, it is unable to accurately measure the extent of the findings. This research
addresses this gap by using a quantitative approach.
The report proceeds in four sections. First, relevant concepts are explained and prior research is
introduced, together with our aims and research questions. The second section describes the research
method including details of the sample, the survey procedure, and the measures used. The third section
presents the results in five parts: levels of community wellbeing; community resilience (responding to
change); expected future wellbeing; attitude and feelings towards coal seam gas development; and
demographic factors (age, gender, income and newness to the community). The final section of the report
is a discussion of the results summarising relevant findings and their implications for decision makers,
community development, community participation, and future research.
CSIRO survey of Community Wellbeing and responding to change: Western Downs region in Queensland 11.1 Community wellbeing
A measure of community wellbeing is a snapshot in time of the perceived 'quality of life' within the
community; the community as a ‘good place to live’ (McCrea, Walton, & Leonard, 2014). The notion of
community wellbeing means different things to different people and thus a comprehensive measure of
wellbeing that incorporates different 'dimensions' of wellbeing is used to gain a deeper understanding of
the various aspects of wellbeing that may influence the quality of life or happiness within the community.
Drawing from the literature and previous research in the WD region, we investigated wellbeing across 15
dimensions, which in turn can be grouped into six main areas: social, environmental, political, services and
facilities, economic, and health (McCrea et al., 2014). Each of these areas was measured by collecting
people's judgements and perceptions about the 15 different dimensions. Figure 1 depicts the dimensions
grouped into the six areas (domains). In addition to the dimensions of wellbeing, the literature suggests
that place attachment is also linked to a sense of wellbeing. Place attachment encompasses the notion, not
only, of attachment to the physical or natural elements of place, but also, of the social and community
aspects of place. Studies have suggested that disruption to aspects of place, either physical or social
elements, can result in negative emotions (grief and anxiety), place protective behaviour, and impacts on
social networks and social cohesion (Devine-Wright, 2011).
Our first aim was to understand the level of wellbeing within the community and the various factors
that contribute to an overall sense of community wellbeing.
Figure 1 Dimensions of community wellbeing grouped into six domains
Social
• personal safety, community
spirit, community cohesion,
community trust, community
participation, social
interaction
Health Environment
• physical and mental health • environmental quality and
environmental
mangaement
Community
wellbeing
Economic Political
• Income sufficiency,
• decision making and
employment and business
citizen voice
opportunities
Services and facilities
• services and facilities,
roads, built environment
21.2 Community resilience: responding to change
The WD region has experienced significant and rapid change from the major economic development
associated with CSG activities in the area. These changes have created both opportunities and challenges
for the community from social, economic, and environmental perspectives (Measham & Fleming, 2014).
Previous research identified different types of community actions that are important in helping a
community adapt to change in a CSG context, for example, strategic thinking such as planning, positioning
and leadership; timely access to relevant information; and cross linkages within a community (Walton,
McCrea, Leonard, & Williams, 2013). Moreover, the research suggests that the way in which the
community responds to the changes is linked to wellbeing within the community, see Figure 2. However, it
is unclear which processes or actions associated with the responses are considered important to
perceptions that the community is dealing effectively with changes. Furthermore, the extent to which
community resilience responses contribute to levels of current and future community wellbeing is unclear.
Our second aim was to understand which community actions contribute to a community effectively
dealing with change, and how these actions relate to future community wellbeing
Figure 2 Responding to change
Community actions Community
Impact of change on Future community
in response to resilience and level
the community wellbeing
changes of adaptation
In addition, research indicates that a belief that the community can work together to achieve change
(community efficacy) is also important for dealing with change, (McCrea et al., 2014). Particular community
actions may enhance community efficacy; however, trust within the community and a sense of community
participation in decision making also play a part in communities working together to effectively deal with
change (Walton et al., 2014; Williams & Walton, 2014).
Our third aim was to investigate which factors contribute to a collective sense of community efficacy
Finally, the literature suggests that responding to change can be viewed on a spectrum of types of adaptive
responses (Brown & Westaway, 2011). These responses can range from resisting change, to coping, to
adapting, to transforming. Resilient responses are considered those that result in outcomes beyond
returning to the original state. Rather, resilient responses suggest that communities adapt and potentially
transform into something different but better.
Our fourth aim was to investigate adaptation within the community and to understand the factors that
contribute to the different types of responses
CSIRO survey of Community Wellbeing and responding to change: Western Downs region in Queensland 31.3 Future community wellbeing
In addition to measuring current perceptions of wellbeing, we also investigated expected community
wellbeing in three years time, which we describe as 'future' wellbeing. As shown in Figure 3, our conceptual
model suggests that a sense of future wellbeing relates not only to current levels of wellbeing but also to
community resilient responses, and that if a community believes that it is dealing effectively with change,
despite its current levels of community wellbeing, then its level of wellbeing for the future will be higher
(McCrea et al., 2014).
Our fifth aim was to understand what factors are linked to a sense of future community wellbeing
Figure 3 Explaining future community wellbeing
Dimensions of
community wellbeing Overall
CHANGE eg.social, economic, services
community
and facilities, environment, wellbeing
political, health Future
community
Community resilience wellbeing
actions Overall
CHANGE e.g., planning, leading, community
accessing information, cross- resilience
linking
1.4 Community acceptance: Attitudes and feelings towards coal seam
gas development
Community support or acceptance of an industry's activities within a community is important to the
ongoing operation of the activity. This acceptance is also referred to as a 'social Licence to operate' (SLO),
whereby the industry meets the expectations of the community with regards to its actions and gains
ongoing acceptance and approval (Gunningham, Kagan, & Thornton, 2004; Moffat & Zhang, 2014). Previous
research conducted in a CSG region indicated that expectations revolve around aspects of community
wellbeing such as affordable housing, good roads, job opportunities, sustainable businesses, water quality
and quantity, maintenance of community spirit, community trust, and engaging with the community from a
position of mutual respect (Williams & Walton, 2014). The importance of some of these factors to
community acceptance of the CSG industry has been tested (Moffat & Zhang, 2014), but how community
acceptance relates to a sense of community wellbeing and community resilience has not been
demonstrated empirically. This research addresses this gap.
Our sixth aim was to understand how a sense of community wellbeing and perceptions of community
resilience relate to attitudes and feelings towards CSG development.
41.5 Research questions
From the aims underpinning this research, this study addresses eight main research questions grouped into
four areas.
Community wellbeing
RQ1. What is the level of current wellbeing within the Western Downs region, and how does this vary
across the region; for example, according to residential location, age, gender, and income?
RQ2. Which aspects (dimensions) of wellbeing are most important to an overall sense of community
wellbeing?
Community resilience
RQ3. What are the perceptions of the community's actions that have been taken to deal with change
associated with CSG development in the region, and which actions are the most important?
RQ4. Which factors contribute to a belief that the community can work together to deal effectively with
change?
RQ5. How does the community perceive it is adapting to the impacts of change, and how does this vary
across the region?
RQ6. What factors are linked to different types of responses?
Future community wellbeing
RQ7. What is the expected level of future community wellbeing, and what factors explain a sense of
wellbeing in the future?
Community acceptance of CSG development
RQ8. What are the attitudes and feelings towards coal seam gas development in the region, how do they
vary, and what factors explain these views?
CSIRO survey of Community Wellbeing and responding to change: Western Downs region in Queensland 52 Method The research used a survey approach to investigate perceptions of community wellbeing, community resilience and attitudes towards coal seam gas within the Western Downs local government area of south- west Queensland (see Figure 4). The survey was conducted during February of 2014 and the data collected using telephone interviews. A third party research company was employed to conduct 400 completed computer assisted telephone interviews (CATI) using a database of regional telephone numbers to randomly select participants. The survey took approximately 25 minutes to complete and all recruitment, selection and survey procedures adhered to Guidelines of the National Statement on Ethical Conduct in Human Research. The research was also in accordance with the ethical review processes of the CSIRO. Figure 4 Western Downs region Source: http://www.wdrc.qld.gov.au/services/regional_maps.shtml#region 2.1 Sample Participants were recruited through a third party social research company, which used a database of regional landline and mobile telephone numbers to randomly select participants based on predetermined selection criteria and quotas. These criteria required participants to be 18 years old and reside in the Western Downs region. Three quotas were used to ensure a representative sample was obtained that reflected ABS population statistics for the region (ABS, 2011) on age, gender and employment (see Table 1). 6
In addition, equal quotas were set for the four sub-regions (100 in each) and for those living in towns versus
surrounding areas (50:50) to ensure sufficient sample sizes for comparisons between them. This selection
was achieved through screening questions embedded within the survey.

Table 1 Profile of sample: percentage comparisons with ABS statistics

Sample demographics                           Sample               ABS 2011 population census
                                         percentages                        percentages

Aged 18 - 34 years                              24                                 27

Aged 35 – 54 years                              42                                 38

Aged 55 plus                                    34                                 35

Male                                            51                                 52

Employed                                        65                                 65

There were four subregions: Dalby, Chinchilla, Miles, Tara, and each were defined by specific postcodes as
outlined in Table 2. Note that the Dalby sub-region included residents from Jandowae and surrounds, and
that the Miles sub-region included residents from Wandoan and surrounds. There were 196 participants
who were town-based residents, and 204 participants who lived out of town. Most of the sampled
residents living out of town owned a farm (63.2%), though approximately a third did not (36.8%). Most
town-based residents did not own a farm (89.3%) but a small number of residents living in town did own a
farm (10.7%).

Table 2 Definition of sub-regions by postcodes

Sub-regions          Postcodes                                    Number of participants

Dalby                4404, 4405, 4408                                        100

Chinchilla           4410, 4411, 4412, 4413                                  100

Miles                4415, 4416, 4419, 4424, 4425                            100

Tara                 4406, 4421, 4422                                        100

The response rate for the survey was 25.6%, which is reasonable for random telephone surveys. To check
whether survey participants were more likely to accept or reject CSG activities in the region, interviewers
were asked to rate each participant on their interest in the survey from 1 ‘very uninterested’ to 5 ‘very
interested’, and this was tested for an association with their attitude toward CSG activities in the region.
However, no significant association was found (rs = .05; p=.32). Together with the demographics shown in
Table 1, the sample was considered representative of residents in the region.

                                  CSIRO survey of Community Wellbeing and responding to change: Western Downs region in Queensland 7
2.2 Procedure All participants undertook a telephone interview that lasted approximately 25 minutes. The survey proceeded in five parts. The initial part of the survey included screening questions for the survey and quota selection, informed consent procedures, some demographic questions and a question asking participants which one of six local communities within the Western Downs region they felt most part of. This identified community became the subsequent reference for all questions relating to ‘community’ throughout the survey. The second part of the survey investigated perceptions of community wellbeing including fifteen different aspects (dimensions) of wellbeing, an overall sense of wellbeing and expected future wellbeing, each with their own set of questions. The third part of the survey measured perceptions of community responses to changes associated with CSG development (community resilience). The fourth part measured participants’ attitudes and feelings towards coal seam gas development, and the final section gathered demographic data. Each participant answered 119 questions (items) including two screening questions. At the end of the survey participants were offered to enter a draw for a prize of a $50 gift voucher as gratitude for completing the survey. Twenty five participants were randomly selected to receive vouchers. 2.3 Measures Perceptions of community wellbeing, community resilience, and personal attitudes and feelings towards CSG development were measured using multiple items for each section. The items were developed from an extensive literature review, including qualitative research in the CSG field (Walton et al., 2013; Williams & Walton, 2014), and community wellbeing and resilience research (Christakopoulou, Dawson, & Gari, 2001; Forjaz et al., 2011; Morton & Edwards, 2013; Onyx & Leonard, 2010; Sirgy, Widgery, Lee & Yu, 2010; Walton et al., 2013), with some items adapted for the CSG and rural context. In most instances, respondents were asked to respond to a question stem using a scale from 1 to 5 where 1 was the least and 5 was the most. Participants were either asked to indicate how much they agreed with a statement, or how satisfied they were with the issue in question. The agreement scales ranged from 1 = strongly disagree to 5 = strongly agree, and the satisfaction scales ranged from 1 = very dissatisfied to 5 = very satisfied. In addition, there were two open ended questions that required short responses, and the demographic questions required participants to choose the most accurate category. Measures for each section and scale development are outlined as follows. The specific items are detailed in Appendix A. Community Wellbeing Measures (79 items) Community wellbeing was measured in three ways: 1) fifteen different dimensions of wellbeing using multiple items for each dimension, 2) an overall community wellbeing measure using five items, and 3) a future wellbeing measure comprising two items. All multi-item measures were tested for ‘internal consistency’ or reliability using Spearman’s r for two-item measures and Cronbachs’ alpha for measures with three or more items. Separate scales were developed for each dimension of community wellbeing, for overall community wellbeing, and for future wellbeing by averaging the score of the items within the respective scale. The reliability of all measures exceeded .70, (where reliability over .90 is considered very good, over .80 is considered good, and .70 can be considered adequate for scale development). Where an item noticeably reduced the reliability of a measure, the inconsistent item was removed from the scale. There were two items that did not scale within their theoretical dimensions: one item related to the impact of rent or mortgage repayments on your household finances; and one item related to satisfaction with job- security (if applicable). Results for these items are reported in Section 3.5.2 as miscellaneous items and in Appendix A. Table 3 details the reliability scores and scale development for each community wellbeing measure. 8
Table 3 Measurement of community wellbeing dimensions

Measures                                               No of items            Reliability                Scale development
                                                                          (Cronbachs’ alpha)

Dimensions

    1.   Personal safety                                    4                     .77                      Items averaged
                                                                                                            1
    2.   Income sufficiency                                 4               4 items α = .79         One item did not scale and was
                                                                            3 items α =.91                analysed separately
                                                                                                            2
    3.   Health                                             7               7 items α = .79         One item did not scale and was
                                                                            6 items α = .81               analysed separately

    4.   Services and facilities                            9                     .87                      Items averaged

    5.   Built environment                                  3                     .82                      Items averaged

    6.   Roads                                              5                     .83                      Items averaged

    7.   Environmental quality                              3                     .79                      Items averaged

    8.   Environmental management                           4                     .85                      Items averaged

    9.   Decision making and citizen voice                  4                     .82                      Items averaged

    10. Employment and business opportunities               3                     .84                      Items averaged

    11. Community spirit                                    4                     .89                      Items averaged

    12. Community cohesion                                  3                     .88                      Items averaged

    13. Community trust                                     6                     .84                      Items averaged

    14. Community participation                             4                     .89                      Items averaged

    15. Social interaction                                  4                     .79                      Items averaged

Overall community wellbeing                                 5                     .86                      Items averaged
                                                                                     r
Expected future wellbeing                                   2                     .75                      Items averaged

Place attachment                                            4                     .84                      Items averaged
     1                                                                                          2
Note: the item ‘your rent or mortgage repayments impact greatly on your household finances’; the item ‘satisfaction with your
job security (if applicable)’; r = Spearman’s correlation coefficient.

Description of items
See Appendix A for exact wording of each item

Personal safety asked how much residents agreed it was safe for various activities at night (to be alone at
home, walk outside, or leave the car on the side of the road) as well as how safe they felt living in the area
overall (items Q11_A to Q11_D in Appendix A).
Income sufficiency asked how much residents agreed that their household income was enough for
household expenses and the lifestyle they enjoy, as well as their overall satisfaction with their income
covering their living expenses. Another item asked about how much rent or mortgage repayments
impacted on their household finances; however, this item was not included in the income sufficiency scale
because it reduced this measures reliability (i.e. it did not highly correlate with the other three items; see
items Q12_A to Q12_D).

                                   CSIRO survey of Community Wellbeing and responding to change: Western Downs region in Queensland 9
Health asked about satisfaction with diet and eating habits, exercise habits, physical and mental health, job security, as well as overall satisfaction with their health and wellbeing. However, an item for satisfaction with job security (if applicable) was not included because it reduced the reliability of the health scale (see items Q13_A to Q13_G). Services and facilities was measured as satisfaction with local schools, child care facilities, sports and leisure facilities, food and other shopping, medical and health services, and community support services, as well as overall satisfaction with services and facilities in their local community (items Q14_A to Q14_I). In addition, residents were asked to suggest ‘the single most needed service or facility’ for their community, which was an open ended question not included in this measure. Built environment asked about satisfaction with cleanliness in their town, parks and gardens, and satisfaction with the general appearance of their town (see items Q15_A to Q15_C). Roads asked about satisfaction with the condition of and safety on the roads, and the amount of traffic on the roads, both in and around their town, as well as satisfaction with the roads overall (see items Q16_A to Q_16E). Environmental quality asked about pollution and their satisfaction with the level of dust, noise, and the overall quality of the general environment in their community (items Q17_A to Q_17C). Environmental management asked residents to think about the natural environment and how satisfied they were with quality of underground water for the future; nature reserves for the future; sustainability of local farming land for the future; and the overall management of the natural environment for the future (items Q18_A to Q18_D). Decision making and citizen voice asked residents to think about how decisions are made affecting their local community and surrounds. It asked how much they agreed that the council keeps them informed; there are opportunities to be heard; and the CSG companies involved local residents in their decisions; along with an overall rating on their satisfaction with how decisions are made affecting their community (see items Q19_A to Q19_D). Employment and business opportunities asked how much residents agreed that there were good job opportunities and that local businesses had done well out of CSG development, as well as their satisfaction with employment and business opportunities in their local area (items Q20_A to Q20_C). Community spirit asked residents how much they agreed that people can rely upon one another for help; have friendly relationships; can work together if there is a serious problem; as well as an item on their overall satisfaction with community spirit in their local area (items Q21_A to Q21_D) Community cohesion was about inclusiveness in the community and asked resident how much they agreed that their local community was welcoming of newcomers; welcoming of people of different cultures; and their community includes everyone no matter who they are (items Q22_A to Q22_C). Community trust asked residents about levels of trust in their local area relating to: community leaders; people generally around their local area; the Western Downs Regional Council; CSG companies; and State Government; as well as overall satisfaction with levels of trust in their local area (items Q23_A to Q23_F). Community participation asked residents how much they agreed that they: regularly helped out a local group as a volunteer (e.g., once a week); attended several community events in the past year; were an active member of a local organisation or club; and overall, regularly participated in a variety of community activities (items Q24_A to Q24_D). Social interaction asked residents about their everyday interactions with people, other than those they lived with. It asked how much they agreed that they regularly visited someone’s home; went out together socially; spoke or texted on the phone; as well as their overall satisfaction with their level of social interaction locally (see items Q24_A to Q24_D). Overall community wellbeing asked residents how much they agreed that their community was suitable for young children, teenagers, and for seniors, as well as how much they agreed their local area offered a good quality of life overall, and that they were happy living in their local area (see items Q25_A to Q25_E) 10
Expected future wellbeing asked residents to imagine what their local area might be like in three years
time and how much that agreed that their area would offer a good quality of life and that they would be
happy to be living in their local area (see items Q25_A and Q25_B).
Place attachment was measured by asking residents how much they felt they belonged to their local area;
whether they would be pleased to come back if they went away; would like to be living in the area in 3
years time; and their overall attachment to the their local area (items Q10_A to Q10_D).

Community Resilience Measures (13 items)
Community resilience was measured in three ways: 1) community actions, which used eight items to
measure perceptions of various community activities in response to changes from CSG development; 2)
collective efficacy, which used two items to measure a belief in the community’s ability to work together;
and 3) an overall evaluation of the level of community adaptation in dealing with change from CSG
development, measured by a single item. Table 4 summarises reliability scores and scale development.

Table 4 Measurement of community resilience

Measures                                       No of items         Reliability                     Scale development
                                                               (Cronbachs’ alpha)
Community actions (responding to change)            8                  .92                           Items averaged
                                                                          r
Community efficacy                                  2                  .83                           Items averaged

Overall community resilience (constructed                              .93            Average of community actions and collective
scale)                                                                                              efficacy items

Community adaptation                                1                  NA                              Single item

Note: r = Spearman’s correlation coefficient

Community actions asked respondents to think about how their local community was responding to CSG
development in terms of planning for the future, adequate leadership, accessing relevant information,
developing key connections within the community, supporting volunteers, persevering, demonstrating
good intergroup working relationships, and an overall evaluation of their satisfaction with the way the
community was responding to change (Q 28_A to A28_H). Mean substitution was used for missing values
on the community action items since some residents had difficulty answering these items; however,
missing values on these were less than 5%.
Community efficacy asked respondents to consider how well different groups (residents, government,
business and resource companies) could work together to address problems or take advantage of
opportunities in relation to CSG development (Q 29_ A and Q29_B).
Overall community resilience was the average of community action and collective efficacy items (Q28_A to
Q29_B).
Level of community adaptation asked respondents their perception of how the community was dealing
with CSG development – resisting it / not coping / only just coping / adapting to the changes / changing into
something different but positive (Q30).

Community Acceptance Measures: Attitudes and Feelings towards CSG development (7 items)
Attitude towards coal seam gas was measured using a single item measure and feelings towards coal seam
gas was captured using 6 items – three items measured positive emotions and three items measured
negative emotions. The feelings measures demonstrated high internal consistency and were combined with
the attitude measure into a scale called community attitude and feelings towards CSG (see Table 5).

                                   CSIRO survey of Community Wellbeing and responding to change: Western Downs region in Queensland 11
Table 5 Measurement of community acceptance
Measures No of items Reliability Scale development
(Cronbachs’ alpha)
Attitude towards CSG development 1 NA
Feelings towards CSG development 6 .90 Items averaged
Community attitudes and feelings towards CSG .92 Scale constructed from average of
(constructed scale) attitude and feelings items
Attitude towards CSG asked respondents to choose which best described their attitude towards coal seam
gas development in their region – I reject it / I tolerate it / I accept it / I approve it / I embrace it (Q32).
Feelings towards CSG development asked three items that included positively-valanced emotions and
three items that included negatively-valanced emotions. Each item related to coal seam gas development
and included: I feel pleased to have the coal seam gas resource boom in our region; when I look at what is
happening around coal seam gas I feel optimistic; when I talk about the opportunities of coal seam gas I get
excited; when I think about how much coal seam gas affects everyday life it makes me angry; when I think
about how things are changing because of coal seam gas I get worried; when I talk about coal seam gas I
feel sad (Q31_A to Q31_F).
Demographic questions (19 items)
A number of demographic questions were asked at the beginning of the survey, mainly for screening out-
of-scope residents and assisting with quota sampling, while the remaining demographic questions were
asked at the end of the survey. These demographic variables included age, gender, location type (in or out-
of-town), sub-region, employment, income, connectedness to CSG, home ownership, education, place of
birth, language. The items relating to demographic variables are detailed in Appendix B.
2.4 Overview of analyses
Differences between means for sub-regions on the community wellbeing, resilience, future wellbeing, and
community attitudes and feelings scores were tested using Analysis of Variance (ANOVA) and comparisons
for in and out-of-town residents were tested using between-groups t-tests. As with all significance tests
undertaken in this report, tests result were denoted as significant if the p-value was less than .05 (i.e., a less
than 5% chance of saying the difference was significant when it was not).
Differences between selected demographic variables were first tested across all the community wellbeing,
resilience, future wellbeing, and attitudes and feelings dimensions at the same time using Multivariate
Analysis of Variance (MANOVA). This ensured that the demographic variables were significantly different
on at least one of the community wellbeing, resilience or acceptance dimensions, while controlling for
other selected demographic variables. Second, any significant demographic variables were followed up
with ANOVAs and t-tests to identify which groups were significantly different on which dimensions.
Multiple regression analyses were used to determine the important factors contributing to community
wellbeing, community resilience, community acceptance of CSG and future wellbeing. These were
predicted from their underlying dimensions, items and other theoretically relevant variables. Standardised
coefficients (Beta weights) were used to compare predictor variables. In addition, residuals and outliers
were checked to ensure that the analyses met multiple regression assumptions.
For predicting community adaptation, a logistic regression was used since community adapting is not a
continuous variable. This involved collapsing the community adapting variable into two categories: 1 = yes
(i.e., adapting to the changes or changing into something different but better) and 0 = no (resisting it, not
coping, or only just coping). A discriminant analysis was also used to describe which dimensions of
12You can also read