FUTURE OPPORTUNITIES FOR WATER SERVICES IN PERTH - FUTURE DEVELOPMENT SCENARIOS - Water West
←
→
Page content transcription
If your browser does not render page correctly, please read the page content below
REPORT TO
      WATER WEST
      NOVEMBER 2016

FUTURE
OPPORTUNITIES
FOR WATER
SERVICES IN
PERTH
FUTURE DEVELOPMENT
SCENARIOS
C O N T E N T S
      EXECUTIVE SUMMARY                                                        I
      1
      Water supply                                                             1
1.1   Introduction                                                             1
1.2   Current sources of water                                                 1
1.3   Future sources of water                                                  2
1.4   Summary                                                                  5

      2
      Future water demand                                                      6
2.1   Introduction                                                             6
2.2   Population projections                                                   6
2.3   Water use efficiency                                                     7
2.4   Future total water demand                                                9
2.5   Supply demand gap                                                       11
2.6   Public open space and additional demand                                 11
2.7   Summary                                                                 14

      3
      Water infrastructure costs and delivery                                 16
3.1   Introduction                                                            16
3.2   Recent trends in water supply investment and costs                      16
3.3   Future potable water supply costs                                       17
3.4   Future wastewater costs                                                 20
3.5   Relative costs of greenfield, frontal and infill water infrastructure   23
3.6   Constraints to investment                                               23
3.7   The role of the private sector                                          24
3.8   The water services market                                               25
3.9   Summary                                                                 29

      4
      Delivery models and implications                                        30
4.1   Introduction                                                            30
4.2   Base case scenarios                                                     30
4.3   Sensitivity scenarios                                                   39
4.4   Summary                                                                 41

      5
      Conclusions                                                             42
5.1   Conclusions and summary                                                 42

      REFERENCES                                                              44
C O N T E N T S
FIGURES
 FIGURE 1.1   SCHEME WATER SUPPLY SHARES: 2010 AND 2016          2
 FIGURE 1.2   INTEGRATED WATER SUPPLY SCHEME WATER: BY
              SOURCE                                             2
 FIGURE 1.3   RAINFALL TRENDS IN DAM CATCHMENT AREAS             3
 FIGURE 1.4   CHANGE IN WATER LEVEL OF GNANGARA MOUND:
              2001 -2014                                         4
 FIGURE 2.1   WATER CONSUMPTION PER CAPITA FOR PERTH
              REGION: 2006-2016                                  8
 FIGURE 2.2   WATER USE EFFICIENCY: PER CAPITA STYLISED HIGH,
              LOW, AND MID WATER USE TRAJECTORIES                9
 FIGURE 2.3   WATER AVAILABILITY AND DEVELOPMENT AREAS:
              NORTHERN FOCUS                                     12
 FIGURE 2.4   WATER AVAILABILITY AND DEVELOPMENT AREAS:
              SOUTHERN FOCUS                                     13
 FIGURE 3.1   LONG-TERM DEBT OF WATER CORPORATION ($M)           17
 FIGURE 3.2   CHANGE IN WATER CORPORATION PER PROPERTY
              COSTS ($)                                          17
 FIGURE 3.3   DEVELOPMENT AREAS AND THE SEWER NETWORK:
              NORTHERN AREAS                                     21
 FIGURE 3.4   DEVELOPMENT AREAS AND THE SEWER NETWORK:
              SOUTHERN AREAS                                     22
 FIGURE 3.5   WATER AS A NATURAL MONOPOLY                        26
 FIGURE 3.6   CHANGE IN WATER TABLE: 1984, 1999, 2014 GNANGARA
              MOUND                                              28
 FIGURE 4.1   10 PERCENT SCENARIO: BASE CASE CAPITAL SAVING      33
 FIGURE 4.2   10 PERCENT SCENARIO: BASE CASE POTABLE WATER
              SAVING                                             33
 FIGURE 4.3   10 PERCENT SCENARIO: BASE CASE ENVIRONMENTAL
              BENEFIT                                            34
 FIGURE 4.4   25 PERCENT SCENARIO: BASE CASE CAPITAL SAVING      35
 FIGURE 4.5   25 PERCENT SCENARIO: BASE CASE POTABLE WATER
              SAVING                                             35
 FIGURE 4.6   25 PERCENT SCENARIO: BASE CASE ENVIRONMENTAL
              BENEFIT                                            36
 FIGURE 4.7   50 PERCENT SCENARIO: BASE CASE CAPITAL SAVING      37
 FIGURE 4.8   50 PERCENT SCENARIO: BASE CASE POTABLE WATER
              SAVING                                             37
 FIGURE 4.9   50 PERCENT SCENARIO: BASE CASE ENVIRONMENTAL
              BENEFIT                                            38
 TABLES
 TABLE 1.1    SOURCES OF SCHEME WATER (RELATIVE SHARE)           1
 TABLE 2.1    POPULATION AND HOUSING GROWTH IN THE
              GREATER PERTH METROPOLITAN REGION                  6
 TABLE 2.2    EXPECTED FUTURE PERTH DWELLING
              CONSTRUCTION TO 2050                               7
 TABLE 2.3    POSSIBLE PERTH WATER DEMAND SCENARIOS TO
              2050                                                9
 TABLE 2.4    RECENT REGULATORY PERIOD DEMAND FORECASTS          10
 TABLE 2.5    HOUSEHOLD WATER USE SURVEY: 2008/09                10
C O N T E N T S
TABLE 2.6   PERTH METROPOLITAN WATER SUPPLY GAP PER
            ANNUM: POSSIBLE SCENARIOS                      11
TABLE 2.7   CALCULATING THE PUBLIC OPEN SPACE
            REQUIREMENT FOR A DEVELOPMENT                  14
TABLE 3.1   IMPACT OF THE REGULATOR ON THE RETURN TO
            GOVERNMENT ($M)                                24
TABLE 4.1   SAVINGS SUMMARY ASSUMING CAPITAL INVESTMENT
            TRIGGER                                        38
TABLE 4.2   PER HOUSEHOLD WATER BILL SAVINGS               39
TABLE 4.3   CAPITAL SAVINGS: SMOOTHED INVESTMENT PROFILE
            V DECISION TRIGGER                             40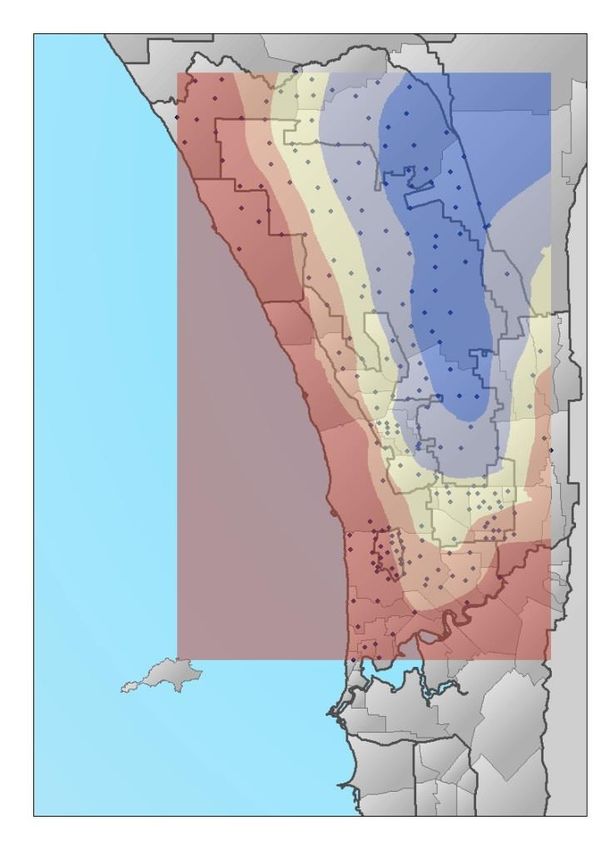
EXECUTIVE
       SUMMARY

Current water services delivery model
Perth’s current potable water and wastewater infrastructure is based on a large network model owned
and operated by the State Government owned utility, the Water Corporation. In the Perth region, each
year 264GL1 of potable water is delivered to homes and businesses via the integrated network, and
164GL of wastewater is processed through treatment plants. Almost all treated wastewater is
disposed of via the Indian Ocean; yet wastewater is a valuable resource, and Perth lags behind other
major cities in wastewater recycling and re-use. Perth’s current water services delivery model forces
residents to use scarce, expensive to produce potable drinking water for non-potable uses such as
toilet flushing and garden irrigation. At the same time their wastewater, a possible source for recycling
and supply of non-potable water, is collected and pumped long distances to treatment plants before
being discharged to the ocean. Water supply-demand projections indicate a looming shortage unless
the State invests significant capital on new desalination plants, whereas the reality is that all Perth
communities (existing and future) already have close to half their household water needs immediately
available on their doorstop – i.e. wastewater which could be recycled and re-used.
The current delivery model for water services in Perth materially oversizes potable water supply and
connection network infrastructure relative to that required to meet only the fit-for purpose use of
potable water (drinking, kitchen, showers). Arguably, the necessary size (and cost) of this potable
water infrastructure could be approximately 50 percent smaller than the current Business as Usual
model, with consumers and the community also better off.
Stakeholders in Perth’s water future need to progress the conversation as to how their valuable
wastewater resource can be better collected, treated, and recycled for local re-use. From an open
conversation the steps needed to transform Perth into a water sensitive city will become clear.
Transforming the water service delivery approach for Perth will reduce the future need and use of
potable water, reduce pressure on Perth’s over allocated groundwater resources, and reduce the
necessary size and cost of potable water supply (desalination) and connection infrastructure.

Current participants in the water services market
The Water Corporation is the incumbent and dominant provider of water services in the Perth
metropolitan area. Private sector involvement is currently limited but interest and activity is increasing,
particularly since the passing of the Water Services Act 2012. The Act went a long way towards
cleaning up process, role and responsibility issues that had previously impeded private sector
involvement in the sector. However, planning and approval issues remain a challenge that restricts
private sector engagement. Meaningful private sector participation in Perth’s future water supply and
delivery infrastructure and services not only offers the opportunity for non-government funding of

1   In this report, the abbreviations GL, ML and kL refer to gigalitres, megalitres and kilolitres.

                                                                                                      i
              FUTURE OPPORTUNITIES FOR WATER SERVICES IN PERTH FUTURE DEVELOPMENT SCENARIOS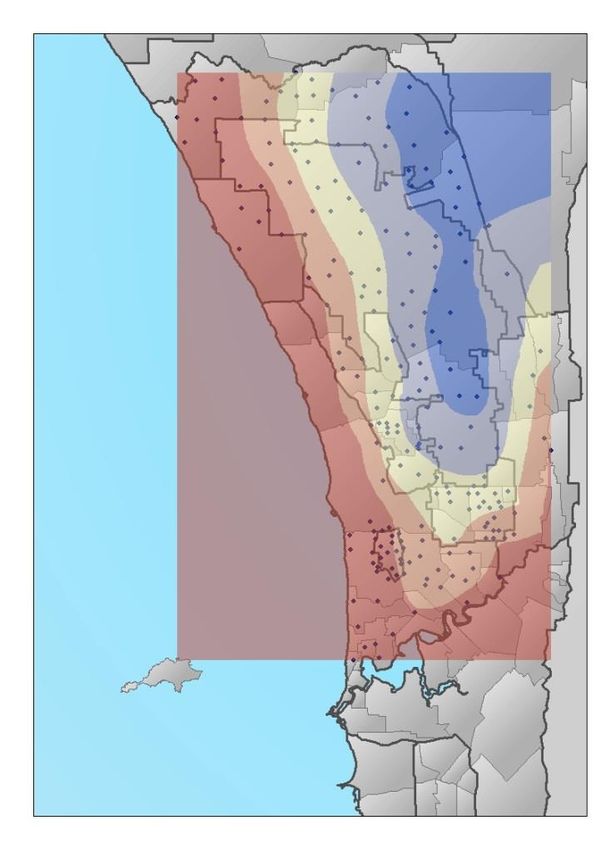
otherwise expensive infrastructure, but can also promote innovative solutions and ideas to address
the very real and growing challenge of future water demands exceeding natural supplies and how we
as a community can best bridge this gap.

Current state of water supply infrastructure
The main supply sources for water in Perth are dams (7%), groundwater (46%), and desalination
(47%). However, current groundwater extraction levels are above sustainable limits, and future dam
inflows are expected to fall. This means that in the future Perth’s existing water supply infrastructure
will deliver less water than it does today. Published projections suggest existing groundwater, dam,
and desalination resources will provide less than 200GL of supply by 2050.

Future water demand
Future water demand can be forecast based on population projections and assumptions about the
trajectory for per capita water consumption. A number of population projections have been prepared
for Perth, with a key planning scenario suggesting a population for the Perth-Peel area in 2050 of 3.5
million. Current per capita water use in the metropolitan area is 126kL per person, but was
significantly higher in the recent past. Based on a range of population projections multiplied by a
range of per capita water consumption values it is possible to develop a picture of future water
demand in Perth. For the central case of annual per capita water consumption of 125kL per person,
and a population of 3.5 million, the expected Perth water demand in 2050 is 438GL.

The water supply gap
The water supply gap in 2050 can be calculated by subtracting the supply that existing infrastructure is
expected to deliver in 2050 from the water demand projections. This supply gap is shown in Table ES
1, and for the central case of a population of 3.5 million, and per capita water use of 125kL, the water
supply gap in 2050 is 238GL.
TABLE ES 1    THE FUTURE WATER SUPPLY GAP (GL PER ANNUM)
         Population                         Annual Water use per person
                                         120 kL                   125 kL                  130 kL
    3,100,000 (1.32% CAGR)               172 GL                  188 GL                   203 GL
    3,500,000 (1.67% CAGR)               220 GL                  238 GL                   255 GL
    3,900,000 (1.99% CAGR)               268 GL                  288 GL                   307 GL
SOURCE: ACIL ALLEN

Delivering water infrastructure: Business as Usual
Under a Business as Usual development scenario, the main new supply sources will be new
desalination and centralised water recycling projects; with identified future desalination projects
providing between 165GL and 250GL, and centralised water recycling projects providing as much as
54GL.
Both desalination and centralised water recycling projects are associated with high capital costs.
Reflecting this, as the share of desalination in Perth’s water supply has increased, so too has the debt
level at the Water Corporation. For example, between 2006 and 2016 Water Corporation’s long term
debt has increased almost fourfold, from $1.4 billion to $5.8 billion.
State planning policy provides that 47 percent of new dwellings in Perth should be infill developments,
where the Water Corporation is the incumbent service provider. Water Corporation will therefore need
to invest heavily in capacity upgrades for infill infrastructure. Meeting this demand will put pressure on
the Water Corporation’s financial capacity to invest in servicing new frontal growth developments.
The development of water infrastructure under a Business as Usual scenario will therefore require
many billions of dollars in addition capital investment between now and 2050. This, in turn, means
further increases in the State debt.

                                                                                                    ii
          FUTURE OPPORTUNITIES FOR WATER SERVICES IN PERTH FUTURE DEVELOPMENT SCENARIOS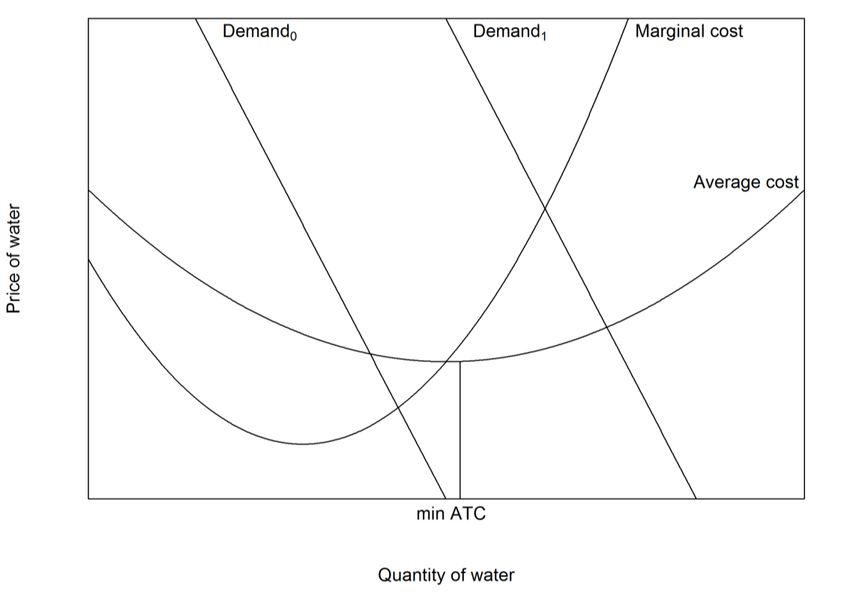
Current State debt levels work to restrict capital investment in water infrastructure, and given the
priority of new water supply, this has stressed maintenance and upgrade investment in other parts of
the water supply network. For example, independent reviews of Water Corporation capital investment
spending have found spending levels to be too low. Total State debt levels are therefore already
restricting investment in the sector. Given State debt is projected to rise by $10 billion, to $40 billion,
between now and 2020, this situation will only worsen.

Delivering water infrastructure: An alternative approach
It is possible to model the savings to government in terms of capital expenditure required by 2050,
under different water service delivery scenarios. For example, if the population in the greater Perth
area was to increase to 3.5 million by 2050, and if the private sector was to provide local wastewater
and recycling services to 25 percent of the new dwellings constructed, the savings to the Western
Australian State Government, in terms of lower capital expenditure, would be $1.45 billion. The
savings in terms of capital expenditure rise as private sector involvement increases, and by 2050, if 50
percent of new residential developments have wastewater and local water recycling services delivered
by the private sector, the savings to the State Government in terms of capital expenditure would be
$3.37 billion (see Table ES 2).
TABLE ES 2           POTENTIAL SAVINGS FROM ADOPTION OF LOCAL WASTEWATER RECYCLING
                     SCHEMES RELATIVE TO BUSINESS AS USUAL
                                                                New development share
       Details                                         Units
                                                              10%       25%        50%
       Water Supply Infrastructure Capital Saving            $M        278         278        1,018
       Net Wastewater Infrastructure Capital Saving          $M        470        1,174       2,349
       Total Capital Investment Saving                       $M        747        1,452       3,367
       Potable Water Saving                                  GL        127         318         636
       Households Served                                     No.     68,560      171,402     342,803
       Population Served                                     No.     150,833     377,080     754,167
       Proportion of the Population Served                    %        4.3        10.8         21.5
       SOURCE: ACIL ALLEN

Decentralised third pipe systems separate the supply of water for potable use and water for non-
potable use. As the production costs for water treated to the appropriate non-potable use standard
are lower than the cost of treating water to potable standards, by separating the water supply into
potable and non-potable streams, it is possible to lower household water supply costs. For the
representative household, these savings are likely to be around $68 per year, or a saving of around 10
percent on the average household annual water supply and service bill.
TABLE ES 3     ANNUAL HOUSEHOLD WATER BILL SAVING
  Persons per household       Household non-potable water use per person kL
                                         42 kL               46 kL                 50 kL
               2.2                       $57                  $62                   $68
               2.4                       $62                  $68                   $74
               2.6                       $67                  $73                   $80
SOURCE: ACIL ALLEN

Allowing decentralised wastewater recycling through third pipe systems also has additional benefits,
including:
     i) Allows/unlocks development in areas where there is a shortage or unavailability of
         groundwater, as recycled water can be used to plan and irrigate more liveable green open
         space and gardens.

                                                                                                       iii
          FUTURE OPPORTUNITIES FOR WATER SERVICES IN PERTH FUTURE DEVELOPMENT SCENARIOS
ii) Can enable and promote industry and drive job creation in proximity to the decentralised
scheme.
iii) Allows for water to be returned to the environment to support groundwater dependent
ecosystems in the local area. Estimates of this environmental value suggest that each GL of
water returned to the environment is worth around $0.40 million, annually.
iv) Assists with reducing the urban heat island effect.2
Local wastewater recycling and third pipe re-use has already been adopted in other parts of Australia,
by both state water utilities, for example Sydney Water at the Rouse Hill (NSW) greenfields
development, and private sector utilities, for example Flow Systems at the Pitt Town (NSW) greenfield
development and at the Central Park Sydney infill development. In Western Australia, the Water
Corporation recognises the existence of third pipe (dual reticulation non-drinking water schemes) but
is yet to implement a wastewater recycling third pipe re-use scheme.
The introduction of private sector water service providers will also assist with moving charging in the
water service sector to a more transparent and cost reflective basis. Better costing and pricing of
water supply and services will ultimately lead to more efficient use of an increasingly precious
resource.
The introduction of local wastewater recycling and third pipe re-use in Perth can not only save
taxpayers money and transform Perth into a water sensitive city, but can also help the State
Government meet its stated water recycling policy objective of recycling 30 percent of wastewater by
2030.
This study aims to progress the conversation on transforming Perth into a water sensitive city. The
study starts by examining the future water supply options and demands for a growing Perth, and the
resulting water supply gap projected out to 2050. The study then considers the costs of expanding
Perth’s water supply and service infrastructure under a Business as Usual scenario in comparison to
an alternative delivery model where a certain proportion of new development is serviced by local
wastewater and recycling schemes owned and operated by private sector utilities. Economic savings
to the State Government and potable water usage savings are then presented for different
development and adoption scenarios.
2The urban heat island effect is the warming of urban areas due to the nature of the surfaces and activities that are present in those areas.
This effect can be mitigated through changes in the type of building materials used, and through greening the local environment.
iv
FUTURE OPPORTUNITIES FOR WATER SERVICES IN PERTH FUTURE DEVELOPMENT SCENARIOS1 WATER SUPPLY Water supply
1
1.1 Introduction
Perth’s Integrated Water Supply Scheme (IWSS) serves over 800,000 properties, and annually
delivers almost 300GL of water via almost 14,000km of mains and reticulation pipes. The way water
is supplied to the system has changed dramatically over recent years, and further change is expected.
1.2 Current sources of water
In Perth, scheme water is sourced from dams, groundwater sources, and desalination plants. The
relative importance of each water supply source has changed substantially over recent years. For
example, over the past six years the proportion of Perth’s water sourced from dam infrastructure has
fallen from 45 percent to 7 percent. The proportion of Perth’s water that is sourced from groundwater
resources has remained approximately constant over this period, with growth in desalination supply
replacing dam supply. Specifically, between 2010 and 2016 the proportion of Perth’s water supplied
by desalination has increased from 16 percent to 47 percent (Table 1.1 and Figure 1.1).
TABLE 1.1 SOURCES OF SCHEME WATER (RELATIVE SHARE)
Source 2010 2011 2012 2013 2014 2015 2016
Total hills (dams) output (%) 45 35 26 17 17 17 7
Total groundwater output (%) 39 49 50 49 44 42 46
Total desalination output (%) 16 16 25 34 39 41 47
Total hills (dams) output (ML) 136,337 115,293 81,386 46,786 49,025 49,519 20,100
Total groundwater extraction(ML) 119,656 163,578 157,789 139,622 124,850 122,127 136,879
Total desalination output (ML) 47,693 52,010 78,847 95,770 113,060 119,457 138,645
SOURCE: WATER CORPORATION ANNUAL REPORTS, VARIOUS YEARS
NOTE: TOTAL WATER SUPPLIED INCLUDES BULK WATER EXPORTED OUT OF THE METROPOLITAN REGION. AS SUCH TOTAL WATER PRODUCTION
IS GREATER THAN TOTAL WATER USE IN THE GREATER METROPOLITAN AREA.
1
FUTURE OPPORTUNITIES FOR WATER SERVICES IN PERTH FUTURE DEVELOPMENT SCENARIOSFIGURE 1.1 SCHEME WATER SUPPLY SHARES: 2010 AND 2016
2010 2016
Dams
Desalination Dams 7%
16% 45% Desalination
47%
Ground Ground
water water
39% 46%
SOURCE: WATER CORPORATION ANNUAL REPORTS, VARIOUS YEARS
In GL terms, water from dams has fallen from 136GL in 2010 to 20GL in 2016, while over this same
period desalination output has increased 190 percent from 48GL to 139GL. The level of water
supplied from different sources is shown in Figure 1.2.
FIGURE 1.2 INTEGRATED WATER SUPPLY SCHEME WATER: BY SOURCE
350,000
Desalination Groundwater Dams
Total water supplied via IWSS (ML)
300,000
250,000
200,000
150,000
100,000
50,000
-
2010 2011 2012 2013 2014 2015 2016
SOURCE: WATER CORPORATION ANNUAL REPORTS, VARIOUS YEARS
1.3 Future sources of water
1.3.1 Surface water
The proportion of water sourced from dams has fallen significantly over the past six years. At the
same time the total water storage level in Perth’s dam infrastructure has fallen from 35 percent to 24
percent; or in GL terms, the fall in storage has been from 216GL in 2010 to 138GL in 2016.3 That
both the amount of water sourced from dams and dam storage levels have fallen is due to lower
rainfall in Perth. There is significant variation in rainfall from year-to-year, but as can be seen from the
decade-by-decade averages shown in Figure 1.3, average rainfall today is much lower than it was in
3 Water Corporation Annual Report (various years).
2
FUTURE OPPORTUNITIES FOR WATER SERVICES IN PERTH FUTURE DEVELOPMENT SCENARIOSthe past. The Mundaring weir dam was originally constructed in 1903, with a major wall height
extension completed in 1951. At the Mundaring Weir weather station the average annual rainfall over
the past decade has been 705 mm. For the first half of the 20th century, i.e. prior to the wall height
extension, average rainfall at the location was 1,097 mm.
FIGURE 1.3 RAINFALL TRENDS IN DAM CATCHMENT AREAS
1800
1600
Perth Rainfall (mm) 1400
1200
1000
800
600
400
200
annual rain decade average
0
1900
1904
1908
1912
1916
1920
1924
1928
1932
1936
1940
1944
1948
1952
1956
1960
1964
1968
1972
1976
1980
1984
1988
1992
1996
2000
2004
2008
2012
SOURCE: MUNDARING WEIR WEATHER STATION: BUREAU OF METEOROLOGY STATION NUMBER: 9031
The change in rainfall has had a significant impact on the water flowing into Perth dams, with average
inflows since 2011 averaging less than one third the level prior to 1975.4 It is unlikely that the current
low level of rainfall, and hence low dam inflows will be reversed. Rather, there is a strong consensus
in climate model projections that there will be a further substantial decline in rainfall in the south west
of Western Australia, and the most likely scenario is that dam inflows will continue to fall. The decline
in rainfall, in turn, is expected to have a substantial impact on the availability of drinking water from
dams:
Further, if the rainfall reduces by 40% [from 1990 levels], likely yields would be reduced to
only 25 gigalitres a year. At these levels, dams would cease to be a reliable part of Perth’s
water supply.5
Perth has already seen a 40 percent reduction in annual rainfall in the past 25 years, with records at
the Mundaring Weir weather station showing rainfall falling from 1,032 mm in 1990 to only 614 mm in
2015. For the south west of Western Australia, the CSIRO states that there is “very high agreement of
a substantial decrease” in annual seasonal (June-November) rainfall over the rest of the century,
where very high can be interpreted as implying above 90 percent.6
Water Corporation planning documents, a key input for water planning in Perth, also make it clear that
planning is taking place under the assumption of further substantial reductions in rainfall going
forward, and that surface water will continue to decline in importance as a water supply source.7
The scientific and planning consensus is therefore to expect further rainfall reductions in the future
and so this implies existing dam infrastructure is likely to become an insignificant water supply source
in the near-medium future.
4 Murphy, S (2016) Perth Water Supply – Beyond Compliance, Presentation to UDIA, 28 July 2016.
5 Murphy, S (2016).
6 CSIRO (2015) Climate Change in Australia Technical Report, p. 99; 108.
7 Water Corporation (2009) Water Forever: Towards Climate Resilience.
3
FUTURE OPPORTUNITIES FOR WATER SERVICES IN PERTH FUTURE DEVELOPMENT SCENARIOS1.3.2 Groundwater
Going forward, the proportion of water supplied from existing groundwater sources is also expected to
decline substantially.8 This is due to a combination of lower rainfall, and hence less recharge, and
current groundwater extraction rates being unsustainable. For example, as illustrated in Figure 1.4,
since 2001 the Gnangara mound water level has fallen by over one metre, which is a material
depletion of the resource. Current groundwater extraction rates are therefore unsustainable. That
extraction limits are unsustainable is recognised in existing planning documents, and water supply in
GL from existing groundwater sources in 2050 is expected to be half the level it is today.9
FIGURE 1.4 CHANGE IN WATER LEVEL OF GNANGARA MOUND: 2001 -2014
40
Mean: -1.1m
35
SD: 1.2m
30
Frequency
25
20
15
10
5
0
less -3.2 -2.7 -2.2 -1.7 -1.2 -0.7 -0.1 0.4 0.9 more
Change in water level (m)
Note: Maximum Water level measurements at 162 matching sample pairs
SOURCE: IFTEKAH AND FOGARTY (2016)
Large scale groundwater resources, such as the Yarragadee aquifer, have been reserved for use in
the south west and are not available to augment metropolitan water supply.10 However, some small
new groundwater resources are potentially available, despite overall groundwater extraction levels
being unsustainable.
1.3.3 Climate independent water sources
Over coming decades, groundwater and dam supplies are likely to decrease further, and supply will
increasingly be met from climate independent sources. Under a Business as Usual development
process, it is expected that the main new supply source will be additional desalination capacity, which
will be augmented by centralised groundwater replenishment supply.11 The Economic Regulation
Authority has also acknowledged that future water sources will need to be climate independent.12
The next major supply augmentation in Perth, due to come on stream in 2016, will be the
commissioning of a groundwater replenishment (Aquifer Storage Transfer and Recovery) project. The
project is proceeding in two stages, with each stage delivering around 14GL of water.13
Although the current water supply augmentation project is a water recycling project, the major
additional supply options identified by Water Corporation, under a Business as Usual scenario, are
either new desalination plants or expansions at existing desalination plants. Five desalination projects
8 Water Corporation (2009), p. 7.
9 Water Corporation (2009), p. 7
10 Department of Water (2012) South West groundwater Areas Allocation Plan: Evaluation Statement 2009-2012.
11 Murphy, S (2016) Perth water Supply – Beyond Compliance, Presentation to UDIA, 28 July 2016.
12 Economic Regulation Authority (2013) Inquiry into the Efficient Costs and Tariffs of the Water Corporation, Aqwest and the Busselton
Water Board: Revised Final Report, p. 7.
13 Our State Budget 2015-16 – Investing in infrastructure to grow the State: Groundwater replenishment surges ahead, Press Release
Thursday 21 May 2015.
4
FUTURE OPPORTUNITIES FOR WATER SERVICES IN PERTH FUTURE DEVELOPMENT SCENARIOShave been identified as potential development options, and combined these projects represent
additional supply capacity of between 250GL and 165GL.14 In addition to the existing groundwater
replenishment project, two additional groundwater projects (Woodman Point and Subiaco treatment
plants), with a combined capacity of 26GL, have been identified as potential new supply sources.15
1.4 Summary
The current water supply infrastructure delivers around 300GL of water to the greater Perth area, but
is under stress. Going forward this supply infrastructure will deliver less water due to a combination of
falling inflows into dams and a reduction in future groundwater extraction. Under some realistic
climate change scenarios Perth’s existing dam infrastructure would actually cease to be a reliable part
of the overall water supply infrastructure. Published projections suggest existing groundwater, surface
water, and desalination resources will provide less than 200GL of supply by 2050, and only around
160GL by 2060.16 17
Under a Business as Usual development scenario, the main new supply sources will be new
desalination and centralised water recycling projects. Identified future sources suggest:
― desalination projects could provide 165GL to 250GL
― water recycling projects could provide 54GL18, and
― new groundwater sources could provide 14GL.19
Whilst the cost of bringing on-line new groundwater sources is relative low, there are substantial costs
to the State Government in generating future water supplies from new desalination plants and
centralised recycling projects.
14 Murphy, S (2016) Perth Water Supply – Beyond Compliance, Presentation to UDIA, 28 July 2016.
15 Murphy, S (2016).
16 Water Corporation (2009) Water Forever: Towards Climate Resilience, p. 7.
17 Note that this value includes supply from both desalination plants, and so has added in supply that was not commissioned at the time the
forecast was made to reflect the supply expected from the existing asset base. The figure excludes the supply from managed aquifer
recharge, as this capacity was not yet online at the time of writing.
18 Includes the water recycling contribution of 28GL under construction.
19 Murphy, S (2016) Perth water Supply – Beyond Compliance, Presentation to UDIA, 28 July 2016.
5
FUTURE OPPORTUNITIES FOR WATER SERVICES IN PERTH FUTURE DEVELOPMENT SCENARIOS2 FUTURE WATER
DEMAND Future water demand
2
2.1 Introduction
Total water demand can be calculated as a function of population and per capita water use. As such,
future water demand can be forecast based on population projections and assumptions about the
trajectory for per capita water use.
2.2 Population projections
A number of agencies prepare population projections for Western Australia. Each population
projection scenario involves different assumptions, and over time small differences in assumptions
can lead to quite different population estimates. For example, the Western Australian Planning
Commission (WAPC) has a series of long term population projections for Western Australia that
forecast a population of between 4.3M and 5.2M in 2050;20 while the ABS population projections
suggest a population in Western Australia of between 4.8M and 6.4M in 2050.21
As part of a standalone planning scenario -- Perth and Peel @3.5M -- the WAPC has also prepared
both population and dwelling construction projections for the greater Perth region to 2050. These
projections are detailed in Table 2.1, and as can be seen, they suggest a population in the greater
Perth region of around 3.5M by 2050. The implied compound average population growth rate (CAGR)
for this scenario is 1.7 percent.
TABLE 2.1 POPULATION AND HOUSING GROWTH IN THE GREATER PERTH METROPOLITAN
REGION
Region Pop 2011 Pop 2050 New dwellings
Central region 782,974 1,195,000 215,000
North-West region 322,486 740,300 172,000
North-East region 209,156 450,500 106,000
Southern and Peel region 523,400 1,200,000 305,000
Total relevant growth corridor 1,838,016 3,585,800 798,000
Note: Some of the values are indicated only approximately in the report
SOURCE: PERTH AND PEEL@ 3.5MILLION
20 Western Australian Planning Commission, Population Report No. 9, Long Term Population Forecasts for Western Australia, 2031 to 2061.
21 ABS, Population Projections, Australia. catalogue 3222.0.
6
FUTURE OPPORTUNITIES FOR WATER SERVICES IN PERTH FUTURE DEVELOPMENT SCENARIOSThe ABS also produces population projections for the greater Perth region, and similar to the State
level estimates, the ABS estimates are higher than the WAPC projections and suggest a population of
between 3.9M and 5.4M for greater Perth by 2050.22
Although there is uncertainty surrounding the future population of Perth, the projections detailed in
Table 2.1 are a reasonable basis for framing discussions on what the population of the greater Perth
region might be in 2050. Relative to other population projections, the Table 2.1 projections have the
added advantage of being matched with residential construction estimates. Specifically, over the
period 2011 to 2050, the expected annual average increase in population is 44,815 people, and the
expected annual increase in the housing stock is 20,461 dwellings. The implied number of people per
new dwelling is 2.2.
A ratio of 2.2 people per dwelling, on average, is lower than what has historically been the case, but
the ratio of people to dwellings implied in the Perth and Peel @3.5 projections is consistent with
broader trends in terms of smaller average households, and the infill projections contained in planning
documents.
A further advantage of the Perth and Peel @3.5 projections is that they also contain information on the
expected infill dwelling construction share and the expected new greenfield dwelling construction
share. The expected shares for new dwelling construction are 48 percent infill and 52 percent
greenfield.
Decentralised water supply and recycling systems are possible in both new infill and greenfield
developments, but for greenfield developments such schemes can be completely independent from
existing water supply infrastructure, and require no partnership with any Water Corporation
infrastructure.
TABLE 2.2 EXPECTED FUTURE PERTH DWELLING CONSTRUCTION TO 2050
Region Infill Greenfield Total
Central region 215,000 - 215,000
North-West region 49,000 123,000 172,000
North-East region 40,000 66,000 106,000
Southern and Peel region 76,000 229,000 305,000
Total relevant growth corridor 380,000 418,000 798,000
SOURCE: PERTH AND PEEL @3.5
2.3 Water use efficiency
Over the past decade per capita water use in Perth has fallen by over 15 percent: from 151 kL per
person to 127 kL per person (Figure 2.1).
22 ABS, Population Projections, Australia. catalogue 3222.0.
7
FUTURE OPPORTUNITIES FOR WATER SERVICES IN PERTH FUTURE DEVELOPMENT SCENARIOSFIGURE 2.1 WATER CONSUMPTION PER CAPITA FOR PERTH REGION: 2006-2016
180
160
Per capita Conumption (kl)
140
120
100
80
60
40
20
0
2006 2007 2008 2009 2010 2011 2012 2013 2014 2015 2016
SOURCE: WATER CORPORATION ANNUAL REPORTS, (VARIOUS YEARS)
Although there have been substantial water use efficiency gains over recent years, due to changes
such as outdoor watering restrictions, there is a limit to these gains, and existing gains may not be
sustained. The fact that Perth’s per capita water use in 2016 was higher than per capita water use in
2015 is evidence that efficiency gains may have plateaued. Also, although the Water Corporation has
a target for water demand of 115kL per person in 2050, they also consider scenarios where per
person consumption is181kL in 2050.23
Despite the recent uptick in per capita water use, it is possible that, over time, further modest gains in
water efficiency could be made; but that at some point these gains will be exhausted. The initiatives
that generated substantial gains, such as the outdoor watering restrictions, have already been
implemented. Additional gains will therefore be increasingly difficult to achieve. Figure 2.2 illustrates
this situation. The figure shows a stylised high, low, and mid case trajectory for water use efficiency,
but under all possible trajectories efficiency gains hit a limit at some point. That water use efficiency
gains are exhausted at some point in the future is also an assumption embedded in the Water
Corporation model used to estimate Long Run Marginal Cost.24 So, limited potential for future per
capita water use reductions is not a controversial assumption.
There is also the philosophical debate as to whether the government should be dictating how people
use water, particularly for gardens and verges, where there is a willingness to pay for supply. A
general availability of local recycled wastewater for such uses would only highlight this issue further.
Water Corporation (2009) Water Forever: Towards Climate Resilience.
23
Economic Regulation Authority (2013) Inquiry into the Efficient Costs and Tariffs of the Water Corporation, Aqwest and the Busselton
24
Water Board: Revised Final Report, p. 67.
8
FUTURE OPPORTUNITIES FOR WATER SERVICES IN PERTH FUTURE DEVELOPMENT SCENARIOSFIGURE 2.2 WATER USE EFFICIENCY: PER CAPITA STYLISED HIGH, LOW, AND MID WATER USE
TRAJECTORIES
Water (kL)
160
150
140
130
120
110
100
2012
2014
2016
2018
2020
2022
2024
2026
2028
2030
2032
2034
2036
2038
2040
2042
2044
2046
2048
2050
2052
2054
2056
2058
2060
SOURCE: ACIL ALLEN
2.4 Future total water demand
If population projections are combined with per capita water use information it is possible to derive
estimates of total water demand for Perth. For example, as shown in Table 2.3, if we assume a
population of 3.5M in 2050, and average annual per capita water use of 125kL, total Perth water
demand is 438GL per annum. Alternatively, using a population of 3.9M, which is the lower bound of
the ABS population projection series, and average per capita water use of 125kL, total water demand
is 488GL per annum.
TABLE 2.3 POSSIBLE PERTH WATER DEMAND SCENARIOS TO 2050
Population Annual water use per person kL
120 kL 125 kL 130 kL
3,100,000 (1.32% CAGR) 372 GL 388 GL 403 GL
3,500,000 (1.67% CAGR) 420 GL 438 GL 455 GL
3,900,000 (1.99% CAGR) 468 GL 488 GL 507 GL
SOURCE: ACIL ALLEN
Different assumptions about population growth and per capita water use necessarily imply different
estimates of future water demand. The water demand values in Table 2.3 are, however, reasonable
values to use for planning purposes, and may be conservative. For example, the implied population
growth rate and water use values used to derive these estimates are lower than the values used in the
most recent regulatory assessment of water demand for Perth (Table 2.4). Higher population growth
would result in an increase in the water supply requirement. For example, a simple projection based
on a continuation of the values used in the regulatory assessment implies Perth water demand in
2050 of around 562GL.
9
FUTURE OPPORTUNITIES FOR WATER SERVICES IN PERTH FUTURE DEVELOPMENT SCENARIOSTABLE 2.4 RECENT REGULATORY PERIOD DEMAND FORECASTS
Metropolitan customers 2012/13 2013/14 2014/15 2015/16
Water customer growth (%) 2.0% 2.1% 2.2% 2.3%
Wastewater customer growth (%) 2.2% 2.3% 2.3% 2.4%
Water consumption per person per year (kL) 140kL 139kL 138kL 137kL
SOURCE: ERA (2013) INQUIRY INTO THE EFFICIENT COSTS AND TARIFFS OF THE WATER CORPORATION, AQWEST AND THE BUSSELTON WATER
BOARD: REVISED FINAL REPORT
Total water demand can be decomposed in several ways, for example potable demand versus non-
potable demand; residential demand versus non-residential demand, etc. In Perth, outdoor use of
water is significant, with studies suggesting outdoor water use accounts for approximately half of all
total water use.25 26 Within the category of outdoor use the main use is irrigation.27 In-house
residential demand consists of a combination of potable uses (drinking, cooking, showering) and non-
potable uses (toilet flushing, washing machines). The quality requirements for non-potable water are
lower than the scheme water quality required for in-house potable use.
Although now somewhat dated, the detail from the Department of Water survey on water use is shown
in Table 2.5. These volumes relate only to residential water demand and exclude non-residential water
demand for purposes such as irrigating public open space (see Section 2.6 below).
TABLE 2.5 HOUSEHOLD WATER USE SURVEY: 2008/09
Use category kL per person per year
Indoor
Shower and bath 27
Toilet 10
Washing machine 8
Taps 6
Evaporative air-conditioner 4
Dishwasher 1
Total indoor use 56
Outdoor
Hand watering 3
Pool and spa 2
Irrigation 41
Total outdoor use 46
Private plumbing leaks 4
Total household water use 106
SOURCE: WATER CORPORATION (2009A)
Current Business as Usual infrastructure planning is based on supplying 100 percent of total
household water demand with potable scheme water, whereas in reality household potable demand is
less than half total demand. At the same time, the marginal cost of supplying new potable water is
high, driven by the costs of supply from desalination. The possibility of designing and planning a
future Perth metropolitan potable scheme water scheme to service and specifically meet only potable
water demands -- i.e. not to use potable water for non-potable demand -- presents an opportunity to
improve on both the water cycle efficiency and infrastructure costs of Perth’s water planning model.
25 Syme, G. J., Shao, Q., Po, M., & Campbell, E. (2004) Predicting and understanding home garden water use. Landscape and Urban
Planning, 68(1), 121-128.
26 Department of Water (2009) Perth Residential Water Use Study, 2008/2009, Perth, WA, Government of Western Australia.
27 Department of Water (2009).
10
FUTURE OPPORTUNITIES FOR WATER SERVICES IN PERTH FUTURE DEVELOPMENT SCENARIOS2.5 Supply demand gap
The supply demand gap in 2050 can be calculated by subtracting the supply that existing
infrastructure is expected to deliver in 2050 from the water demand projections contained in Table 2.3.
This supply gap is shown in Table 2.6, and as can be seen from the table, for the central case of a
population of 3.5M and annual per capita water use of 125kL, the annual water supply gap in 2050 is
around 238GL per annum – or equivalent to 95,200 Olympic size swimming pools per year.
Depending on the assumptions made, the future supply gap could be as low as 172GL or as high as
307GL per annum.
TABLE 2.6 PERTH METROPOLITAN WATER SUPPLY GAP PER ANNUM: POSSIBLE SCENARIOS
Population Annual water use per person
120 kL 125 kL 130 kL
3,100,000 (1.32% CAGR) 172 GL 188 GL 203 GL
3,500,000 (1.67% CAGR) 220 GL 238 GL 255 GL
3,900,000 (1.99% CAGR) 268 GL 288 GL 307 GL
SOURCE: ACIL ALLEN
Under the Business as Usual development scenario, the main new desalination and water recycling
projects identified by Water Corporation could deliver 219GL up to 304GL of new supply, and new
groundwater sources could deliver an additional 14GL of supply. Identified potential supply
development options are therefore consistent with the expected supply gap to 2050 and the costs of
these Water Corporation infrastructure options should be considered as the likely required State
Government expenditure in a Business as Usual scenario.
2.6 Public open space and additional demand
Developers are required to provide 10 percent public open space (POS) as part of any development,
which is then vested with the Crown (effectively local councils) via the provisions of Section 152 of the
Planning and Development Act (2005). Historically, groundwater has been used to irrigate and
maintain active use public open space. However, as shown in Figure 2.3 and Figure 2.4, groundwater
resources in many potential greenfield development areas are either fully allocated or over allocated.28
Where groundwater, or other non-potable sources of water are not available to deliver the public open
space requirement, developers may need to access scheme water for POS irrigation. For developers,
historically it has been relatively easy to access drinking water to irrigate parks and gardens if Water
Corporation Integrated Water Supply Scheme (IWSS) infrastructure is already in the area, albeit there
is an argument about whether such high quality water should be generated and supplied for such
purposes.
The accepted irrigation rate for active use land is 7,500kL per year,29 but not all public open space has
a water requirement, and various allowances are made when calculating the public open space
requirement for any given development. As such, it is worth illustrating the public open space
calculations for a stylised development.
Table 2.7 provides details for a stylized 200 ha development, and shows that for a 200 ha
development the public open space allocation to high water demand land uses, such as playing fields
and recreation areas, might only be around 12 to 13 ha. So, the ten percent public open space
requirement does not mean it will be necessary to irrigate ten percent of the development area, but
the requirement does means that developers will typically need to find water to irrigate around five to
six percent of the development area.
28 Department of Water (2014). North West corridor water supply strategy. Perth, WA, Government of Western Australia.
29 Department of Water(2014). North West corridor water supply strategy. Perth, WA, Government of Western Australia.
11
FUTURE OPPORTUNITIES FOR WATER SERVICES IN PERTH FUTURE DEVELOPMENT SCENARIOSFIGURE 2.3 WATER AVAILABILITY AND DEVELOPMENT AREAS: NORTHERN FOCUS
SOURCE: DEPARTMENT OF WATER
12
FUTURE OPPORTUNITIES FOR WATER SERVICES IN PERTH FUTURE DEVELOPMENT SCENARIOSFIGURE 2.4 WATER AVAILABILITY AND DEVELOPMENT AREAS: SOUTHERN FOCUS
SOURCE: DEPARTMENT OF WATER
13
FUTURE OPPORTUNITIES FOR WATER SERVICES IN PERTH FUTURE DEVELOPMENT SCENARIOSTABLE 2.7 CALCULATING THE PUBLIC OPEN SPACE REQUIREMENT FOR A DEVELOPMENT
Details Value
Total site (ha) 200
Land allocated to all non-development purposes (ha) 27.8
Gross Subdivisible Area (total site area minus land allocated to other activities) 172.2
Required Public Open Space (10%) 17.2
Claimed restricted use PoS @ max 20% rate as a contribution to PoS requirement 3.4
Total additional PoS requirement: comprised of: 13.8
- Sport 5.7
- Recreation 6.6
- Nature 1.5
Total contribution 17.3
SOURCE: DEPARTMENT OF PLANNING (2015) LIVEABLE NEIGHBOURHOODS
It is also possible to think of the water for public open space in terms of a per capita or per household
requirement. For example, if we use the currently accepted water irrigation rate for active public open
space of 7,500kL per ha, assume an irrigation rate of half this for other recreation space, and no
irrigation requirement for nature space, the annual POS water requirement for the development
described in Table 2.7 is 67,500kL. Given a historical development density of ten properties per gross
developable area,30 and assuming a per house population of 2.4, the implied per person POS
requirement for the development is around 14kL per person per year.
For groundwater constrained development sites the default option available to developers is to meet
the irrigation requirement for public open space with scheme water. This additional water demand has
not been considered in planning scenarios, or the calculations presented in Table 2.6, and this
demand could be large. For example, if it is assumed that the new suburban greenfield dwellings
have 2.4 people per dwelling, and that half these developments are in water constrained areas, the
additional annual demand on scheme water to meet public open space requirements would be around
7.0GL to 7.5GL.
The price charged by Water Corporation, to a developer or council, to supply potable water to meet
POS demand, may also be below the marginal cost to supply this water. This is particularly the case
for greenfield frontal developments. In such a case, any reduction in potable water usage in both
homes and for POS can provide a substantial saving or avoided cost to the Water Corporation and the
State.
Local wastewater treatment and recycling schemes can provide generous amounts of secure, cost
effective fit-for-purpose water to irrigate parks, gardens and verges – allowing developments to look
green with the feel and amenity expected by residents. This contrasts with the recent calls by the
Water Corporation to restrict developers and impact residents by removing grass from verges in order
to save water.31 32 In reality, there could be an adequate supply of fit-for-purpose water available to
irrigate verges and other POS if local wastewater treatment and recycling schemes are adopted in
new urban developments.
2.7 Summary
Perth’s population is expected to increase substantially by 2050. Due to climate change, Perth’s
existing water supply infrastructure will supply less water in 2050 than it does today. There is also a
limit to the water efficiency gains that can be achieved going forward. If population projections for
Perth are combined with reasonable estimates of future per capita water consumption and projections
for the volume of water that will be delivered from existing water infrastructure, it is clear that there is a
30 WAPC (2015) Perth and Peel@3.5million, Western Australian Planning Commision.
31 Treadgold T. (2016) “Water pressure highlights competing priorities” Business News: Western Australia, 16 August 2016.
32 Murphy S. (2016) “Planning, efficient use vital for water” Business News: Western Australia, 29 August 2016.
14
FUTURE OPPORTUNITIES FOR WATER SERVICES IN PERTH FUTURE DEVELOPMENT SCENARIOSlarge water supply gap in the coming decades. Different assumptions suggest different outcomes for
this supply gap. If further meaningful water efficiencies can be achieved, and population growth is
low, the supply gap by 2050 could be as low as 180GL per annum. A supply gap of this size is equal
to more than 60% of current water supply. On the other hand, if population growth is relatively high,
and there is some stabilisation or reversal in the recent water efficiency gains, due, for example, to the
use of potable water to maintain POS in groundwater constrained development areas, the supply gap
by 2050 could be greater than 300GL per annum. A supply gap of this size is greater than the total
current water supply for Perth.
15
FUTURE OPPORTUNITIES FOR WATER SERVICES IN PERTH FUTURE DEVELOPMENT SCENARIOS3 WATER
INFRASTRUCTURE
COSTS AND
DELIVERY Water infrastructure co sts and deliver y
3
3.1 Introduction
With an understanding of the likely future water demand, it is then possible to consider the best way to
deliver Perth’s future water supply requirement. This process involves understanding recent water
supply investment costs, the cost of future development under a Business as Usual scenario, and the
advantages and disadvantages of alternative supply development options.
3.2 Recent trends in water supply investment and costs
Desalination, the main growth source in the water supply portfolio, is associated with both relatively
high capital costs, and relatively high operating costs. Reflecting this, both per property water charges
to residents and debt levels at Water Corporation have increased substantially in recent years. For
example, between 2006 and 2016 Water Corporation’s long term debt increased almost fourfold, from
$1.4 billion to $5.8 billion (Figure 3.1); operating costs per property have increased by 66 percent,
from $479 per property to $796 per property; and total costs per property have increased by 50
percent, from $1,329 per property to $2,004 per property (Figure 3.2). Each new substantial supply
augmentation from desalination involves both further substantial capital investment and a further
increase in operating costs. For example, the short run marginal cost of supplying water from
desalination sources is about five times the cost of water supplied from dams.33
Economic Regulation Authority (2009) Inquiry into the Efficient Costs and Tariffs of the Water Corporation, Aqwest and the Busselton
33
Water Board: Revised Final Report, p. 193.
16
FUTURE OPPORTUNITIES FOR WATER SERVICES IN PERTH FUTURE DEVELOPMENT SCENARIOSFIGURE 3.1 LONG-TERM DEBT OF WATER CORPORATION ($M)
7,000
6,000
5,000
4,000
3,000
2,000
1,000
-
2006 2007 2008 2009 2010 2011 2012 2013 2014 2015 2016
SOURCE: WATER CORPORATION ANNUAL REPORTS (VARIOUS YEARS)
FIGURE 3.2 CHANGE IN WATER CORPORATION PER PROPERTY COSTS ($)
2,500
Operating cost per property ($)
Total cost per property ($) 2,004
2,000
$ per property
1,500
…
1,000
796
500
479
-
2006 2007 2008 2009 2010 2011 2012 2013 2014 2015 2016
SOURCE: WATER CORPORATION ANNUAL REPORTS (VARIOUS YEARS)
Although groundwater replenishment is now also part of the future supply mix, the long run marginal
cost of water supplied through groundwater replenishment is approximately the same as that supplied
through desalination.34
3.3 Future potable water supply costs
There are several approaches that can be used to understand the future cost of water supply
infrastructure investment. The approaches considered here are long run marginal cost and the capital
cost associated with recent supply augmentation projects.
34 Water Corporation (2009) Water Forever: Towards Climate Resilience, p. 24.
17
FUTURE OPPORTUNITIES FOR WATER SERVICES IN PERTH FUTURE DEVELOPMENT SCENARIOS3.3.1 Long run marginal cost
Long run marginal cost (LRMC) is one way of understanding the likely future costs of water supply.
The long run marginal cost (LRMC) is the cost of providing an additional unit of service over a long-term
time horizon where capital or physical infrastructure can be varied to meet changes in the supply and
demand balance. A long-term perspective takes into account the cost of long-term investments in assets
used to provide water services.35
In 2015/16 dollars, the estimates of the long run marginal cost for water supply for Perth range from
$1.49 to $3.11 per kL, with a central estimate of $2.06.36 In broad terms the estimate is sensitive to
the:
― rainfall assumption
― population growth and location assumptions
― water use assumptions, and
― energy cost assumptions.
When average rainfall is low, new supply sources are added more quickly. As new supply sources
are costly to develop, this increases LRMC. The base case for the above LRMC estimates assume
average rainfall over the next 100 years equal to the 2001 to 2010 period. The evidence surrounding
changes in rainfall for the southwest of Western Australia has increased in recent years, and the
consensus is now that we should expect further reductions in rainfall over the next 100 years. As a
result, the above estimates for LRMC are likely to be too low and the actual LRMC higher.
When population growth is faster than expected, new supply sources are added sooner, and this
works to increase the LRMC. The base case values cited above assume a population of 3.1M for the
Perth Mandurah region in 2060. This is less than the populations projections contained in recent
scenario planning documents, such as Perth and Peel @3.5M, so if the recent population projections
are realised this will result in an increase in LRMC.
The LRMC base case also assumes that per capita water demand, in the long run, falls to 110kL per
year. If per capita water use remains above 110kL per person, then water supply augmentation needs
to be brought forward, resulting in an increase in the LRMC. Conversely, if per capita water
consumption falls below this level LRMC would fall.
For the Perth and Peel @3.5M planning scenario, and given the latest information available on climate
change, it is reasonable to expect that the LRMC of additional water supply for Perth, going forward,
will lie in upper half of the current estimated distribution range, which would be $2.06 to $3.11 per kL,
or higher.
In terms of the impact of new water supply projects on LRMC estimates, it is instructive to note the
extent of the escalation in estimates of LRMC as it has become clear that climate independent
sources will dominate the future supply mix for Perth. For example, in 2005, inflated to current dollars,
the range for the upper and lower bound to LRMC was $1.02 to $1.50 per kL.37 So, in real terms, the
LRMC estimate of additional water supply in Perth has doubled over the past decade. It is reasonable
to assume that this trend of increasing LRMC will continue as the proportionate supply from dams and
groundwater decreases, and the supply from desalination and groundwater recharge increases.
3.3.2 Capital costs
Another way to understand the cost of developing new water supply sources is to look at the capital
cost of recent major supply augmentation activities. Stage one of the Southern Seawater Desalination
Plant came online in 2011, and cost $950M to develop.38 Stage two came online in 2013 and cost
$450M to develop.39 In 2015 this plant provided 73GL of supply.40 The name plate capacity of the
35 Economic Regulation Authority (2013) Inquiry into the Efficient Costs and Tariffs of the Water Corporation, Aqwest and the Busselton
Water Board: Revised Final Report, p. 66
36 Economic Regulation Authority (2013), p. 69
37 Economic Regulation Authority (2009) Inquiry into the Efficient Costs and Tariffs of the Water Corporation, Aqwest and the Busselton
Water Board: Revised Final Report, p. 24.
38 Hon Bill Marmion, 2 September 2011 Press Release: Southern Seawater Desalination Plant, opened three months early.
39 Hon Colin Barnett and Hon Bill Marmion, 23 January 2013 Press Release: First seawater through expanded desal plant.
40 Water Corporation Annual report (2015) Water Corporation Annual Report 2015.
18
FUTURE OPPORTUNITIES FOR WATER SERVICES IN PERTH FUTURE DEVELOPMENT SCENARIOSplant is 100GL. If name plate capacity is considered, the capital cost of desalination augmentation
was around $14M per GL; while if actual water supplied is used the capital cost of the supply
augmentation is around $19M per GL.
For groundwater recharge, as the stage one development at Beenyup involved the construction of a
trial plant, along with many years of development studies and work, it is difficult to determine the full
cost of the stage one development. The second stage of the development, which will have annual
capacity of 14GL, will process as a single development and is expected to cost $232M.41 As such, for
groundwater replenishment, the indicative capital cost is around $16.5M per GL.
The other main cost associated with Business as Usual expansion of Perth’s water supply network is
the extension of water mains. Over the past five years, on average 17.7 metres of mains have been
added for every additional household connected to scheme water.42 The cost of main pipe varies with
diameter. At the upper end of the spectrum would be the Goldfields pipeline, where replacing a six
kilometre section of pipe cost $14M.43 At the other extreme would be a project such as the pipeline
between Albany and Mount Barker, where 26km of pipe was replaced for $10M.44
In the metropolitan area the 1.3km section of mains along Marmion Avenue to supply the suburbs of
Alkimos and Eglinton cost $3.12M,45 and the 4.0km section of mains in Byford cost $5.3M.46 So,
averaged across these two projects the cost of water supply mains is then $8.42M/5.3km = $1,589 per
metre. Since 2010, 83,452 households have been connected to Perth’s water supply, and based on
Water Corporation annual reports the mains network has increased from 12,997km to 13,850km.47
This implies that 10.2 metres of main have been added for every connection. Although the values are
listed as mains in the annual reports, it is more likely the values reported by Water Corporation reflect
a combination of trunk mains, distribution mains, and reticulation pipes. A 2013 audit identified trunk
and distribution lines in the metropolitan area as comprising 14.9 per cent of the total network. At the
time, the estimated replacement value of trunk and distribution mains in the metropolitan area was
$955 per metre, and the estimated replacement value of reticulation pipes was $264 per metre; with
the total replacement value of all Water Corporation pipes in the metropolitan area thought to be $11.7
billion.48
There are several approaches that can be used to calculate the average cost per connection. If the
value of 10.2 metres reflects both the growth in the mains and reticulation network per connection,
depending on the assumptions made, the range for pipeline capital expenditure per connection is
between $3,890 and $6,233.49 Some of this cost is recouped through water headworks charges that
the Water Corporation charges developers, although standard headworks charges currently collected
by the Water Corporation are only $2,150 per connection.
Under a Business as Usual development scenario, not only will there be a significant capital
investment requirement to develop future supply sources, there will also be a significant capital
investment requirement to connect these new homes to the network. In contrast, decentralised
systems can reduce the size of required potable water infrastructure and drive savings in the State
investment required to develop future potable water supplies. Decentralised private sector schemes
can also reduce the State investment in wastewater transport and treatment infrastructure. Further, if
these schemes include potable water, they can reduce the capital costs that the State would otherwise
incur to network potable water to these homes.
41 Young, E.(2016) Treated sewage to entre Perth drinking water by end of year, WAToday.com.au, 15 July 2016.
42 Water Corporation (various) Water Corporation Annual Reports, various years.
43 Water Corporation (2014) Water Corporation Annual Report 2014, p. 20.
44 Water Corporation (2014), p. 20.
45 Hon Mia Davies, 24 July 2015 Press Release: New water main for Alkimos and Eglinton.
46 Hon Mia Davies, 27 July 2015 Press Release: New water main to cater for growth in Byford.
47 Water Corporation (various) Water Corporation Annual Reports, various years.
48 Office of the Auditor General (2014) Water Corporation: Management of Water Pipes, p. 12.
49 Using the replacement value data from the Auditor General report, the average cost per metre of each connection can be found by
multiplying the implied per metre replacement cost for pipes of different type, by the relative share of the network for each pipe type (mains &
trunk 15% and reticulation 85%), and adjusting for inflation in the construction sector. This calculation gives an estimate of $382 per metre
for network additions. Alternatively, the calculation can be based on the current reported per metre main pipe charge of $1,589, assuming
the ratio of cost between mains and reticulation pipes is as per the Auditor General report ($955 per metre to $264 per metre). This
calculation gives an implied average per metre cost of $611. With 10.2 metres of network added per connection the range of values is then
$3,890 to $6,233, per connection.
19
FUTURE OPPORTUNITIES FOR WATER SERVICES IN PERTH FUTURE DEVELOPMENT SCENARIOSYou can also read