Investment Community Meeting HIMSS Las Vegas 2018 - Marc Naughton Executive Vice President and Chief Financial Officer - Cerner Corporation
←
→
Page content transcription
If your browser does not render page correctly, please read the page content below
Investment Community Meeting
HIMSS Las Vegas - 2018

 Marc Naughton
 Executive Vice President and Chief Financial Officer
 March 7, 2018
Agenda
                        Financial Overview                                           Marc Naughton                                Executive Vice President & Chief Financial Officer

                        Cerner's Imperatives                                         Mike Nill                                    Executive Vice President & Chief Operating Officer

                                                                                     Zane Burke                                   President
                        Marketplace
                                                                                     John Peterzalek                              Executive Vice President, Worldwide Client Relationships

                      Federal Business                                               Travis Dalton                                SVP & General Manager, Federal Government

                                                                                     Jeff Hurst                                   Senior Vice President, Revenue Cycle and President, RevWorks
                      Revenue Cycle
                                                                                     Bill Wing                                    President, Adventist Health

                                                                                     Ryan Hamilton                                Senior Vice President, Population Health
                      Population Health
                                                                                     Don Trigg                                    President, Cerner Health Ventures

                      Closing Comments                                               Brent Shafer                                 Chairman and Chief Executive Officer

                      Q&A                                                            All
                                                                                                                                                                                                                                                2
© Cerner Corporation. All rights reserved. All Cerner trademarks and logos are owned or licensed by Cerner Corporation and/or its affiliates. All other brand or product names are trademarks or registered marks of their respective owners.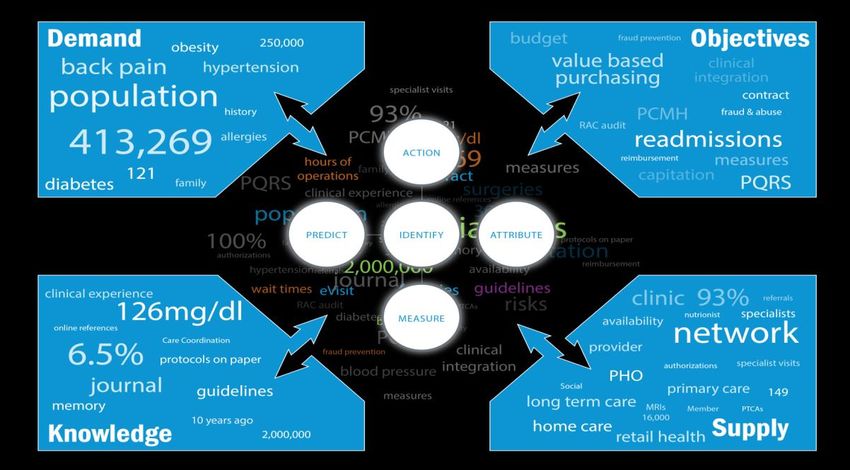
Cautionary Statement Regarding Forward-Looking Statements

This presentation may contain forward-looking statements, including without limitation, those regarding projections of future revenues or
earnings, operating margins, operating expenses, product development, new markets or prospects for Cerner’s solutions or services. These
forward-looking statements are based on the current beliefs, expectations and assumptions of Cerner's management with respect to future events
and are subject to a number of significant risks and uncertainties. Cerner’s performance, and actual results, financial condition or business could
differ materially from those expressed in such forward-looking statements. Factors that could cause or contribute to such differences include, but
are not limited to:
          (a) the possibility of significant costs and reputational harm related to product-related liabilities; (b) potential claims for system errors and warranties; (c) the possibility of
          interruption at our data centers or client support facilities; (d) the possibility of increased expenses, exposure to legal claims and regulatory actions and reputational
          harm associated with a cyberattack or other breach in our IT security; (e) our proprietary technology may be subject to claims for infringement or misappropriation of
          intellectual property rights of others, or may be infringed or misappropriated by others; (f) potential claims or other risks associated with relying on open source software
          in our proprietary software, solutions or services; (g) material adverse resolution of legal proceedings; (g) risks associated with our global operations; (h) risks
          associated with fluctuations in foreign currency exchange rates; (i) the potential for tax legislation initiatives that could adversely affect our tax position and/or challenges
          to our tax positions in the United States and non-U.S. countries; (j) the uncertainty surrounding the impact of the United Kingdom’s vote to leave the European Union
          (commonly referred to as Brexit) on our global business; (k) risks associated with our recruitment and retention of key personnel; (l) risks related to our dependence on
          strategic partners and third party suppliers; (m) difficulties and operational and financial risks associated with successfully completing the integration of the Cerner
          Health Services (formerly Siemens Health Services) business into our business or the failure to realize the synergies and other benefits expected from the acquisition;
          (n) risks inherent with business acquisitions and combinations and the integration thereof; (o) the potential for losses resulting from asset impairment charges; (p) risks
          associated with volatility and disruption resulting from global economic or market conditions; (q) managing growth in the new markets in which we offer solutions, health
          care devices or services; (r) risks inherent in contracting with government clients; (s) risks associated with our outstanding and future indebtedness, such as compliance
          with restrictive covenants, which may limit our flexibility to operate our business; (t) changing political, economic, regulatory and judicial influences, which could impact
          the purchasing practices and operations of our clients and increase costs to deliver compliant solutions and services; (u) government regulation; (v) significant
          competition and our ability to quickly respond to market changes and changing technologies and to bring competitive new solutions, devices, features and services to
          market in a timely fashion; long sales cycles for our solutions and services; (w) variations in our quarterly operating results; (x) potential variations in our sales forecasts
          compared to actual sales; (y) volatility in the trading price of our common stock and the timing and volume of market activity; and (z) our directors’ authority to issue
          preferred stock and the anti-takeover provisions in our corporate governance documents.

Additional discussion of these and other risks, uncertainties and factors affecting Cerner's business is contained in Cerner's filings with the
Securities and Exchange Commission. The reader should not place undue reliance on forward-looking statements, since the statements speak
only as of the date that they are made. Except as required by law, Cerner undertakes no obligation to update forward-looking statements to reflect
changed assumptions, the occurrence of unanticipated events or changes in our business, results of operations or financial condition over time.
A reconciliation of non-GAAP financial measures discussed in this presentation can be found in the Appendix to this presentation and Cerner’s
most recent earnings release that was furnished to the SEC and posted on the investor section of www.cerner.com.                                3
© Cerner Corporation. All rights reserved. All Cerner trademarks and logos are owned or licensed by Cerner Corporation and/or its affiliates. All other brand or product names are trademarks or registered marks of their respective owners.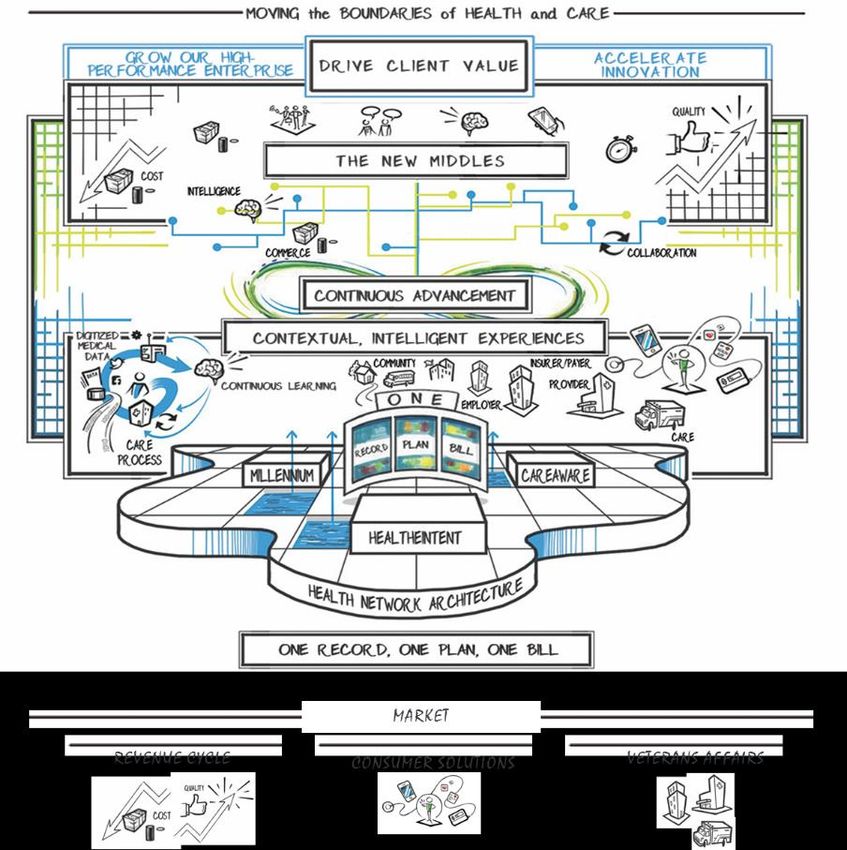
Cerner – at the Intersection of Health Care and IT
Founded in 1979
     • Largest employer in Kansas City
Largest stand-alone health care IT company in world
     • Clients in 30 countries
     • 70 of top 100 health systems have Cerner footprint
     • 26,000 associates world wide
History of innovation and organic growth
     • $700M+ annual R&D investment
       • 6,000+ person IP organization
       • Over 2,000 clinicians
       • ~400 patents
     • 13% 10-year revenue CAGR and 19% Adjusted EPS* CAGR
Diversified, highly recurring revenue
                                                                                                                                                                                                                                                * Adjusted EPS reflects adjustments compared to results
     • Clinical and Revenue Cycle solutions and services across continuum of care                                                                                                                                                               reported on a U.S. Generally Accepted Accounting
                                                                                                                                                                                                                                                Principles (GAAP) basis in our 2017 annual report on Form

     • Cloud platform for population health                                                                                                                                                                                                     10-K. Non-GAAP results should not be substituted as a
                                                                                                                                                                                                                                                measure of our performance but instead should be used

     • License, SaaS, Subscriptions, Support, Managed Services and other Tech-Enabled
                                                                                                                                                                                                                                                along with GAAP results as a supplemental measure of
                                                                                                                                                                                                                                                financial performance. Please see the Appendix for a
                                                                                                                                                                                                                                                reconciliation of these items to GAAP results.
       Services
                                                                                                                                                                                                                                                                                              4
© Cerner Corporation. All rights reserved. All Cerner trademarks and logos are owned or licensed by Cerner Corporation and/or its affiliates. All other brand or product names are trademarks or registered marks of their respective owners.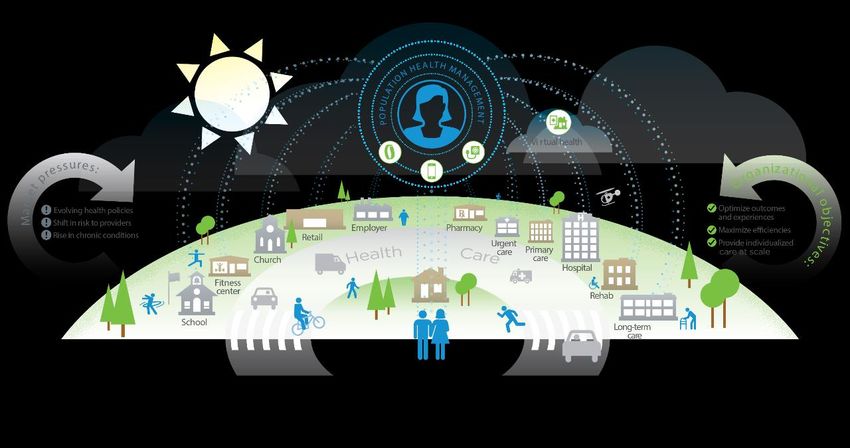
Financial Highlights
$2.50
YTD $5,000 Revenue
Revenue ($ Millions)
Top Line 2016 Growth 2017 Growth Adjusted Diluted EPS $2.00
$4,000
Bookings $ 5,446 0% $ 6,325 16% $1.50
$3,000
EPS
Revenue $ 4,796 8% $ 5,142 7%
$2,000 $1.00
Revenue Backlog $ 15,927 12% $ 17,545 10%
$1,000 $0.50
Bottom Line
Adjusted Operating Earnings* $ 1,133 5% $ 1,150 1% $0 $0.00
2008 2009 2010 2011 2012 2013 2014 2015 2016 2017
Adjusted Operating Margin* 23.6% 22.4%
Adjusted Diluted EPS* $ 2.30 9% $ 2.38 4% $1,400
Balance Sheet & Cash Flow $1,200
Operating Cash Flow
$’s in Millions
Cash and Investments $ 466 -32% $ 1,003 115% $1,000
Free Cash Flow*
Cash used for Share Repurchases $ 700 103% $ 173 $800
Days Sales Outstanding 69 -14% 72 5% $600
$400
Debt $ 564 -7% $ 527 -7%
$200
Operating Cash Flow $ 1,246 31% $ 1,308 5%
$0
Free Cash Flow* $ 493 54% $ 671 36% 2008 2009 2010 2011 2012 2013 2014 2015 2016 2017
Dollars in millions except for EPS FCF = Operating CF less Capital Expenditures and Capitalized Software
* Adjusted operating earnings, adjusted operating margin, adjusted diluted earnings per share and free cash flow reflect adjustments compared to results reported on a U.S. Generally Accepted Accounting Principles (GAAP) basis in our 2017 annual
report on Form 10-K and most recent Form 10-Q. Non-GAAP results should not be substituted as a measure of our performance but instead should be used along with GAAP results as a supplemental measure of financial performance. Please see the
Appendix for a reconciliation of these items to GAAP results. 5
© Cerner Corporation. All rights reserved. All Cerner trademarks and logos are owned or licensed by Cerner Corporation and/or its affiliates. All other brand or product names are trademarks or registered marks of their respective owners.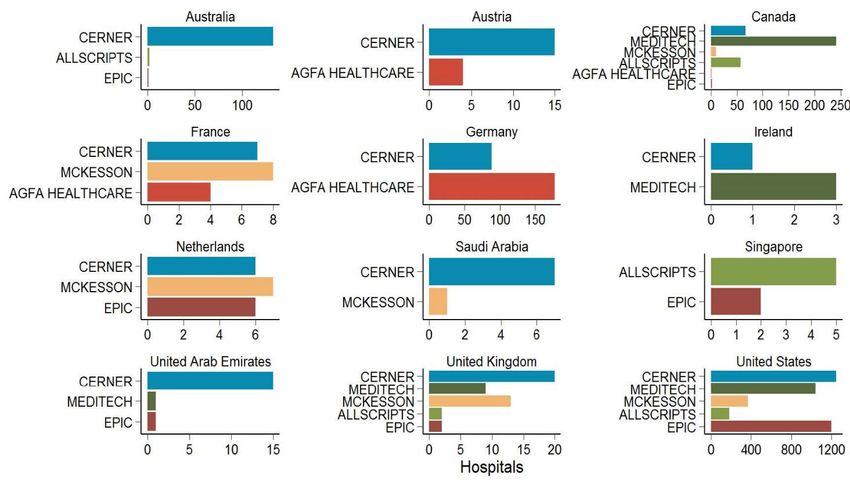
Sales Pipeline                                        Cerner 2017 Business Model
                                                                                    (Dollars in Millions)

                 Bookings                                                                       Contribution Contribution
                  $6,325
                                                              Revenue Streams            Revenue Margin % Margin $
                                                              Licensed Software           $612     92%         $564
                                                                                                                              System
                                                              Technology Resale           $274     16%          $45            Sales
           Revenue Backlog                                    Subscriptions               $469     61%         $285
               $17,545                                        Professional Services     $1,592          28%      $450         Support,
                                                              Managed Services          $1,047          38%      $395       Maintenance
                                                                                                                            and Services
                                                              Support & Maintenance     $1,047          75%      $785

                                                              Reimbursed Travel           $101          0%        $0

                                                              Totals                    $5,142         49.1%    $2,524
* Operating margin reflects adjustments compared to results
reported on a GAAP basis in our 2017 Form 10-K. Non-GAAP
                                                              Indirect Expenses
results should not be substituted as a measure of our         Research and Development                 -11.4%   ($586)
performance but instead should be used along with GAAP
results as a supplemental measure of financial performance.   Selling, General and Administrative      -15.3%   ($789)
Non-GAAP results are used by management along with
GAAP results to analyze our business, make strategic
decisions, assess long-term trends on a comparable basis,
and for management compensation purposes.
                                                              Operating Margin*                        22.4%    $1,150
                                                                                                                                       6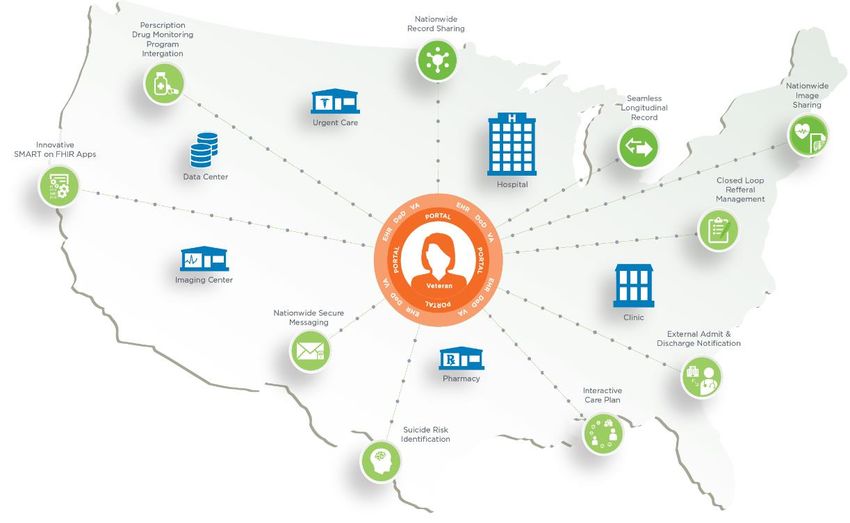
Sales Pipeline                               2017 Compared
                                                            Cerner         to 2016
                                                                   2015 Business Model
                                                                                    (Dollars in Millions)
    RevenueBookings
             up 11% YoY                                                                     Revenue  flat YoY
                                                                                                  Contribution   Contribution
    >35% of total is SaaS                                     Revenue Streams               Contribution
                                                                                         Revenue   Margin margin
                                                                                                            %    ofMargin
                                                                                                                   16% down
                                                                                                                          $ from 20%
            $6,325
                                                              Licensed Software             YoY due to92%
                                                                                          $612         mix of lower margin
                                                                                                                    $564 device
                                                                                            resale                              System
    Revenue up 6%                                             Technology Resale           $274         16%          $45           Sales
    Contribution
        Revenue   Margin of 61%
                     Backlog                                  Subscriptions               $469          61%        $285
    down slightly from 62% YoY
              $17,545
    on third party costs                                      Professional Services     $1,592        28%
                                                                                             Revenue up  10% while $450
                                                                                                                   maintaining Support,
                                                              Managed Services               Contribution
                                                                                        $1,047        38%Margin of $395
                                                                                                                   28%        Maintenance
    Revenue up 7%                                                                                                             and Services
    Contribution margin up to                                 Support & Maintenance     $1,047        75%          $785
    38% from 37% due to
    continued costs leverage                                  Reimbursed Travel           $101          0%          $0
                                                                                              Revenue up 3%
                                                              Totals                    $5,142      49.1%
                                                                                            Contribution        $2,524
                                                                                                         margin of 75% flat YoY
    R&D as % of revenue of 11%
    flat YoY
* Operating margin reflects adjustments compared to results   Indirect Expenses
reported on a GAAP basis in our 2017 Form 10-K. Non-GAAP
    SG&A 15% of revenue, up
results should not be substituted as a measure of our         Research and Development                 -11.4%     ($586)
performance but instead should be used along with GAAP
    from 14% last year
results as a supplemental measure of financial performance.   Selling, General and Administrative      -15.3%     ($789)
Non-GAAP results are used by management along with
GAAP results to analyze our business, make strategic
decisions, assess long-term trends on a comparable basis,
and for management compensation purposes.
                                                              Operating Margin*                        22.4%      $1,150
                                                                                                                                          7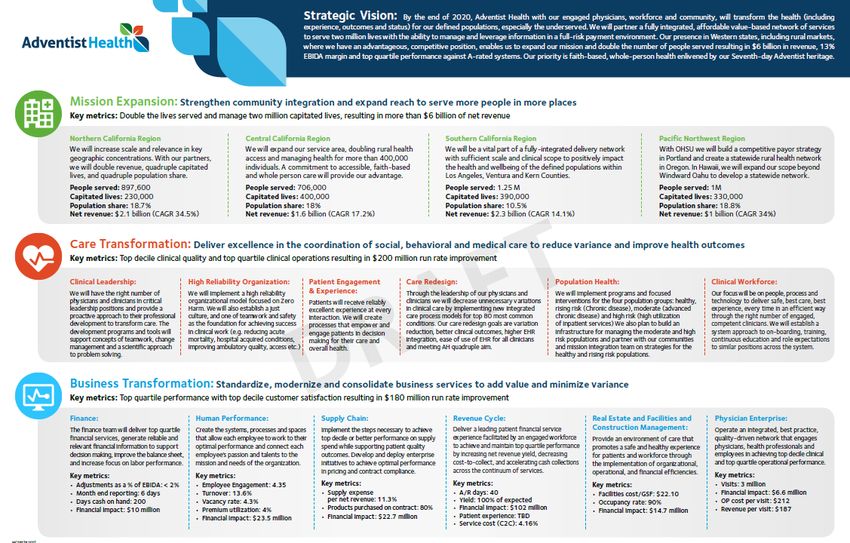
Long-term Growth
• Targeting 7-12% long-term
   growth 2017-2025
               • Up from prior range of 7-
                   11%
               • $8.7B-$12.4B in 2025
               • 9.5% CAGR at midpoint
• Near-term growth expected
   from EHR replacement, VA,
   RevWorksSM, and ITWorksSM
• Population Health important to
   growth 2020-2025
• VA reflected in slightly higher
   expectation for Core growth,
   partially offset by more
   conservative assumptions
   across other areas

                                                                                                                                                                                                                                                8
© Cerner Corporation. All rights reserved. All Cerner trademarks and logos are owned or licensed by Cerner Corporation and/or its affiliates. All other brand or product names are trademarks or registered marks of their respective owners.
Assumptions & Observations
                                                                                                         $63B Non-U.S. addressable market (MarketandMarkets)
                                                                                                         EHR less penetrated than in U.S.
                                                                                                         Presence in 30+ countries; market leader in many

                                                                                                         Good early success at establishing footprints with value proposition that benefits FFS
                                                                                                         and at-risk models
                                                                                                         Average PMPM
Adjusted Operating Margin
• Targeting average increase of 30-60
     basis points per year beginning in 2019
      • 2018
                 • Adjusted Operating Margin expected to
                   drop to
Recurring & Visible Revenue
• 88% of 2017 Revenue recurring or
highly visible
• Up from 86% in 2016 and 83% in 2015
• SaaS now over 35% of total
software
• Works growing as % of Services,
adding to visibility
Type of Revenue Includes 2017 2016 2015
Non-Recurring Traditional Software, Tech Resale 12% 14% 17%
Support, Managed Services,
Recurring 62% 60% 58%
Subsriptions, Works, SaaS
Highly Visible Professional Services 26% 26% 25%
11
© Cerner Corporation. All rights reserved. All Cerner trademarks and logos are owned or licensed by Cerner Corporation and/or its affiliates. All other brand or product names are trademarks or registered marks of their respective owners.Revenue Visibility Trends
Type of Revenue Includes
Non-Recurring Traditional Software, Tech Resale 12%
Support, Managed Services,
Recurring 62%
Subsriptions, Works, SaaS
* Sum of each category may not add to 100% due to rounding
Highly Visible Professional Services 26%
12
© Cerner Corporation. All rights reserved. All Cerner trademarks and logos are owned or licensed by Cerner Corporation and/or its affiliates. All other brand or product names are trademarks or registered marks of their respective owners.Contribution Margin Visibility Trends
* Sum of each category may not add to 100% due to rounding
13
© Cerner Corporation. All rights reserved. All Cerner trademarks and logos are owned or licensed by Cerner Corporation and/or its affiliates. All other brand or product names are trademarks or registered marks of their respective owners.Cash Flow and Balance Sheet
Cash Flow Balance Sheet
• Strong 2017 free cash flow of $671M • $1 billion in cash; $500M debt
• Expect increase in capex in 2018, but • Cash uses include
should be offset by operating cash flow • Repurchases to offset equity
growth compensation dilution plus additional
• Believe total capex (including capitalized amounts as deemed appropriate
software) as % of revenue peaked in 2016 • $173M of repurchases in 2017; nearly
at 16% and should remain at 14% or $900M past two years
below going forward • R&D, technology infrastructure, facilities
• Expect free cash flow as % of GAAP net to support growth
income to be 80% to 95%+ over next • Acquisitions
several years
• Generally not acquisitive, but open to
• Stabilizing capex combined with increased opportunities that add share or
recurring revenue and expected margin accelerate position in strategic growth
expansion position us for visible and areas
strong free cash flow over time
14
© Cerner Corporation. All rights reserved. All Cerner trademarks and logos are owned or licensed by Cerner Corporation and/or its affiliates. All other brand or product names are trademarks or registered marks of their respective owners.2018 Imperatives Mike Nill Executive Vice President and Chief Operating Officer
2018 Imperatives
          • Corporate Imperatives
                          • Grow our High Performance
                            Enterprise
                          • Drive Client Value
                          • Accelerate Innovation
          • Operational Imperatives
                          •       Drive Client Value
                          •       The New Middles
                          •       Continuous Advancement
                          •       Contextual, Intelligent Experiences
                          •       One Record, One Plan, One Bill
          • Market Imperatives
                          • Revenue Cycle
                          • Consumer Solutions
                          • Veterans Affairs

                                                                                                                                                                                                                                                16
© Cerner Corporation. All rights reserved. All Cerner trademarks and logos are owned or licensed by Cerner Corporation and/or its affiliates. All other brand or product names are trademarks or registered marks of their respective owners.
Drive Client Value
• Creating value for our clients, in every single
interaction, is imperative to helping them advance and
sustain their business objectives and improve the
quality of care while lowering the cost at the same
time.
17
© Cerner Corporation. All rights reserved. All Cerner trademarks and logos are owned or licensed by Cerner Corporation and/or its affiliates. All other brand or product names are trademarks or registered marks of their respective owners.The New Middles
• Focused on the inefficient, friction-filled transactions that occur across
healthcare.
• Focused on Cerner’s unique opportunity to meaningfully scale healthcare
delivery resulting in cost containment and reduction for our clients.
• Example Middles
• National Provider Directory, National Nurse Directory, Health Plan
Directory, Complex Event Processing/Routing, National Formulary,
Supply Portal (EMR Driven Supply Chain), Referral-Driven Patient
Scheduling Engine, Quality Clearinghouse, Frictionless Transaction,
Physician Credentialing
18
© Cerner Corporation. All rights reserved. All Cerner trademarks and logos are owned or licensed by Cerner Corporation and/or its affiliates. All other brand or product names are trademarks or registered marks of their respective owners.Continuous Advancement
• Building a reliable, nimble and digitally orchestrated approach to
developing and delivering Cerner solutions
• Automating testing and deployment
• Cloud-based delivery of our solutions enabling automatic deployment of updates
• Significant benefits to Cerner and client base
• Allows new innovation to be broadly deployed in days instead of months or years
• Lower cost of ownership
• Cerner speed to market
19
© Cerner Corporation. All rights reserved. All Cerner trademarks and logos are owned or licensed by Cerner Corporation and/or its affiliates. All other brand or product names are trademarks or registered marks of their respective owners.Contextual, Intelligent Experiences
• Leverage the power of data to discover new evidenced based
insights and workflow interventions that drive client value and
help achieve the quadruple aim.
• The limitations of manually curated configuration and build will
be replaced by automated, self-organizing experiences that
become smarter over time.
20
© Cerner Corporation. All rights reserved. All Cerner trademarks and logos are owned or licensed by Cerner Corporation and/or its affiliates. All other brand or product names are trademarks or registered marks of their respective owners.One Record, One Plan, One Bill
• Achieved through
convergence of core platforms
• Millennium
• CareAware
• HealtheIntent
• Ability to capture data from
multiple sources across the
continuum
• Enables connected
communities
• Focus on optimal outcomes for
payers, providers and patients
21
© Cerner Corporation. All rights reserved. All Cerner trademarks and logos are owned or licensed by Cerner Corporation and/or its affiliates. All other brand or product names are trademarks or registered marks of their respective owners.Marketplace Zane Burke President
2017 Highlights
• Bookings of $6.3B, up 16% over 2016
            • Strength across all areas except technology resale
            • Return of contributions from Works businesses
            • Market share gains continue with over 50% win rate
                            •       Success outside of base and expanding through existing clients as
                                    they standardize on Cerner
• Contributions from key areas
            • Population Health revenue up 20% to $292M
                            •       23% 5-year CAGR
                            •       Strong bookings driven by ability to add value in FFS and at-risk models
            • ITWorks revenue up 5% to $527M
                            •       34% 5-year CAGR
                            •       2017 growth impacted by weak 2016 bookings
                            •       Strong 2017 bookings sets up good 2018 revenue growth
            • Revenue Cycle revenue up 15% to $551M*
                            •       33% 5-year CAGR (22% excluding Health Services)
                            •       Strength in base and with new clients
                            •       RevWorks expected to drive very strong 2018 growth
 *Revenue     Cycle revenue          reflects   changes     fromand
                                                                  previous
                                                                                                                                                                                                                                                                        23
 © Cerner Corporation. All rights reserved. All Cerner trademarks   logos are reporting.     It previously
                                                                              owned or licensed              included
                                                                                                by Cerner Corporation     managed
                                                                                                                      and/or its affiliates.services     for or
                                                                                                                                             All other brand the   Health
                                                                                                                                                                product    Services
                                                                                                                                                                        names           portion
                                                                                                                                                                              are trademarks       of revenue
                                                                                                                                                                                             or registered marks ofcycle.    Prior years
                                                                                                                                                                                                                    their respective owners. have also been adjusted.
Pipeline Remains Strong
Pipeline continues to grow even after record 2017
bookings and $25B of bookings last five years
• Client Development
• Pipeline growth reflects ongoing replacement
opportunity
• High volume of small/mid-sized opportunities along
with some larger
• Federal, State Government
• Specialty/Continuum of Care
• Client base
• Revenue Cycle
• Population Health
• Other solution whitespace
• ITWorks and RevWorks
• Non-U.S.
• Activity beginning to pick up
• Strong second half of 2017 and 2018 outlook
24
© Cerner Corporation. All rights reserved. All Cerner trademarks and logos are owned or licensed by Cerner Corporation and/or its affiliates. All other brand or product names are trademarks or registered marks of their respective owners.Acute Market Observations
Non-U.S.
Snapshot Specialty Hospital Acute Market Share Leader
Decisions
• Cerner & Epic remain recognized U.S. market leaders
• Cerner also recognized as Non-U.S. market share leader
• Added 475+ new facilities and 56,000+ beds 2015-2017
• Recognized as specialty and continuum leader
• e.g. Behavioral health and post-acute markets
Opportunities
• ~2,000 sites on legacy platforms *KLAS Research, 2016 Clinical Market Share Report
• Many are smaller, but some larger systems remain
© 2017 KLAS Enterprises, LLC. All rights reserved. www.KLASresear ch.co m
• State, Local, & Federal opportunities equivalent to dozens of IDNs Replacement Market
• Tech-enabled services capabilities differentiate Cerner
• Can help clients address market pressure to control spending
• ITWorks, RevWorks, Value Creation Office
• Population Health Management steadily ramping
• HealtheIntent relevant for fee-for-service & value-based care environments
• Industry consolidation
• Providers looking for scale and standardization
• Most recent announced transactions could create opportunity for Cerner
• Some mergers create HealtheIntent opportunity
• Supplier consolidation also creates opportunity
25
© Cerner Corporation. All rights reserved. All Cerner trademarks and logos are owned or licensed by Cerner Corporation and/or its affiliates. All other brand or product names are trademarks or registered marks of their respective owners.Why We Win
• Predictable Results and TCO
• Fixed-fee implementation, Model Experience
• Commitment to Innovation Aligned business
objectives
One
enterprise EHR
• R&D toward the “Now and the Next”
• Open and Interoperable Orientation
Model
Enabling
• Alignment with Core Business Strategies collaboration
Experience
• Viewed as strategic long-term partner, not ONE
just a vendor Relationship
• Continuum of Tech-Enabled Services aligned Client service
Fixed fee
implementation
team
with focus on controlling operating expense
• Differentiated Population Health platform
Physician +
• Ability to Support the Continuum of Care
Required 3rd
revenue service party solutions
level agreements
• Beyond Acute and Ambulatory
26
© Cerner Corporation. All rights reserved. All Cerner trademarks and logos are owned or licensed by Cerner Corporation and/or its affiliates. All other brand or product names are trademarks or registered marks of their respective owners.Prestigious and Aligned Clients
Cerner Millennium, National Leaders
National Integrators, Innovators & Brands
• 130 of the Top 200 health systems as ranked by Net
Patient Revenue have a Cerner footprint, and within
that 70 of the Top 100
• Via Cerner’s open, agnostic platforms Open Platforms, Employers, Governments
(HealtheIntent, CareAware) and Employer Services
businesses we have footprints with national brands
like Cleveland Clinic, Geisinger, Quintiles, Centene,
Publix, Dr. Pepper and others
• Cerner is annually adding marquee clients across a
variety of market segments Recent Wins / Client Competitive and Market Detail
Adds
• Cerner’s reference program supports ~20 national Northside (GA) Top 100 win, competitive ATL market
show sites that include Top 100 systems, pediatric Lifepoint (TN) Top 100 for profit health system
and academic leaders Huntsville (AL) 3rd largest public hospital in the U.S.
VA (WDC) Largest healthcare delivery institution in the world
MIT (MA) Ambulatory footprint with leading academic institution
The Menninger Clinic (TX) National behavioral health leader, joins Betty Ford as a
Cerner client
27
© Cerner Corporation. All rights reserved. All Cerner trademarks and logos are owned or licensed by Cerner Corporation and/or its affiliates. All other brand or product names are trademarks or registered marks of their respective owners.Global Marketplace John Peterzalek Executive Vice President, Worldwide Client Relationships
Over 30 Countries and 6 Continents

                      1,600+                      2,200+
                  Client facilities located      Cerner associates
                      outside the U.S.        outside the U.S. & India   Office Location
                                                                         Development Location
Current Business Mix
Global Market Share Leader
                                                                                                         Global Vendors by Country
 • Cerner is the #1 or #2
             share leader in 10 of
             11 global regions
 • Market leader with
             most HIMSS Level 6
             and HIMSS Level 7
             facilities
 • Cerner works across
             30+ countries today;
             our primary
             competitors are active
             in 5-10

                                                                                                                                                                                                                                                31
© Cerner Corporation. All rights reserved. All Cerner trademarks and logos are owned or licensed by Cerner Corporation and/or its affiliates. All other brand or product names are trademarks or registered marks of their respective owners.
Non-U.S. Pipeline
• Significant increase in
pipeline in 2017 even after
strong bookings year
• Areas of noteworthy
strength
• Nordic Countries
• Skaane Region positions
us well for future
opportunities in region
• Middle East
• United Kingdom
• Canada
32
© Cerner Corporation. All rights reserved. All Cerner trademarks and logos are owned or licensed by Cerner Corporation and/or its affiliates. All other brand or product names are trademarks or registered marks of their respective owners.Approach to Non-U.S. Markets
• Leverage existing investments
• Millennium, Population Health & Managed Services
• Acquired solutions (where appropriate), services and associate
knowledge
• Invest in countries that are spending substantial
resources on health care and HCIT
• Leverage solutions, services, support and resources
• Consolidate solutions, resources (offices) and associates as and
where possible
• Reduce TCO of solutions
33
© Cerner Corporation. All rights reserved. All Cerner trademarks and logos are owned or licensed by Cerner Corporation and/or its affiliates. All other brand or product names are trademarks or registered marks of their respective owners.Federal Business Travis Dalton SVP & General Manager, Federal Government
DoD / VA Primary Objectives
    Program Objectives                                                                                                                                  Department of                                                                        Department of
                    • Modernize technology                                                                                                                Defense                                                                           Veterans Affairs
                            – Get out of LSW business
                    • Improve quality and outcomes
                            – Enhanced use of analytics
                    • Connect the continuum of care
                            – Seamless Care
                    • Ensure force readiness
                    • Enhance research and
                            innovation
                    • Advance Interoperability
                                     • DoD - VA
                                     • Community Providers
                                     • National Interoperability                                                                                                                                                                                               35
© Cerner Corporation. All rights reserved. All Cerner trademarks and logos are owned or licensed by Cerner Corporation and/or its affiliates. All other brand or product names are trademarks or registered marks of their respective owners.
DoD / VA Programmatic Approach
DoD forms the baseline for VA solution
– VA will create baseline for net new
solutions like cardiology
• Common code base with integration
= scale
• Hardened implementation and The MHS GENESIS logo is a registered trademark of the U.S. Department of
testing approach for DoD will be Defense, Defense Health Agency. Use of the logo does not constitute or imply an
endorsement by the Department of Defense.
utilized for VA
• VA to follow DoD waves to maximize
infrastructure and wire region
• Leverage cybersecurity posture in
place
36
© Cerner Corporation. All rights reserved. All Cerner trademarks and logos are owned or licensed by Cerner Corporation and/or its affiliates. All other brand or product names are trademarks or registered marks of their respective owners.Program Schedule
Department of Defense Department of Veteran Affairs
Successful completion of IOC 48 Deployment Waves + IOC
• Locations: Fairchild, Oak Harbor, • IOC Locations: Spokane, Seattle, and
Bremerton, Madigan American Lake and their associated clinics,
• First “ships in port” care provided with Vet Centers, and Mobile Units
recent go-live setting stage for Segment
2 deployments
Target dates for IOC Sites live Q4_2019
Planned optimization in progress leading to Will Follow DoD Waves Across Country
FDD decision this spring Final site live 2027
23 Waves post IOC
• 18 CONUSS
• 5 OCONUSS
37
© Cerner Corporation. All rights reserved. All Cerner trademarks and logos are owned or licensed by Cerner Corporation and/or its affiliates. All other brand or product names are trademarks or registered marks of their respective owners.DoD Rollout Status
• IOC complete in the PNW
• Planned optimization efforts continue
• Wave deployment fall 2018
38
© Cerner Corporation. All rights reserved. All Cerner trademarks and logos are owned or licensed by Cerner Corporation and/or its affiliates. All other brand or product names are trademarks or registered marks of their respective owners.VA Procurement Status
• Actively working contract to closure with VA
• Independent MITRE interoperability assessment reviewed
and included in contract where appropriate
• Continue to work closely with VA, WH, Hill, VSOs, and other
key stakeholders
• Dollars included in FY18 and 19 budget requests
• Working together with the VA and partners on deployment
readiness
39
© Cerner Corporation. All rights reserved. All Cerner trademarks and logos are owned or licensed by Cerner Corporation and/or its affiliates. All other brand or product names are trademarks or registered marks of their respective owners.Additional Growth Opportunities
• Coast Guard
• Department of Health and Human Services
• Indian Health Services
• Center for Disease Control
• Department of State
• Department of Defense
• DHS and Army Research
• TeleHealth
• HealtheIntent
40
© Cerner Corporation. All rights reserved. All Cerner trademarks and logos are owned or licensed by Cerner Corporation and/or its affiliates. All other brand or product names are trademarks or registered marks of their respective owners.Program Highlights and Benefits
Innovation applies Maximizing investment Pushing forward.,
to all markets
and taxpayer dollars a national network
41
© Cerner Corporation. All rights reserved. All Cerner trademarks and logos are owned or licensed by Cerner Corporation and/or its affiliates. All other brand or product names are trademarks or registered marks of their respective owners.Future of Interoperability
42
© Cerner Corporation. All rights reserved. All Cerner trademarks and logos are owned or licensed by Cerner Corporation and/or its affiliates. All other brand or product names are trademarks or registered marks of their respective owners.Revenue Cycle Jeff Hurst Senior Vice President, Revenue Cycle and President, RevWorks Bill Wing President, Adventist Health
Revenue Cycle 2017 Review
• Strong 2017 bookings and revenue growth
                  • Over 50% bookings growth
                  • 15% revenue growth

• RevWorksSM became major contributor in 2017,
         driven by Adventist Health

• Positioned for good long-term growth based on
         strong 2017 bookings and pipeline
          •        Strong interest in RevWorks services, including full
                   outsourcing
          •        Opportunity to increase penetration of revenue cycle
                   solutions in installed base, which expands addressable
                   market for our services
                  •         About 40% of Millennium base has purchased revenue cycle

                                                                                                                                                                                                                                                44
© Cerner Corporation. All rights reserved. All Cerner trademarks and logos are owned or licensed by Cerner Corporation and/or its affiliates. All other brand or product names are trademarks or registered marks of their respective owners.
RCM Marketplace Trends (2017-2022)
GLOBAL REPORT
Market value is
Double-digit projected to grow from
growth rate $51.17B to $90.43B “RCM services
will see growth
as
organizations
seek to reduce
the loss of
revenue due to
billing errors.”
Growth drivers
• Growing need to reduce health care costs
• Government initiatives to boost the adoption of RCM solutions
• Loss of revenue due to billing errors Source: 2017 Revenue Cycle
Management Market - Global
•
Forecast to 2022
Process improvements in health care organizations
© Cerner Corporation. All rights reserved. All Cerner trademarks and logos are owned or licensed by Cerner Corporation and/or its affiliates. All other brand or product names are trademarks or registered marks of their respective owners.
MarketsandMarkets 45Services to fuel growth and advance RCM solutions
• Technology platform
• Scalable across clients
• Operations model
• Process flow & resource allocation
• Full-service engagement
• Key strategic partners
• Leadership execution
• Management focus & discipline
• Economic alignment
• Gain-sharing & risk-sharing
46
© Cerner Corporation. All rights reserved. All Cerner trademarks and logos are owned or licensed by Cerner Corporation and/or its affiliates. All other brand or product names are trademarks or registered marks of their respective owners.Who is Adventist Health?
Workforce
Hospitals
Home Health & Hospice Agencies
Physician Services/Clinics
Adventist & Cerner partnership
Our journey                          A trusted partnership for 17 years
                                              40+ applications deployed across the system
                                              Acute, Post Acute, Ambulatory, Revenue Cycle
                                              Core Services - Remote Hosting, Application Support
                                              Revenue Cycle Management
                                              Value Creation Office

Partnership expansion
       Centered on alignment to AH 2020 Vision and beyond
       Workforce alignment across Revenue Cycle and Clinical IT
       Initial 3 year focus on driving value across clinical and business
       operations - $400M
          Achieving Top Quartile across Clinical and Business Operations
          Achieving Top Decile performance across Clinical Quality
          Revenue Cycle Management – revenue yield, cash acceleration, cost to
          collect
          Care Transformation – reducing variance and improving outcomes
 IMPROVE QUALITY, MAKE HEALTH CARE MORE AFFORDABLE 54
Performance review and forecast
Adventist HealthPopulation Health Ryan Hamilton Senior Vice President, Population Health
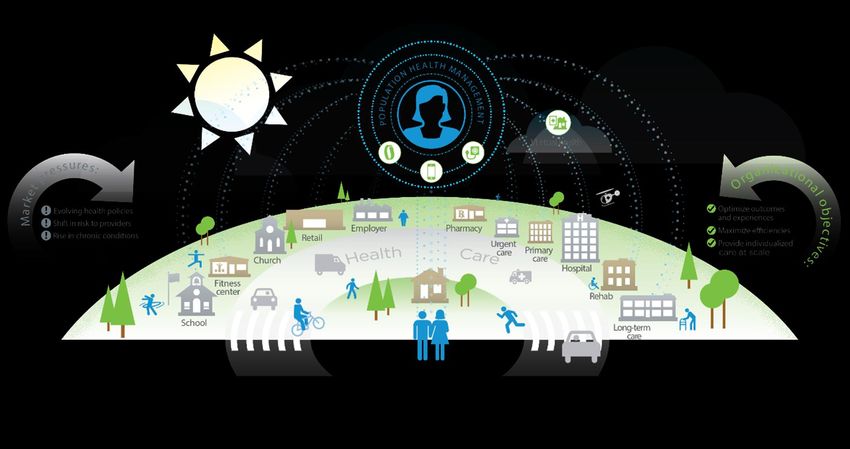
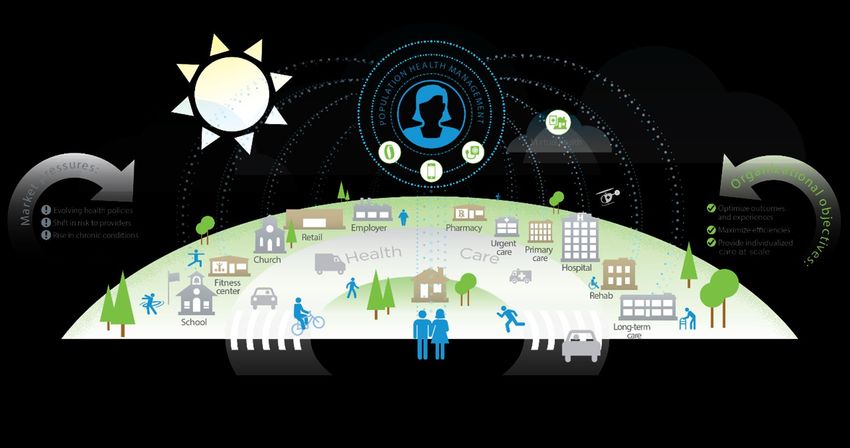
A Vision for Sustainable Health Care

                                                                                                                                                                                                                                                57
© Cerner Corporation. All rights reserved. All Cerner trademarks and logos are owned or licensed by Cerner Corporation and/or its affiliates. All other brand or product names are trademarks or registered marks of their respective owners.
Population Health Market is More Extensive Than Providers
Provider with a Cerner EMR Employers
Providers with other EMR Health plans
International providers Life Sciences
Governments / Medicaid Secondary data users
58
© Cerner Corporation. All rights reserved. All Cerner trademarks and logos are owned or licensed by Cerner Corporation and/or its affiliates. All other brand or product names are trademarks or registered marks of their respective owners.Mission Requires . . .
To effectively manage a population
requires more than interoperable data.
It requires…
• Data -> Insight
• Insight -> Action
• Action -> Outcomes
… across the continuum.
59
© Cerner Corporation. All rights reserved. All Cerner trademarks and logos are owned or licensed by Cerner Corporation and/or its affiliates. All other brand or product names are trademarks or registered marks of their respective owners.Supply & Demand
60
© Cerner Corporation. All rights reserved. All Cerner trademarks and logos are owned or licensed by Cerner Corporation and/or its affiliates. All other brand or product names are trademarks or registered marks of their respective owners.Foundation of Empowered Engagement . . .
Longitudinal Personalized Open
record plan ecosystem
Understand the full context of the Match the unique needs of each Integrate seamlessly within the
individuals goals, barriers, conditions, person with the skills and resources provider workflow to drive decision
and environment within their community. making.
Empower and activate the consumer
to manage their own health and care.
61
© Cerner Corporation. All rights reserved. All Cerner trademarks and logos are owned or licensed by Cerner Corporation and/or its affiliates. All other brand or product names are trademarks or registered marks of their respective owners.Embedded Intelligence - Risk stratification, benchmarks, Cerner and industry leading algorithms
Measures* 425,000+ Proprietary Codes Mapped Benchmarks
63,500+ Concepts Curated
MSSP ACO
HEDIS
PQRS Evidence-based Algorithms* Hospital General Information
Healthcare Associated Infections
Readmissions, Complications, & Death
Value Based Purchasing Scores
Potentially Preventable Events Emergency Department Visit
Timely & Effective Care
MS-DRG Grouper Classification
MDC Grouper Outpatient Imaging Efficiency
Service Categorizations Relative Value Units
Reference Episode Groupers HCC Suggested Diagnosis Hospital Acquired Condition
Social Benchmarks HCC Persistence Diagnosis Heart Attack Payment Data
Vulnerability Recommended Transition of Care Hospital ACS Measures
Index Readmission Risk Medicare Hospital Spending by Claim
Tract-Zip & Sepsis Risk Medicare Volume
American Zip-Tract MARA Prospective risk score
Outpatient Procedures Volume
Time Use MARA Retrospective risk score
Survey Measure Dates
Service Categorizations HCAHPS
Medical Episode Grouper Medicare Prescribing Data
TCRRV/TCOC Outpatient Episode Grouper More…
*Some content requires corresponding Analytics package 62
© Cerner Corporation. All rights reserved. All Cerner trademarks and logos are owned or licensed by Cerner Corporation and/or its affiliates. All other brand or product names are trademarks or registered marks of their respective owners.Cerner’s Solutions
Available
Enterprise data
Longitudinal Registries & Care Consumer EHR integration
warehouse &
record performance management Engagement &
Population health
analytics scorecards CRM
(in-development)
Emerging
Population Longitudinal plan Referral Network & Advisory & Innovation
health programs management contract operational ecosystem
management services
Unified enterprise platform (source agnostic, programmable, near real-time, extensible ecosystem)
Note: Subject to change
© 2015 Cerner Corporation. All rights reserved. This document contains Cerner confidential and/or proprietary information belonging to Cerner Corporation and/or its related affiliates which may not be reproduced or transmitted in any form or by any means without the express written consent of Cerner.144 Unique HealtheIntent Clients
DATA VARIETY
740+ 35+ 75+
total data connections connected EHR connected claims
systems (Epic, Allscripts…) & payer vendors
SCALABILITY
57M+ 10+ PB 149M+
linked disparate of data storage lives;
records 37.5M+ managed lives
INTELLIGENCE
45+ 95% 57
registries; of records linked standard terminologies;
730+ measures using machine intelligence ~1.7M terminology codes grouped
*Information is current as of Feb. 2018 64
© Cerner Corporation. All rights reserved. All Cerner trademarks and logos are owned or licensed by Cerner Corporation and/or its affiliates. All other brand or product names are trademarks or registered marks of their respective owners.Opportunities in Many Segments
Employers Commercial Government Global
Health Plans Medicaid
5 1 9 7
HealtheIntent clients HealtheIntent clients HealtheIntent clients HealtheIntent clients
• Employer analytics • Data management • Data management • Data management
• Employer engagement • Plan analytics • MCO performance • Information exchange
• Health & prevention • Case / care management • Health and prevention • Case / care management
• Case/Care management • Member engagement • Care coordination • Citizen engagement
• Onsite services • Health & prevention • Citizen engagement • Health & prevention
• Research enablement
65
© Cerner Corporation. All rights reserved. All Cerner trademarks and logos are owned or licensed by Cerner Corporation and/or its affiliates. All other brand or product names are trademarks or registered marks of their respective owners.Driving Revenue Growth
Operations – BPO care delivery and analytics,
$4 – $20 outcomes management, out & co-sourcing
pmpm
Advisory - strategy, planning, value re-
Fee based engineering, analytic insights
Revenue
Relative
revenue
CM workflow, content and, BI Busi
potential $.30 – $1.00 pmpm tools and apps
Ad
EDW,
$.30- data acquisition
.50pmpm enrichment
Value
66
© Cerner Corporation. All rights reserved. All Cerner trademarks and logos are owned or licensed by Cerner Corporation and/or its affiliates. All other brand or product names are trademarks or registered marks of their respective owners.What’s our Plan for 2018 and Beyond?
Solution portfolio Service portfolio Market segment Collaborations &
expansion partnerships
• Fee for Service suites • Advisory services • Global • Consumer engagement
• Consumer engagement • Performance improvement • Health Plan • Applied intelligence
• Data management • Care Management-as-a- • Government / Medicaid • CRM
• Enterprise analytics service • Employers • Cloud providers
• Analytics-as-a-service • Life sciences
• Telehealth / automation • Providers-sponsored health
plans
67
© Cerner Corporation. All rights reserved. All Cerner trademarks and logos are owned or licensed by Cerner Corporation and/or its affiliates. All other brand or product names are trademarks or registered marks of their respective owners.Demand & Supply Market Landscape Don Trigg President, Cerner Health Ventures
Healthcare Market’s Demand – Supply Macroeconomic Framework

    New Entrants
Companies contemplating
    a market entry                                          Demand Side                                                                                                                                       Supply Side
                                                  Aggregators of risk and purchasers of                                                                                                         Healthcare provider: retail pharmacies to
                                                          healthcare services                                                                                                                   doctors to hospitals to post-acute facilities
                Market Prices (P)

                                                                                                                                            Middles
                                                                                                                                     Companies that facilitate
                                                                                                                                      transactions between
                                                                                                                                       supply and demand

   Risk                                                                                                                                                Current
                                                                                                                                                       Market

                                                                                                                          Quantity / Market Capacity (Q)
                                                                                                                                                                                                                                                69
© Cerner Corporation. All rights reserved. All Cerner trademarks and logos are owned or licensed by Cerner Corporation and/or its affiliates. All other brand or product names are trademarks or registered marks of their respective owners.
Demand Macros: Commercial
Cost Network Navigation
• Total cost for medical and • Employers are empowering people with tools and
pharmacy services will be resources to care for their health and make better
$13,482 per employee in 2018. healthcare decisions. “Transparency tools” (now
It will be the fifth consecutive offered by 82% of employers with 500+
year that per employee costs employees) help consumers compare healthcare
have increased. (NBGH) prices and quality, while telemedicine provides a low-
• By 2018, 61% of employers cost alternative to an office visit (offered by 71%).
plan to deploy high
performance and narrow
networks, currently only 11%,
requiring closer collaboration
with area providers. https://www.shrm.org/resourcesandtools/hr-topics/benefits/pages/2018-health-plan-premiums-forecast.aspx
CDHP
• In 2017, 30% of all covered employees
enrolled in a high-deductible consumer-
directed health plan (CDHP).
• 90% of large employer plans will offer at
least one CDHP. Of those plans, about
40% will offer a CDHP as the only plan
option, compared with 35% this year.
https://www.mercer.us/our-thinking/healthcare/mercers-2017-survey-results.html
70
© Cerner Corporation. All rights reserved. All Cerner trademarks and logos are owned or licensed by Cerner Corporation and/or its affiliates. All other brand or product names are trademarks or registered marks of their respective owners.Demand Macros: Medicare
• >10,000 baby boomers in US becoming eligible for Medicare
MA enrollment and penetration is increasing
every day; trend will continue until 2029 when ~18% of US population
35.0 50%
will be eligible for Medicare. (in millions)
• Since 2010, enrollment in Medicare Advantage has nearly doubled, 30.0 29.0
reaching 19.0 million beneficiaries and a 33% penetration rate 25.0 40%
40%
among all Medicare beneficiaries; annual MA membership growth of 20.0 19.0
5% is expected through 2025. 33%
• The MA market is dominated by large commercial payors, with 15.0
11.1
30%
Provider Sponsored Plans (PSPs) representing approximately 10.0
10% of total enrollment (excluding Kaiser). 5.0
24%
• MA plans with higher scores for quality of care receive higher
0.0 20%
reimbursement levels from the government and often offer enhanced 2010A 2017A 2025E
benefit packages; 70% enroll in a 4 Star or higher MA plan. MA Enrollment MA % of Medicare Beneficiaries
MA enrollment mix MA membership skewed toward high-rated plans
38%
~13% United Healthcare
25% Humana
BCBS (ex. Anthem)
~8%
Aetna 21% 21%
Anthem BCBS
~10% Cigna
11%
Wellcare
17% 7%
PSPs
2% 1%
Kaiser 0%
2%
3% 7% Other
2 Stars 2.5 Stars 3 Stars 3.5 Stars 4 Stars 4.5 Stars 5 Stars
13%
All Plans 71
© Cerner Corporation. All rights reserved. All Cerner trademarks and logos are owned or licensed by Cerner Corporation and/or its affiliates. All other brand or product names are trademarks or registered marks of their respective owners.Demand Macros: Medicaid and Individual
Medicare and Medicaid Historical
(in Regulatory Shifts
millions) Annual Enrollment US Census, Medicaid.gov Expenditures
100 5% • Medicare spending grew 3.6% • Medicaid waivers to states for
to $672 billion in 2016 more flexibility/autonomy over
0 %
2014 2015 2016 • $11.7K/Capita cost control
Medicare Enrollment • Medicaid spending grew 3.9% “We’re not going to tell the states
Medicaid Enrollment
to $565 billion in 2016 what their priorities are. They are
• $7.5K/Capita going to come and tell us what
Medicare Annual % Change their priorities are.” Seema Verma,
CMS Administrator, 2017
Medicaid Annual % Change
Managed Medicaid Individual Exchange
Medicare and Medicaid
(in cms.gov
billions) National Health Expenditures • 9.4% Big 5* Membership CAGR • 7.5% Big 5* Membership CAGR
1000 20% (2012-2016) (2014-2016)
0 %
• Ongoing success of expansion • Uninsured % flattening
proposals driving growth
2010 2011 2012 2013 2014 2015 2016
• Structurally unstable; selected
Medicare NHE
• $200bn+ opportunity in Duals / markets viable
Long-Term Support and Services
Medicaid NHE
(LTSS); developing more slowly • Debate: Viability in current
Medicare Annual % Change than hoped / expected regulatory construct?
Medicaid Annual % Change
* Big 5 represents national health insurers – United Healthcare, Aetna, Anthem, Cigna, Humana
Barclays 2017 Managed Care Key Operating Trends & Key Debates 72
© Cerner Corporation. All rights reserved. All Cerner trademarks and logos are owned or licensed by Cerner Corporation and/or its affiliates. All other brand or product names are trademarks or registered marks of their respective owners.Healthcare Market’s Supply Strategies
Providers are consolidating in pursuit of operational scale. Many are also exploring risk-based
strategies to tap into demand-side business economics. Some are integrating vertically.
Provider-Sponsored Plans
Market Headwinds
• Reimbursement Cuts
• Cost Pressures
Purpose-Built Narrow Networks • Fee-For-Value Shift
Market Prices (P)
Virtual and Asset-Light
Networks
Vertical
Value-Based Integration
Contracts (BPCI)
Risk Supply Side Demand Side
Current
Market
Quantity / Market Capacity (Q)
73
© Cerner Corporation. All rights reserved. All Cerner trademarks and logos are owned or licensed by Cerner Corporation and/or its affiliates. All other brand or product names are trademarks or registered marks of their respective owners.Healthcare Market’s Demand Strategies
Plans are shifting the risk increasing to the providers through new types of contracts (value-based
payment to partial/full capitation) and J/V ACOs. Vertical integration is also common to cut costs.
Market Prices (P)
Mergers and Acquisitions
Market Headwinds
• Caps on Profitability
• Regulatory and Legal
• Cost Pressures
Risk Supply Side Demand Side
Current
Market
Quantity / Market Capacity (Q)
74
© Cerner Corporation. All rights reserved. All Cerner trademarks and logos are owned or licensed by Cerner Corporation and/or its affiliates. All other brand or product names are trademarks or registered marks of their respective owners.“Out-In” Big Caps with Strong Consumer Competence Looking at Healthcare
Demand Side Supply Side
Healthcare Group Potential Demand Health Insurance Retail Drug Distribution Primary Care Clinics
Purchasing Side Entrance Disruption and Applications
Big-box retailer, already a big Alphabet’s health-care unit Amazon looking to enter retail Apple launching a network of
The trio announced a player in the pharmacy, drug distribution space primary care clinics for its
Verily is moving ahead with
partnership to cut health costs ramping up its health & leveraging its channels. employees, ”AC Wellness.” Also
plans in the insurance sector
and improve services for wellness strategy. Amazon already secured expanding its personal health
with new hires and
employees. The idea is to wholesale pharmacy licenses in record offering, and vital signs
partnerships.
create a company that would many states. monitoring.
be "free from profit-making
incentives“ with their joint 1.1
million employee base.
75
© Cerner Corporation. All rights reserved. All Cerner trademarks and logos are owned or licensed by Cerner Corporation and/or its affiliates. All other brand or product names are trademarks or registered marks of their respective owners.Venture Capital Inflows Continue to Increase at a Record Pace
2017 was the most active year for digital health funding; $11.5B invested across 794 deals. Patient /
Consumerism is the largest category
Avg. Median
Total Deal
Subsector Deal Deal
Raised Count
Size Size
Patient /
Consumer $1.64B 191 $9.3M $4.0M
Experience
Personalized
$1.59B 71 $25.7M $4.0M
Health
Big Data /
$1.39B 56 $26.7M $5.7M
Analytics
Medical Device $1.37B 72 $20.2M $64.0M
Wellness $1.12B 77 $16.5M $3.6M
Workflow $1.07B 161 $7.5M $3.1M
Research $933M 39 $2.5M $10.0M
Education /
$730M 17 $48.7M $5.2M
Training
Population Health $696M 56 $13.4M $6.2M
EHR $404M 12 $33.6M $7.9M
76
© Cerner Corporation. All rights reserved. All Cerner trademarks and logos are owned or licensed by Cerner Corporation and/or its affiliates. All other brand or product names are trademarks or registered marks of their respective owners.Closing Comments Brent Shafer Chairman and Chief Executive Officer
First 30 Days
                           Client View

                           • Calls and visits with key clients (ongoing)
                           • Strategic nature and complexities of health IT are evident
                           • They like us, they need us, and they want us to help them go faster

                           Leadership Team & Culture

                           • World-class talent
                           • Significant founder influence; vision and entrepreneurial drive intact
                           • Associates are passionate about health care, have deep knowledge, and enjoy
                             complexity

                           Cerner Position & Strategy

                           • Examining markets, growth opportunities and portfolio
                           • Cerner has the platforms, data and DNA to change health care
                                                                                                                                                                                                                                                78
© Cerner Corporation. All rights reserved. All Cerner trademarks and logos are owned or licensed by Cerner Corporation and/or its affiliates. All other brand or product names are trademarks or registered marks of their respective owners.
What’s Next
• Continue to lead the team in
fresh examination of key
topics, developing the 3-year
strategic plan.
• This includes reviewing
priorities for investments,
refining strategies, and
identifying opportunities to
optimize our business.
• The goal: continue strong
forward momentum and
achieve our goals for
innovation and profitable
growth.
79
© Cerner Corporation. All rights reserved. All Cerner trademarks and logos are owned or licensed by Cerner Corporation and/or its affiliates. All other brand or product names are trademarks or registered marks of their respective owners.Drivers of Opportunity: The Need is Great
• Rising cost of care
• Aging population
• Impact of chronic conditions
• Increasing complexity in practicing medicine
• Consolidation (the search for scale)
• Changing payment models
• Shifting venues of care (high-cost to low-cost)
• Consumer expectations of technology are at an all-time high.
• IT is the recognized lever for change
• The effects of digitizing the health care industry will be profound.
80
© Cerner Corporation. All rights reserved. All Cerner trademarks and logos are owned or licensed by Cerner Corporation and/or its affiliates. All other brand or product names are trademarks or registered marks of their respective owners.Questions
Health care is too important
to stay the same.TM
Appendix – Reconciliation of GAAP to non-GAAP financial measures
Reconciliation of GAAP Results to Non-GAAP Results*
We report our financial results in accordance with accounting principles generally accepted in the
Adjusted Operating Earnings 2016 2017
United States of America ("GAAP"). However, we supplement our GAAP results with certain non- Operatin Operatin Operatin Operatin
GAAP financial measures, which we believe enable investors to better understand and evaluate ($ in millions)
g g Margin g g Margin
our ongoing operating results and allows for greater transparency in the review and Operating earnings (GAAP) $ 911 19.0% $ 960 18.7%
Share-based compensation expense 81 89
understanding of our overall financial, operational and economic performance. These non-GAAP Health Services acquisition-related amortization 81 83
financial measures are not meant to be considered in isolation, as a substitute for, or superior to Acquisition-related deferred revenue adjustment 20 17
Other acquisition-related adjustments 4 0
GAAP results and investors should be aware that non-GAAP measures have inherent limitations Voluntary separation plan expense 36 0
Adjusted Operating Earnings (non-GAAP) $ 1,133 23.6% $ 1,150 22.4%
and should be read only in conjunction with Cerner's consolidated financial statements prepared
in accordance with GAAP. These non-GAAP measures may also be different from similar non- Adjusted Net Earnings and Adjusted Diluted
Earnings Per Share 2016 2017
GAAP financial measures used by other companies and may not be comparable to similarly titled Diluted Diluted
captions of other companies due to potential inconsistencies in the method of calculations. We ($ in millions, except per share data) Net Earnings Net Earnings
Earnings Per Share Earnings Per Share
provide the measures of adjusted operating earnings, adjusted net earnings and adjusted diluted Net earnings (GAAP) $ 636 $ 1.85 $ 867 $ 2.57
earnings per share as such measures are used by management, along with GAAP results, to Pre-tax adjustments for Adjusted Net Earnings:
analyze Cerner's business, make strategic decisions, assess long-term trends on a comparable Share-based compensation expense 81 89
Health Services acquisition-related amortization 81 83
basis, and for management compensation purposes. We provide the measure of free cash flow Acquisition-related deferred revenue adjustment 20 17
Other acquisition-related adjustments 4 0
as such measure takes into account certain capital expenditures necessary to operate our Voluntary separation plan expense 36 0
business. Free cash flow is used by management, along with GAAP results, to analyze our After-tax adjustments for Adjusted Net Earnings:
earnings quality and overall cash generation of the business. Income tax effect of pre-tax adjustments (68) (54)
Share-based compensation permanent tax items - (63)
Any future period guidance in this presentation includes adjustments for items not indicative of Tax Reform Impact (135)
Adjusted Net Earnings (non-GAAP) $ 790 $ 2.30 $ 805 $ 2.38
our core operations, which may include without limitation share-based compensation expense
and acquisition-related expenses, such as integration expenses, and may be affected by changes Free Cash Flow
($ in millions) 2016** 2017
in ongoing assumptions and judgments relating to our acquired businesses, and may also be
Cash flows from operating activities (GAAP) $ 1,246 $ 1,308
affected by nonrecurring, unusual or unanticipated charges, expenses or gains, all of which are Capital purchases (459) (362)
Capitalized software development costs (294) (274)
excluded in the calculation of non-GAAP adjusted operating earnings, adjusted net earnings and Free Cash Flow (non-GAAP) $ 493 $ 671
adjusted diluted earnings per share. The exact amount of these adjustments are not currently
Cash flows from investing activities (GAAP) $ (790) $ (1,006)
determinable, but may be significant. It is therefore not practicable to reconcile this non-GAAP
Cash flows from financing activities (GAAP) $ (677) $ (111)
guidance to the most comparable GAAP measures.
*More detail on these adjustments and management's use of non-GAAP results is in our most recent Form 10-K and our current
Please see the accompanying table for a reconciliation of GAAP results to non-GAAP financial reports on Form 8-K.
measures. **The 2016 free cash flow presentation has been recast to reflect a new accounting standard (related to share-based
compensation) adopted by the Company in Q1 2017.
83
© Cerner Corporation. All rights reserved. All Cerner trademarks and logos are owned or licensed by Cerner Corporation and/or its affiliates. All other brand or product names are trademarks or registered marks of their respective owners.You can also read