Population Health Profile: 2013
←
→
Page content transcription
If your browser does not render page correctly, please read the page content below
Population Health
                        Profile: 2013
                                                      www.isml.org.au
                                                      Suite 3, level 1, 336 Keira Street            1/154 Meroo Road
                                                      Wollongong NSW 2500                           Bomaderry NSW 2541
                                                      PO Box 1198 Wollongong NSW 2500               PO Box 516 Nowra NSW 2541
                                                      t 02 4220 7600 f 02 4226 9485                 t 02 4423 6233 f 02 4423 6451

Medicare Locals gratefully acknowledge the financial and other support from the Australian Government Department of Health and Ageing
Grand Pacific Health Ltd (ABN 49 062 587 071), trading as Illawarra-Shoalhaven Medicare Local
Population Health Profile: 2013

The purpose of this Population Health Profile: 2013 is to accurately identify and quantify the
local health needs of the resident population of the Illawarra-Shoalhaven Medicare Local
(ISML) catchment. It aims to inform the development of focused and responsive primary
care services by using a population approach into inter-agency service planning for disease
prevention and early intervention initiatives, focusing on targeted population cohorts.

This Population Health Profile: 2013 is an inaugural framework document that will be
accompanied by supplementary releases containing regularly updated recent data and
figures, as and when sourced and adapted from various reliable sources of information. The
authors will attempt to keep the Population Health Profile and subsequent Population Health
publications current and accurate with all the information required to inform effective and
regionally appropriate primary healthcare planning for the Illawarra-Shoalhaven.

Suggested Citation:

Ghosh A, McDonald K and Marshall K. (2013), Illawarra-Shoalhaven Medicare
Local - Population Health Profile: 2013 . Grand Pacific Health Ltd. trading as
Illawarra-Shoalhaven Medicare Local.

Acknowledgement:

The authors would like to acknowledge The Centre for Health Service Development at the
University of Wollongong for their valuable inputs through their 2012 report:
Thompson C, Eckstein G, McDonald K, Fildes D, Samsa P, Westera A, Cuthbert E and
Eagar K. (2012) Health Profile & Needs Assessment – Planning After hours Primary Care in
the Illawarra-Shoalhaven Medicare Local. Centre for Health Service Development,
University of Wollongong.

                                                                                       Page | 2
Population Health Profile: 2013

Table of Contents

1.     GEOGRAPHY ..................................................................................................... 7
       Table 1: Illawarra Shoalhaven Medicare Local (ISML) regional geography.................... 7
       Figure 1: Map of Illawarra-Shoalhaven indicating all Statistical Local Areas (SLA) ........ 7
2.     DEMOGRAPHY ................................................................................................... 8
     2.1.     Existing population indicators ............................................................................... 8
       Table 2: Estimated resident population, ISML regions, 2011 ........................................ 8
       Figure 2: Map of total usual resident population, ISML regions, 2011 ........................... 8
       Table 3: Population age structure, ISML regions, 2011 ................................................ 9
       Figure 3: Population age structure, ISML regions, 2011 - percentages ......................... 9
     2.2.     Population projections ....................................................................................... 10
       Table 4: Population projections, ISML regions, 2021 .................................................. 10
       Table 5: Projected change in population, ISML regions, 2011-2021 - numbers............ 11
       Figure 4: Share of projected additional residents, ISML areas, 2011-2021 .................. 11
     2.3.     Population diversity and target groups ................................................................ 12
     2.3.1.      Culturally and linguistically diverse (CALD) communities ................................. 12
       Table 6: Non-English speaking background (NESB) population, ISML regions, 2011 .. 12
       Figure 5: Map of culturally and linguistically diverse population, ISML regions, 2011 –
       percentages of total population ................................................................................. 13
       Table 7: Poor proficiency at speaking English, ISML regions, 2011 ............................ 14
     2.3.2.      Indigenous population .................................................................................... 14
       Table 8: Indigenous population, ISML regions, 2011 .................................................. 15
       Figure 6: Map of Indigenous population, ISML regions, 2011 – percentage of total
       population ................................................................................................................ 15
       Figure 7: Age distribution comparison of Indigenous and non-Indigenous population,
       ISML catchment, 2011.............................................................................................. 16
     2.3.3.      Aged population ............................................................................................. 16
       Figure 8: Map of population aged 65 years and above, ISML regions, 2011 –
       percentage of total population ................................................................................... 17
       Table 9: Population aged 65 years and above, ISML regions, 2011 ............................ 17
       Table 10: Population projections for persons aged 65 years and above, ISML regions,
       2021 ........................................................................................................................ 18
       Table 11: Population projections for persons aged 85 years and above, ISML regions,
       2021 ........................................................................................................................ 18
     2.3.4.      Single parent population ................................................................................. 19
       Table 12: Single parent population, ISML regions, 2011............................................. 19

                                                                                                                           Page | 3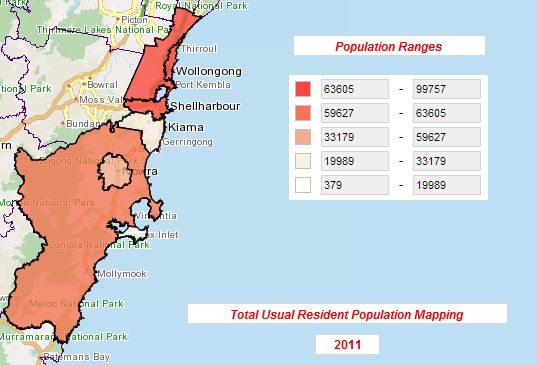
Population Health Profile: 2013

       Table 13: Single parent families with children aged below 15 years, ISML regions, 2011
       ................................................................................................................................ 19
     2.3.5.      Regional or remote populations ...................................................................... 20
       Table 14: Population by remoteness categories, ISML, 2011 ..................................... 20
3.     SOCIO-ECONOMY ............................................................................................ 21
       Table 15: Index of relative socio-economic disadvantage, ISML regions, 2011............ 21
       Table 16: Unemployment rate and labour force participation, ISML regions, June 2011
       ................................................................................................................................ 21
       Table 17: Jobless families and children under 15 years of age, ISML regions, 2011 .... 22
       Table 18: Very low income earners (less than $300 per week), ISML regions, 2011 .... 23
       Table 19: Low income households (less than $600 per week), ISML regions, 2011 ..... 23
     3.1.     Access .............................................................................................................. 24
       Table 20: Private dwellings with no motor vehicle, ISML regions, 2011 ....................... 24
       Table 21: Private dwellings with no internet connection, ISML regions, 2011 .............. 25
       Table 22: Centrelink income support recipients, ISML regions, 2011 .......................... 26
       Table 23: Private health insurance and health care card coverage, ISML regions ....... 27
     3.2.     Education .......................................................................................................... 27
       Figure 9: Highest year of schooling completed, ISML catchment, 2011 ....................... 27
       Table 24: Youth participation in education, ISML regions, 2011 & 2012 ...................... 28
     3.3.     Early childhood indicators .................................................................................. 28
       Figure 10: Immunisation coverage* (%), ISML, latest financial quarters 2011-2012 ..... 29
       Table 25: Developmental vulnerability in school children by domains, ISML areas, 2012
       ................................................................................................................................ 30
       Table 26: Developmental vulnerability in school children by no. of domains, ISML areas,
       2012 ........................................................................................................................ 30
     3.4.     Housing and social isolation ............................................................................... 30
       Table 27: Homelessness^, ISML areas, 2011 ............................................................ 31
       Table 28: Social isolation in older ages, ISML regions, 2011 ...................................... 31
       Table 29: Housing stress in lower income households^, ISML regions, 2011 .............. 32
4.     HEALTH STATUS, DISEASE BURDEN AND EPIDEMIOLOGY ................................ 33
       Table 30: Births and total fertility rates, ISML regions, 2011 ....................................... 33
       Table 31: Mortality and standardised death rates, ISML regions, 2011 ....................... 33
       Table 32: Avoidable deaths, ISML Areas, 2006-2007................................................. 34
       Table 33: Avoidable deaths and major causes, ISML regions, 2003-2007................... 34
       Table 34: Disability^ within the general and the aged population, ISML regions, 2011 . 35
       Figure 11: Carer population proportions and disability prevalence, 2011, ISML regions35
       Table 35: Estimated prevalence of major health risk factors, ISML, 2011 .................... 36

                                                                                                                              Page | 4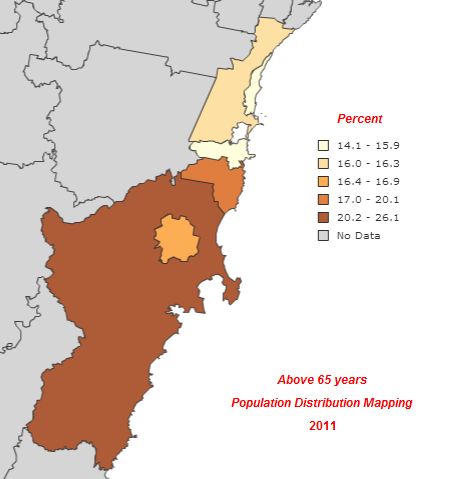
Population Health Profile: 2013
Table 36 Estimated maternal and child health indicators, ISML, 2010 ......................... 36
Table 37: Synthetic prevalence estimates of major risk factors and maternal and child
health indicators, ISML regions, 2007-08................................................................... 37
Table 38: Synthetic prevalence estimates of major chronic disease groups, ISML
regions, 2007-08 ...................................................................................................... 37
Table 39: Synthetic prevalence estimates of specific chronic conditions, ISML regions,
2007-08 ................................................................................................................... 38
Table 40: Synthetic prevalence estimates of mental health conditions, ISML regions,
2007-08 ................................................................................................................... 39
Table 41: Mortality and disease burden of major cancers, ISML, 2008........................ 40
Table 42: Participation in cancer screening, ISML, 2010 ............................................ 40
5. HEALTH SERVICES AND UTILISATION .............................................................. 41
5.1. Primary Care ..................................................................................................... 41
Table 43: Service utilisation rates by category of GP services, 2011-12...................... 41
Table 44: GP service utilisations, ISML regions, 2009-10 ........................................... 42
Table 45: Utilisation of selected items specific to primary care services, ISML regions,
2009-10 ................................................................................................................... 42
Table 46: Service utilisation rates by category of Allied Health services, 2011-12........ 43
5.2. Acute and sub-acute care .................................................................................. 44
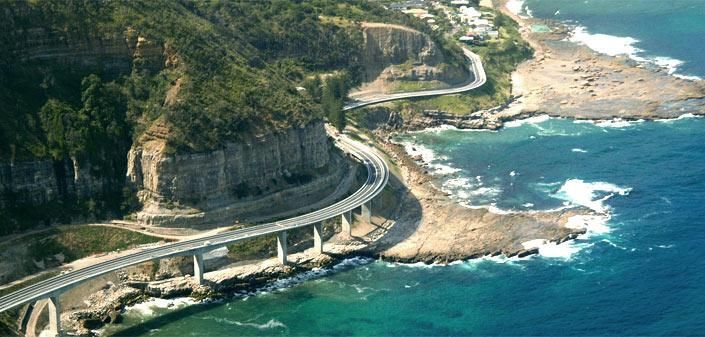
Figure 12: Location of hospitals in the ISML catchment.............................................. 44
5.2.1. Hospitalisation rates ....................................................................................... 44
Table 47: Hospitalisations by causes, ISML areas, latest available years .................... 45
5.2.2. Hospitalisation for ambulatory care sensitive conditions (ACSC) ...................... 46
Table 48: Hospitalisations for ambulatory care sensitive conditions (ACSC), ISML areas,
2010-11 ................................................................................................................... 46
5.2.3. Emergency department (ED) admissions ........................................................ 46
Figures 13 & 14: Triage 4 presentation trends and Triage 5 presentation trends, ISLHD
................................................................................................................................ 47
Figure 15: Proportional ED Presentations by Hospitals, ISLHD, 2011-12 .................... 47
5.3. Aged care ......................................................................................................... 48
Figure 16: Proportions of persons aged 65 years and above who are: disabled and
disabled residing in long term accommodation, ISML regions, 2011 ........................... 48
Table 49: Aged Care Places, ISML Regions, 2012 .................................................... 48
Table 50: Population ratios of aged care places, ISML regions, 2011 ......................... 49
5.4. Special programs and target groups ................................................................... 49
5.4.1. Commonwealth Home and Community Care (HACC) program ........................ 49
Table 51: Home & Community Care program: service instances, ISML regions, 2010-11
................................................................................................................................ 50
Page | 5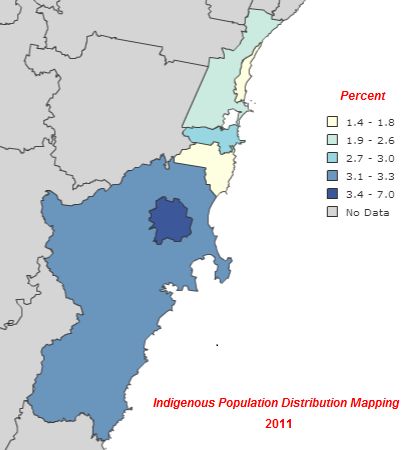
Population Health Profile: 2013

          Table 52: Home and Community Care program: client profile, ISML regions, 2010-11. 51
     5.4.2.        Better Access program ................................................................................... 51
          Table 53: Better Access program: service Utilisation, ISML regions, 2009-10 ............. 52
     5.4.3.        Key Indigenous health findings ....................................................................... 52
6.        PRIMARY HEALTH WORKFORCE CAPACITY ..................................................... 54
     6.1.       General practice ................................................................................................ 54
          Table 54: Summary of general practice workforce statistics, ISML, 2011-12 ............... 54
          Figure 17 & 18: GP gender proportions and GP age proportions, ISML, 2011-12 ........ 54
          Figure 19: Distribution of general practices, ISML regions, 2012 ................................ 55
          Figure 20: GP distribution*, ISML regions, 2012 ........................................................ 55
          Figure 21: Estimates of GP full-time equivalents (FTE) rates per 100,000 population^,
          ISML regions, 2012 .................................................................................................. 56
          Figure 22: Age distribution of general practitioners, ISML, 2012 ................................. 56
          Figure 23: Proportions of practices employing practice nurses, ISML regions, 2012 .... 57
     6.2.       Allied health ...................................................................................................... 57
          Figure 24: Proportions of allied health professionals*, ISML, 2013 .............................. 57
7.        CONCLUSION .................................................................................................. 59
     1.      Demographic and socio-economic priority groups .................................................. 59
     2.      Heath priority themes ............................................................................................ 59
     3.      Other priority themes ............................................................................................ 59
KEY ....................................................................................................................... 60
BIBLIOGRAPHY ...................................................................................................... 61

                                                                                                                           Page | 6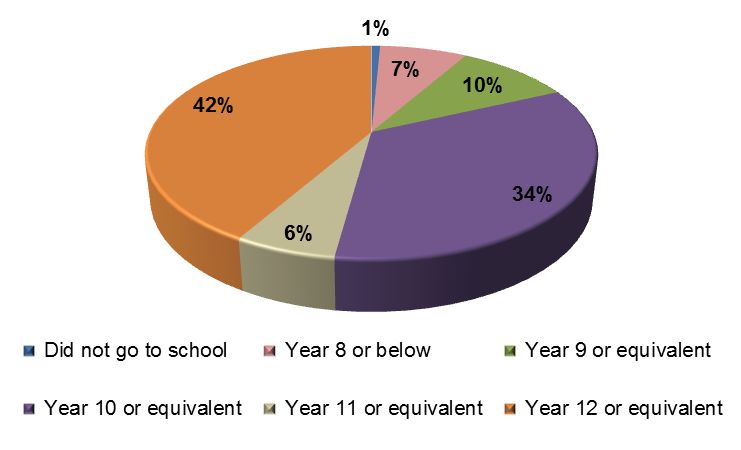
Population Health Profile: 2013

1. GEOGRAPHY

The Illawarra-Shoalhaven Medicare Local (ISML) covers a large geographic region that
extends for 5687.3 square kilometres (sq km) from Helensburgh in the northern Illawarra to
North Durras in the southern Shoalhaven1. The Illawarra typically refers to the three Local
Government Areas (LGAs) of Wollongong, Shellharbour and Kiama whilst the Shoalhaven
consists entirely of the Shoalhaven LGA2. The Commonwealth Territory of Jervis Bay also
falls under the catchment area of the ISML. The Wollongong LGA and the Shoalhaven LGA
are further divided into two Statistical Local Areas (SLAs) called Wollongong–Inner and
Wollongong-Balance and Shoalhaven-Pt A and Shoalhaven-Pt B respectively. For ease of
understanding and convenience the ISML catchment will be described using the terminology
listed in Table 1. A geographic representation of the Illawarra-Shoalhaven SLAs is shown in
Figure 1.

Table 1: Illawarra Shoalhaven Medicare Local (ISML) regional geography
 LOCAL GOVERNMENT          STATISTICAL LOCAL              HEALTH PROFILE TERMINOLOGY
     AREA (LGA)               AREA (SLA)                Areas              Regions
Commonwealth Territory  Jervis Bay Territory          JERVIS BAY         JERVIS BAY
      Kiama (A)              Kiama (A)                  KIAMA               KIAMA
   Shellharbour (C)      Shellharbour (C)           SHELLHARBOUR       SHELLHARBOUR
                       Shoalhaven (C) - Pt A                        NOWRA-BOMADERRY
    Shoalhaven (C)                                  SHOALHAVEN
                       Shoalhaven (C) - Pt B                        SHOALHAVEN Balance
                       Wollongong (C) - Inner                        WOLLONGONG Inner
    Wollongong (C)                                  WOLLONGONG
                       Wollongong (C) – Bal                         WOLLONGONG Balance
          ILLAWARRA-SHOALHAVEN                                ISML Catchment

Figure 1: Map of Illawarra-Shoalhaven indicating all Statistical Local Areas (SLA)

                                                                                   Page | 7
Population Health Profile: 2013
2. DEMOGRAPHY
2.1. Existing population indicators
The 2011 estimated resident population of the ISML catchment is shown in Table 2. The
Wollongong Inner and the Shellharbour regions are the most densely populated regions
within the ISML catchment. Compared to the NSW state population density figure of nine
persons/sq km, all ISML regions except Jervis Bay stand higher than the state average. The
Shoalhaven Balance region clearly resembles rural population distributions with a density
figure of only 14.3 persons/sq km. The Usual Resident Population counts have also been
mapped in Figure 2.
Table 2: Estimated resident population, ISML regions, 2011
Estimated resident Population density
REGIONS population (ERP) (persons/sq km)
JERVIS BAY 387 5.7
KIAMA 20,832 80.8
SHELLHARBOUR 66,054 448.2
NOWRA-BOMADERRY 34,444 163.9
SHOALHAVEN Balance 61,599 14.3
WOLLONGONG Inner 104,601 1380.3
WOLLONGONG Balance 96,614 158.9
ISML Catchment 384,531 67.6
Source: ABS 2012
Figure 2: Map of total usual resident population, ISML regions, 2011
Page | 8Population Health Profile: 2013
The age structure distribution of the population of the ISML catchment as shown in Table 3
and Figure 3 indicates an overall ageing population with 17.6% aged 65 years and above.
The Shoalhaven Balance region has a significantly higher proportion of older aged
population while Shellharbour and Jervis Bay regions have the highest proportion of school
aged children.
Table 3: Population age structure, ISML regions, 2011
REGIONS 0-4 5-14 15-24 25-44 45-64 65-74 75 & over Total
JERVIS BAY 24 74 77 144 49 12 7 387
KIAMA 1,076 2,540 2,565 4,215 6,253 2,181 2,002 20,832
SHELLHARBOUR 4,453 9,415 9,120 16,912 16,840 5,276 4,038 66,054
NOWRA-
2,327 4,536 4,788 8,172 8,787 3,049 2,785 34,444
BOMADERRY
SHOALHAVEN
3,082 6,924 5,953 11,106 18,454 8,815 7,265 61,599
Balance
WOLLONGONG
6,136 11,280 16,753 28,642 25,164 8,183 8,443 104,601
Inner
WOLLONGONG
6,358 12,760 12,661 24,348 24,762 8,333 7,392 96,614
Balance
ISML Catchment 23,456 47,529 51,917 93,539 100,309 35,849 31,932 384,531
Source: ABS 2012
Figure 3: Population age structure, ISML regions, 2011 - percentages
Source: ABS 2012
Page | 9Population Health Profile: 2013
Tourism is also a major factor in assessing population especially during the peak holiday
periods. 2011 Tourism NSW data indicates that the Shoalhaven and Wollongong areas
received the largest number of tourist nights with 3,800,000 and 2,836,000 respectively.
With the South Coast standing as the third most visited tourist area within NSW in 2011,
the regions of Shoalhaven Balance and the Wollongong Inner were amongst the top
three most visited regions of the South Coast. Additionally the Shoalhaven Balance area
had the second highest number of tourist nights in NSW. Tourism NSW estimates that
Shoalhaven receives 35% of its annual visitor nights or approximately 33,000 visitors per
night during the period between Christmas and the end of January. This additional influx
of tourist population adds to the health and welfare responsibilities of the regional
primary and tertiary healthcare providers.
2.2. Population projections
The total population of the Illawarra-Shoalhaven is projected to reach 421,830 in 2021
with the addition of 37,686 more residents. This equates to an average annual growth
rate of 0.9% projected per annum. With a projected average annual growth rate of 1.9%,
the region of Shoalhaven Balance is expected to have the highest growth in its
population followed by the Wollongong Balance region with a 1.2% projected per annum
growth from 2011 to 2021.The respective regional population projections for all age
groups are shown in Table 4 and Table 5.
Table 4: Population projections, ISML regions, 2021
REGIONS 0-4 5-14 15-24 25-44 45-64 65-74 75+ Total
KIAMA 1,090 2,510 2,430 4,220 6,280 3,040 2,580 22,150
SHELLHARBOUR 4,600 9,390 8,880 18,380 18,060 7,310 5,660 72,280
NOWRA-
2,220 4,460 4,230 8,690 9,340 4,740 4,030 37,710
BOMADERRY
SHOALHAVEN
3,480 7,940 5,810 12,560 21,640 12,810 9,730 73,970
Balance
WOLLONGONG
6,170 11,710 15,000 28,360 26,200 10,410 9,460 107,310
Inner
WOLLONGONG
6,970 13,380 12,380 26,950 26,750 11,300 10,680 108,410
Balance
ISML Catchment 24,530 49,390 48,730 99,160 108,270 49,610 42,140 421,830
Source: NSW Department of Planning, 2010
Page | 10Population Health Profile: 2013
Table 5: Projected change in population, ISML regions, 2011-2021 - numbers
REGIONS 0-4 5-14 15-24 25-44 45-64 65-74 75+ Total
KIAMA 14 -30 -135 5 27 859 578 1,318
SHELLHARBOUR 147 -25 -240 1,468 1,220 2,034 1,622 6,226
NOWRA-
-107 -76 -558 518 553 1,691 1,245 3,266
BOMADERRY
SHOALHAVEN
398 1,016 -143 1,454 3,186 3,995 2,465 12,371
Balance
WOLLONGONG
34 430 -1,753 -282 1,036 2,227 1,017 2,709
Inner
WOLLONGONG
612 620 -281 2,602 1,988 2,967 3,288 11,796
Balance
ISML Catchment 1,098 1,935 -3,110 5,765 8,010 13,773 10,215 37,686
Source: NSW Department of Planning, 2010
The additional resident population numbers based on the above projections would be shared
amongst the four major areas of the Illawarra-Shoalhaven in the following proportions:
Figure 4: Share of projected additional residents, ISML areas, 2011-2021
Hence ISML primary population health planning and primary health service delivery would
be palnned and actioned in accordance with the above indicated population growth figures.
Page | 11Population Health Profile: 2013
2.3. Population diversity and target groups
The resident population of the ISML catchment is represented by several diverse population
groups. The cultural, ethnic and socio-demographic diversity of the catchment’s population is
one of the prime reasons why ISML will use the population health approach to identify local
needs and inform the development of focused and responsive primary care services that
would holistically cater to all targeted niche groups and populations within the catchment.
2.3.1. Culturally and linguistically diverse (CALD) communities
There is a significant proportion of the ISML population that is identified as being of non-
English speaking background (NESB). This includes people born overseas in predominantly
non-English speaking countries who have migrated to Australia and are currently residing
within the ISML catchment (as identified during Census data collections 2011). The
percentage of NESB population in the ISML catchment is below the NSW state and
Australian national averages. However, with the University of Wollongong and its full
services equipped campus at the Shoalhaven area attracting several international students
and researchers each year, the numbers in the CALD community are expected to continue
rising. In addition, the Illawarra-Shoalhaven is also expected to receive an inflow of a
significant number of refugee populations in the coming years. According to the NSW Health
Refugee Health Plan3, Wollongong has been one of the prime areas to receive significant
numbers of newly arrived refugee and humanitarian entrants seeking initial settlement in
rural and regional areas of NSW. Hence ISML healthcare planning aims to be mindful of
these circumstances and the impending increase of the NESB population in the catchment.
Table 6 shows the figures for the NESB population in the ISML catchment compared to
NSW and Australia. Figure 5 maps the concentration distributions of NESB populations in
the ISML regions.
Table 6: Non-English speaking background (NESB) population, ISML regions, 2011
REGIONS Total NESB % of total population
JERVIS BAY 12 3.2
KIAMA 906 4.5
SHELLHARBOUR 6,029 9.5
NOWRA-BOMADERRY 1,464 4.4
SHOALHAVEN Balance 3,020 5.1
WOLLONGONG Inner 15,066 15.1
WOLLONGONG Balance 12,412 13.4
ISML Catchment 38,909 10.5
New South Wales 3,380,790 18.6
Australia 1,288,852 15.7
Source: ABS Census 2011
Page | 12Population Health Profile: 2013
Figure 5: Map of culturally and linguistically diverse population, ISML regions, 2011 –
percentages of total population
A major reason for ISML to focus its population health planning on CALD communities is to
improve primary healthcare delivery within the region amongst populations that have been
identified as being at a relative disadvantage in terms of accessing quality healthcare.
Recent research evidence is suggestive of improved clinical outcomes and patient
satisfaction with received care through implementation of language interpretation services
for multilingual consumers or persons having limited English language proficiency 4. With a
significant number of the ISML catchment population identifying as having poor proficiency
at speaking English, ISML population health planning will attempt to seek ways of adopting
language interpretation services within general practice to improve community health
outcomes and ease service delivery to niche groups. Table 7 below shows the number and
percentage of persons with poor proficiency at speaking English in the ISML regions.
Page | 13Population Health Profile: 2013
Table 7: Poor proficiency at speaking English, ISML regions, 2011
Persons who speak English % of all persons aged
REGIONS not well or not at all five years and over
JERVIS BAY 3 0.8
KIAMA 47 0.2
SHELLHARBOUR 842 1.4
NOWRA-BOMADERRY 97 0.3
SHOALHAVEN Balance 170 0.3
WOLLONGONG Inner 2,498 2.7
WOLLONGONG Balance 2,549 2.9
ISML Catchment 6,206 1.8
New South Wales 513,583 3.4
Australia 218,146 2.6
Source: ABS Census 2011
2.3.2. Indigenous population
Indigenous populations form a significant proportion of the ISML catchment. Indigenous
refers to persons identified as being of Aboriginal and/or Torres Strait Islander origin as
identified by the 2011 Census conducted by the Australian Bureau of Statistics (ABS). 2011
figures identify 3.0% of the ISML catchment population to be of Aboriginal or Torres Strait
Islander origin. This is higher than both the NSW state and Australian national averages,
both of which are estimated to be 2.5% of the respective populations identified as
Indigenous in 2011. The Nowra-Bomaderry region has the highest proportional share of
Indigenous population with 7% of its residents identified as Indigenous as per the 2011 ABS
Census.
While the concentration distribution of Indigenous persons is significantly higher within the
Shoalhaven area with 7% of its resident population being Indigenous, the Illawarra region
comprising the Wollongong, Kiama and Shellharbour areas has almost 59% of the total
Indigenous population of the Illawarra-Shoalhaven catchment. The Shoalhaven area along
with the Jervis Bay region account for the rest of the 41% of the Indigenous population of the
ISML catchment. Table 8 shows the gross numbers and proportional percentages of the
Indigenous population of ISML compared to NSW and Australia. Figure 6 maps the
concentration distributions of the Indigenous population in the ISML regions.
With a dedicated Closing the Gap team, the Popullation Health initiatives of the Illawarra-
Shoalhaven Medicare Local will aim to keep the healthcare needs of the indigenous
community of the catchment in the forefront and plan service delivery accordingly.
Page | 14Population Health Profile: 2013
Table 8: Indigenous population, ISML regions, 2011
REGIONS Indigenous persons % of total population
JERVIS BAY 227 59.9
KIAMA 285 1.4
SHELLHARBOUR 1,930 3.0
NOWRA-BOMADERRY 2,338 7.0
SHOALHAVEN Balance 1,980 3.3
WOLLONGONG Inner 1,807 1.8
WOLLONGONG Balance 2,422 2.6
ISML Catchment 10,989 3.0
New South Wales 172,621 2.5
Australia 548,368 2.5
Source: ABS Census 2011
Figure 6: Map of Indigenous population, ISML regions, 2011 – percentage of total
population
Page | 15Population Health Profile: 2013
The age distribution of the Indigenous population in the Illawarra-Shoalhaven differs
markedly from the age distribution of the non-Indigenous population. The age bracket of 0-
19 years of age, accounts for almost 49% of the Indigenous population of ISML. Figure 7
below illustrates the wide differences in age structure of Indigenous persons within the
Illawarra-Shoalhaven compared to non-Indigenous persons. The marked differences in older
ages are primarily due to the differences in life expectancy between Indigenous and non-
Indigenous Australians.
Figure 7: Age distribution comparison of Indigenous and non-Indigenous population,
ISML catchment, 2011
Source: ABS Census 2011
2.3.3. Aged population
Australia has long-standing demographic trends of an ageing population and lower birth
rates5. With life expectancy figures rising consistently and falling birth rates constantly
standing at below replacement levels, Australia’s population is ageing rapidly. This is hence
a prime healthcare focus for all health services in Australia and also the rationale for the
ISML to focus on the ageing population within the adopted population health approach to
primary care planning.
In 2011 it was estimated that 17.6% of the ISML catchment population were aged 65 years
and above. This is significantly higher than the NSW state average of 14.5% and the
Australian national average of 13.8%. Within the ISML catchment the Shoalhaven Balance
region has the highest proportion of old aged residents with 26.1% of the population being
aged 65 years and above. The Kiama region is placed second with an estimated figure of
20.1% of the population aged 65 years and above. Table 9 shows the proportions of aged
population for all ISML regions. Figure 8 maps the concentration distributions of the
population aged 65 years and above in the ISML regions.
Page | 16Population Health Profile: 2013
Figure 8: Map of population aged 65 years and above, ISML regions, 2011 –
percentage of total population
Table 9: Population aged 65 years and above, ISML regions, 2011
REGIONS 65 years and above % of total population
JERVIS BAY 19 4.9
KIAMA 4,183 20.1
SHELLHARBOUR 9,314 14.1
NOWRA-BOMADERRY 5,834 16.9
SHOALHAVEN Balance 16,080 26.1
WOLLONGONG Inner 16,626 15.9
WOLLONGONG Balance 15,725 16.3
ISML Catchment 67,781 17.6
New South Wales 1,044,323 14.5
Australia 3,076,539 13.8
Source: ABS 2012
Page | 17Population Health Profile: 2013
It is also estimated that 64% of the additional projected population of 2021 will be aged 65 years
and above. While the population of persons aged 65 years and over in the Illawarra-Shoalhaven
is projected to grow at an average annual growth rate of 3.1% till 2021, the Nowra-Bomaderry
region is projected to have the highest growth with an overall increase of 50.3% by 2021. Table
10 shows these population changes for persons aged 65 years and over.
Table 10: Population projections for persons aged 65 years and above, ISML regions,
2021
Average annual
REGIONS 2011 ERP 2021 projected no. Change 2011-2021 (%)
growth rate ( %)
KIAMA 4,183 5,620 34.4 3.0
SHELLHARBOUR 9,314 12,970 39.3 3.4
NOWRA-BOMADERRY 5,834 8,770 50.3 4.2
SHOALHAVEN Balance 16,080 22,540 40.2 3.4
WOLLONGONG Inner 16,626 19,870 19.5 1.8
WOLLONGONG
15,725 21,980 39.8 3.4
Balance
ISML Catchment 67,781 91,750 35.4 3.1
New South Wales 1,044,323 1,398,720 33.9 3.0
Table 10: Calculations based on Table 4
Consequently the projections for persons aged 85 years and over are even higher with their
population projected to grow at an average of 4.2% annually leading to a 50.3% increase in
the overall figures for the ISML catchment. Table 11 shows these population changes for
persons aged 85 years and over.
Table 11: Population projections for persons aged 85 years and above, ISML regions,
2021
Average annual
REGIONS 2011 ERP 2021 projected no. Change 2011-2021 (%)
growth rate ( %)
KIAMA 605 920 52.1 4.3
SHELLHARBOUR 913 1,490 63.2 5.0
NOWRA-BOMADERRY 769 1,170 52.1 4.3
SHOALHAVEN Balance 1,820 2,600 42.9 3.6
WOLLONGONG Inner 2,451 3,090 26.1 2.3
WOLLONGONG
1,839 3,350 82.2 6.2
Balance
ISML Catchment 8,397 12,620 50.3 4.2
New South Wales 140,748 189,480 34.6 3.0
Table 11: Calculations based on Table 4
Page | 18Population Health Profile: 2013
2.3.4. Single parent population
Table 12 indicates that the Illawarra-Shoalhaven has a higher proportion of single parent
population compared to the NSW state and Australian national averages. Apart from Jervis
Bay, the Shellharbour region has the highest proportion of single parents in the catchment.
Table 12: Single parent population, ISML regions, 2011
REGIONS Total single parents % total population above 15 years
JERVIS BAY 31 11.0
KIAMA 723 4.4
SHELLHARBOUR 3,345 6.7
NOWRA-BOMADERRY 1,743 6.6
SHOALHAVEN Balance 2,668 5.4
WOLLONGONG Inner 4,479 5.4
WOLLONGONG Balance 4,467 6.0
ISML Catchment 17,456 5.8
New South Wales 297,904 5.3
Australia 901,636 5.2
Source: ABS Census 2011
An even more sensitive indicator is the proportion of single parent families with children
under the age of 15 years. Table 13 shows that figures for this indicator are significantly
higher for the ISML catchment compared to both the NSW state and Australian national
average.
Table 13: Single parent families with children aged below 15 years, ISML regions, 2011
Single parent families with % of total families with
REGIONS
children under 15 years children under 15 years
JERVIS BAY 20 51.3
KIAMA 359 19.3
SHELLHARBOUR 1,882 25.9
NOWRA-BOMADERRY 1,066 31.5
SHOALHAVEN Balance 1,504 29.3
WOLLONGONG Inner 2,137 22.7
WOLLONGONG Balance 2,307 23.1
ISML Catchment 9,275 25.0
New South Wales 151,157 21.2
Australia 472,848 21.3
Source: ABS Census 2011
Page | 19Population Health Profile: 2013
2.3.5. Regional or remote populations
Health care services can often be relatively inaccessible for persons residing in regional and
remote places. The ISML catchment population structure has been quantified according to
the current ‘Remoteness Structure’ as per the Australian Standard Geographical
Classification 20066. According to this classification 5 Remoteness Areas (RA) have been
formulated where each RA represents an aggregation of non-contiguous geographical areas
which share common characteristics of remoteness. The population distribution of ISML
indicates a little over 31% of the population being in Inner Regional areas (RA2) and 0.06%
residing in Remote areas (RA3). The RA3 sections, even though negligible, belong to the
Shoalhaven Balance region. These regional population variations by RA categories are
shown in Table 14 below.
Table 14: Population by remoteness categories, ISML, 2011
RA Category RA category Name Population %of ISML total
RA1 Major cities of Australia 264,493 68.78
RA2 Inner regional Australia 119,822 31.16
RA3 Outer regional Australia 216 0.06
RA4 Remote Australia 0 0
RA5 Very remote Australia 0 0
Source: ABS 2013
Page | 20Population Health Profile: 2013
3. SOCIO-ECONOMY
Socio-economic equity and addressing the disparities of the social determinants of health will
be the prime focus of the ISML Population Health approach to primary healthcare planning.
Under this methodology, ISML aims to evaluate several measures of socio-economic status of
regions in our catchment. One important resource is the Socio-Economic Indexes for Areas
(SEIFA) Scores that is prepared by the Australian Bureau of Statistics (ABS)7 by population-
weighted averages of scores of Census Collection Districts (CDs) in Australia. The reference
value for the whole of Australia is set to 1000. Lower values indicate lower socio-economic
status. Table 15 shows the 2011 Index of Relative Socio-Economic Disadvantage SEIFA
scores for all regions of the ISML catchment and their national and state rankings in order of
being the most socio-economically disadvantaged SLA in Australia, as estimated in 2011.
Table 15: Index of relative socio-economic disadvantage, ISML regions, 2011
REGIONS SEIFA score Australia ranking NSW state ranking
JERVIS BAY 789 56 1
KIAMA 1055 1077 175
SHELLHARBOUR 969 455 96
NOWRA-BOMADERRY 940 260 47
SHOALHAVEN Balance 962 406 87
WOLLONGONG Inner 991 634 129
WOLLONGONG Balance 968 445 93
Source: ABS 2013
Overall the ISML catchment continues to have higher unemployment rates and lower labour
force participation rates than both the NSW state and Australian national averages.
Table 16: Unemployment rate and labour force participation, ISML regions, June 2011
REGIONS Unemployment rate (%) Labour force participation (%)
KIAMA 3.8 59.0
SHELLHARBOUR 7.4 59.2
NOWRA-BOMADERRY 10.0 62.1
SHOALHAVEN Balance 6.7 54.4
WOLLONGONG Inner 6.5 56.8
WOLLONGONG Balance 7.3 59.0
ISML Catchment 7.1 57.9
New South Wales 5.1 64.6
Australia 5.1 66.2
Source: DEEWR Report June 2011
Page | 21Population Health Profile: 2013
While research has proven that unemployment is strongly associated with poor physical and
mental health,8 9 the health and social impacts of unemployment are reported to be even
more catastrophic for children within jobless families. In 2011 it was found that within the
Illawarra-Shoalhaven 16.2% of all children below 15 years of age belonged to jobless
families, with 15.9% of all jobless families having to support children under the age of 15
years. Apart from the Jervis Bay region, both these indicators were reported to be the
highest for the Nowra-Bomaderry region, with the ISML average being higher than both the
NSW and Australian averages. Table 17 shows the findings across the region for both these
indicators with comparisons across state and national figures.
Table 17: Jobless families and children under 15 years of age, ISML regions, 2011
Families Children
REGIONS Jobless families % of total families Children under 15 % of total
with children with children years in jobless children under 15
under 15 years under 15 years families years
JERVIS BAY 15 40.5 45 52.3
KIAMA 145 7.8 259 7.7
SHELLHARBOUR 1,142 15.7 2,181 16.8
NOWRA-BOMADERRY 715 21.2 1,304 21.4
SHOALHAVEN Balance 995 19.4 1,780 19.5
WOLLONGONG Inner 1,345 14.3 2,236 13.9
WOLLONGONG Balance 1,541 15.4 2,825 15.9
ISML Catchment 5,898 15.9 10,630 16.2
New South Wales 100,680 14.1 185,239 14.7
Australia 294,874 13.3 541,792 13.9
Source: PHIDU Social Health Atlas of Australia: Medicare Locals, published 2013
While unemployment figures indicate a significant disadvantage within the population, very
low income earners are also at a high level of social disadvantage that ultimately leads to
poorer health status. This is also a prime focus for the ISML Population Health approach in
order to make primary health care services affordable and accessible for the entire
population. While the poverty line benchmark for single adults ranges between $358 to
$470.36 per week10 11 depending on the sources and inclusions such as housing, persons
with a personal income of below $300 per week have been identified as very low income
earners. Table 18 indicates the number of persons earning less than $300 per week (less
than $15,600 per annum) and their percentage within the ‘eligible for earning’ total
population i.e. persons aged above 15 years of age. The Shoalhaven Balance region has
the highest proportion of very low income earners followed by Shellharbour. The Illawarra-
Shoalhaven overall has a higher percentage of very low income earners than both the NSW
state and Australian national average. This increases the socio-economic disadvantage of
the Illawarra-Shoalhaven residents in addition to the existing high unemployment rates
across the region as indicated in Table 16.
Page | 22Population Health Profile: 2013
Table 18: Very low income earners (less than $300 per week), ISML regions, 2011
REGIONS Low Income Earners % total population above 15 years
JERVIS BAY 84 29.8
KIAMA 4,077 24.7
SHELLHARBOUR 14,908 29.8
NOWRA-BOMADERRY 7,158 27.0
SHOALHAVEN Balance 15,141 30.4
WOLLONGONG Inner 23,951 28.9
WOLLONGONG Balance 21,891 29.6
ISML Catchment 87,210 29.1
New South Wales 1,481,328 26.5
Australia 4,499,310 25.9
Source: Statistically modeled from ABS Census 2011
A more specific indicator of economic hardship constructed by the Australian Bureau of
Statistics is the gross household weekly income 12. Using the 2007-08 median equivalised
disposable household income for all households in NSW of $676 per week12, comparisons
across the ISML region for percentage of households with gross weekly incomes of below
$600 are shown in Table 19. As gross numbers cannot compare income levels between
households of differing size and composition, an equivalised figure derived from applying the
'modified OECD' equivalence scale15 has also been shown in Table 19.
Table 19: Low income households (less than $600 per week), ISML regions, 2011
% total households with income below $600 per week as per: -
REGIONS
Gross Household Income Equivalised Household Income
JERVIS BAY 32.0 62.6
KIAMA 22.6 36.4
SHELLHARBOUR 26.9 43.9
NOWRA-BOMADERRY 31.6 50.8
SHOALHAVEN Balance 37.4 56.9
WOLLONGONG Inner 29.4 42.4
WOLLONGONG Balance 28.3 44.6
ISML Catchment 29.9 46.1
New South Wales 24.2 38.9
Australia 23.7 38.0
Source: Statistically modeled from ABS Census 2011
Page | 23Population Health Profile: 2013
The above illustrated economic indicators lead to wider impacts on several health and social
inequalities through various interdependent factors. The most vital ones of these have been
grouped in the following themes for the purposes of assisting ISML in designing focused
population health strategies.
3.1. Access
Access to affordable and responsive transport is a significant problem for many ISML
catchment residents. The Illawarra-Shoalhaven geography and a limited public transport
system, especially in remote and isolated communities, make it difficult for many people to
easily access health services. These issues are heightened in the rural areas, particularly
among Indigenous communities. For example, those living at the most southern part of the
Shoalhaven need to travel more than 100km to the Shoalhaven District Memorial Hospital in
Nowra, and a further 75-80km to Wollongong hospital. 2011 ABS data suggests that 9.1% of
households within the Illawarra-Shoalhaven did not have a motor vehicle, with the
percentage being highest for the Wollongong Inner region. Access to non-urgent health care
services from both outer metropolitan and regional areas is impacted significantly by access
to private transport and easily accessible and affordable public transport options. Table 20
shows the numbers and percentages of households with no motor vehicle within the
Illawarra-Shoalhaven. ISML will continue to work with the Illawarra-Shoalhaven Local Health
District (ISLHD) to seek improvements in the public transport infrastructure in the catchment,
addressing the inequities in health access, that occur due to the lack of appropriate public
transport, especially for the Shoalhaven area, and the absence of motor vehicle ownership
by a segment of the population as shown in Table 20.
Table 20: Private dwellings with no motor vehicle, ISML regions, 2011
Occupied private dwellings with % of total occupied private
REGIONS
no motor vehicle households
JERVIS BAY 11 12.6
KIAMA 341 4.6
SHELLHARBOUR 1,584 7.1
NOWRA-BOMADERRY 1,036 8.6
SHOALHAVEN Balance 1,332 5.6
WOLLONGONG Inner 5,113 13.2
WOLLONGONG Balance 3,088 9.4
ISML Catchment 12,505 9.1
New South Wales 258,152 10.4
Australia 665,851 8.6
Source: ABS Census 2011
Telecommunication and e-health solutions to primary health care delivery are two of ISML’s
prime focuses under the Population Health approach and are being envisaged by ISML to
reduce the inequity in health care access across the catchment’s geography, especially to
regional communities. ISML aims to investigate solutions to inaccessibility of healthcare
through advocating and assisting in uptake of e-health initiatives by primary health care
professionals within the catchment. ISML will devote conscious efforts into bringing e-health
Page | 24Population Health Profile: 2013
and telehealth options to populations with limited health access. This is in line with the
National Broadband Network (NBN) roll‐out that has already commenced in the Kiama area
and parts of Shellharbour and Wollongong, focusing on the delivery of high‐quality
NBN‐enabled telehealth services in-home to older Australians with chronic conditions.13 As
broadband internet connection allows households to access a vast range of communication
tools and offers the potential to improve access to health care through communication
solutions, households without any internet connectivity will be a prime focus of ISML’s
population health and primary health delivery planning. 2011 ABS data suggests that 23.6%
of households across the ISML catchment did not have any form of internet connectivity.
This is higher than both the NSW state and Australian national averages. Table 21 shows
the numbers and percentages of households with no internet connection within the ISML
catchment. The Nowra-Bomaderry region emerges as having the highest percentage of
private households with no internet connectivity.
Table 21: Private dwellings with no internet connection, ISML regions, 2011
Occupied private dwellings % of total occupied private
REGIONS
with no internet connection households
JERVIS BAY 42 49.4
KIAMA 1,283 17.3
SHELLHARBOUR 5,053 22.5
NOWRA-BOMADERRY 2,941 24.3
SHOALHAVEN Balance 6,489 27.2
WOLLONGONG Inner 8,661 22.3
WOLLONGONG Balance 7,988 24.3
ISML Catchment 32,457 23.6
New South Wales 495,949 20.1
Australia 1,525,107 19.7
Source: ABS Census 2011
As indicated in Section 2 of this report (Demography), the Illawarra-Shoalhaven catchment
has a large proportion of identified target population groups such as the aged population,
indigenous persons and single parent populations; who also represent socio-economically
disadvantaged groups in terms of gaining access to affordable health and social services.
Through the Centrelink program, the Department of Human Services delivers a range of
payments and services for such niche population groups such as retirees, the unemployed,
families, carers, parents, people with disabilities, Indigenous Australians, and people from
diverse cultural and linguistic backgrounds. While these payments are aimed to enable
disadvantaged persons to afford and access health and social services; they have always
been empirically proven indicators of socio-economic disadvantage34. Table 22 below shows
the latest 2011 data on the major population groups receiving any form of income support
from Centrelink, and their proportions for all the ISML regions compared with the NSW state
and Australian national percentages. Across all the centrelink income recipient groups the
Page | 25Population Health Profile: 2013
percentages for the ISML catchment are much higher than the NSW and Australian
averages.
Table 22: Centrelink income support recipients, ISML regions, 2011
Welfare-
Female sole Youth
Age Disability Long-term dependent
parent unemployment
pensioner support unemployment families
pensioners benefit
REGIONS (% of 65 pensioners benefit recipients (with
(% of recipients (% of
years & (% of 16-64 (% of 16-64 years children)
females 15- 15-24 years
Above) years aged) aged) (% of all
54 years) aged)
families)
KIAMA 70.2 3.8 4.1 2.0 3.6 5.6
SHELLHARBOUR 89.7 7.9 7.2 3.9 7.0 10.9
NOWRA- 92.0 11.5 10.0 6.0 10.8 15.9
BOMADERRY
SHOALHAVEN 73.8 9.5 8.1 4.7 8.6 10.5
Balance
WOLLONGONG 77.5 6.7 4.5 3.4 5.1 8.4
Inner
WOLLONGONG 82.8 8.2 6.7 4.2 7.1 10.5
Balance
ISML Catchment 80.4 8.0 6.5 4.0 6.8 10.2
New South Wales 71.2 5.7 5.1 3.2 5.3 9.7
Australia 74.6 5.6 5.0 3.1 5.5 9.3
Source: PHIDU Social Health Atlas of Australia: Medicare Locals, published 2013.
The above mentioned indicators play a mojor role in the accessibility and affordability of
healthcare services for the significantly high proportion of the ISML population that are
affected by these indicators. These findings in addition to the high rates of unemployement
in the catchment and the high proportions of low income earning persons and households as
identified earlier in this section of the report; present an escalating challenge for primary
healthcare planners and service providers to deliver socially and economically equitable
primary healthcare to the Illawarra-Shaoalhven community.
Furthermore, it is well known that access to timely, effective and cost-efficient healthcare
services is also dependent on an individual’s ability to afford private health insurance.
Hence, this leads to health insurance being a key indicator of inequality in the community.
Table 23 shows the synthetic estimates based on the 2007 ABS National Health survey and
indicates much lower coverage rates for ISML compared to the NSW state and Australian
national rates. Additionally, the 2009 data for the percentage of health care card holders
issued by the Department of Human Services also indicates a high proportion of low income
earners aged below 65 years of age in the Illawarra-Shoalhaven who receive Centrelink
payments and therefore concessions on health care costs. Table 23 illustrates these
indicators across all regions within the Illawarra-Shoalhaven catchment.
Page | 26Population Health Profile: 2013
Table 23: Private health insurance and health care card coverage, ISML regions
Health Care Card holders (% Private Health Insurance Holders
REGIONS
population aged 0-64 years), 2011 (ASR per 100), 2007-08
JERVIS BAY 7.5 0.0
KIAMA 5.7 61.7
SHELLHARBOUR 7.7 38.9
NOWRA-BOMADERRY 10.4 37.5
SHOALHAVEN Balance 9.7 36.3
WOLLONGONG Inner 7.9 42.9
WOLLONGONG Balance 7.9 40.6
ISML Catchment 8.2 41.1
New South Wales 7.4 48.0
Australia 7.8 46.9
Source: PHIDU Social Health Atlas of Australia: Medicare Locals, published 2012. Refer to KEY
3.2. Education
Education is a strong determinant of income and social status. As shown in Figure 9, 52% of
the ISML catchment population is estimated to have Year 10 or less as their highest year of
school education, as per the ABS 2011 Census.
Figure 9: Highest year of schooling completed, ISML catchment, 2011
Source: ABS Census 2011
Page | 27Population Health Profile: 2013
Education is of prime importance for young people and is significantly instrumental in
building a healthy and prospering community. In 2011 it was estimated that 76.4% of the
ISML catchment population aged 15-19 years was enrolled in some kind of education
institute, either full-time, part-time or neither but enrolled. It was also estimated that 28.3% of
the population aged 15-24 years were enrolled in some form of higher education such as
university/other tertiary institution and/or technical/further education institutes (incl. TAFE
colleges), while 79.6% of the population aged 15-19 years were learning or earning by being
engaged in school, work or further education/training.
Table 24 shows the participation in any form of education for persons aged 16 years and for
school leavers (majority aged 17 years) along with learning or earning status of 15 to 19 year
olds. Given that the University of Wollongong has its major campus in the Wollongong Inner
region and that TAFE and other educational avenues are also located in the Wollongong
Inner region, the education enrolment percentages are highest for this region, along with
Kiama, amongst all other ISML catchment regions. While figures of participation in full-time
education at age 16 years is higher for the Illawarra-Shoalhaven than NSW state and
Australian averages; the figures for school leavers participation in higher education is very
low for the region. Additionally figures are the lowest for the Nowra-Bomaderry region which
are estimated to be only 17.2% compared to the Australian national average of 30.4%. The
Nowra-Bomaderry region also has the lowest percentage of young adults engaged in some
form of learning or earning at ages 15 to 19.
Table 24: Youth participation in education, ISML regions, 2011 & 2012
% of full-time participation % learning or % school leavers in
REGIONS in any form of education at earning at ages 15 to higher education in
age 16 in 2011 19 in 2011 2012
JERVIS BAY 58.3 100.0 NA
KIAMA 85.6 85.0 33.2
SHELLHARBOUR 78.2 78.5 19.9
NOWRA-BOMADERRY 73.6 69.7 17.2
SHOALHAVEN Balance 78.7 76.7 19.4
WOLLONGONG Inner 85.2 83.7 33.7
WOLLONGONG Balance 80.7 80.3 25.1
ISML Catchment 80.4 79.6 22.7
New South Wales 80.1 81.4 29.1
Australia* 79.1 80.1 30.4
* Excludes Queensland Source: PHIDU Social Health Atlas of Australia: Medicare Locals, published 2012 and 2013
3.3. Early childhood indicators
The early childhood period is considered by the World Health Organisation to be the most
important developmental phase throughout the lifespan and hence early childhood
development has been identified as a key theme of the several social determinants of
health14. A vital indicator of community health that is drawn from early childhood access to
Page | 28Population Health Profile: 2013
health services is the regional immunisation coverage rates. While the Shoalhaven area has
consistently ranked amongst the top 10 regions in NSW (divisions based ranking), the
Illawarra has scope to further enhance coverage in the Wollongong, Kiama and Shellharbour
areas. With a 91.6% figure for overall coverage, the Shoalhaven ranked 9 th in all NSW
divisions as of August 2012, as per initial assessments of the General Practice NSW
Immunisation Program conducted by GPNSW. The Illawarra, however, ranked 15th with an
overall coverage figure of 90.9%. Figure 10 shows the trends in percentage of full-
immunisation coverage for the Illawarra and Shoalhaven compared to the NSW state and
Australian national averages.
Figure 10: Immunisation coverage* (%), ISML, latest financial quarters 2011-2012
*Initial Counts ONLY. Re-calculations are NOT included. Source: GPNSW, 2012
In addition to immunisation, empirical evidence also suggests that the early years of a child’s
life play a major role to play in their future health, development, learning and wellbeing 21.
Early childhood development outcomes are considered to be vital markers of the welfare of
children, and definite predictors of their future health and well-being. In 2012 the Australian
Early Development Index (AEDI) was completed across all regions in Australia for the
second time, providing an updated review of the picture of early childhood development
outcomes for Australian children. The AEDI measures five key domains of early childhood
development: physical health and wellbeing, social competence, emotional maturity,
language and cognitive skills (school-based), and communication skills and general
knowledge which are assessed through a teacher-completed checklist.
Table 25 shows the percentage of children found to be developmentally vulnerable and
Table 26 illustrates the proportions of developmental vulnerability on single and multiple
domains for school children in the ISML catchment areas compared to NSW state and
Australian national figures. While overall the ISML catchment average is lower than NSW
state and Australian national averages and, within the catchment the Shellharbour and
Shoalhaven community figures reveal the maximum proportions of developmental
Page | 29You can also read