Retail Parks in Belgium - Resilient value proposition Prepared for MITISKA REIM
←
→
Page content transcription
If your browser does not render page correctly, please read the page content below
Retail Parks in
Belgium

Resilient value proposition

Prepared for MITISKA REIM

                            October 2020 | Research report
M A R K E T ANALYSIS RETAIL PARKS IN BELGIUM                                   M A R K E T ANALYSIS MITISKA REIM

Market Report                                                                  Table of Contents
Retail Parks in                                                                EXECUTIVE SUMMARY                                                                                   8

Belgium                                                                        RETAIL SALES

                                                                               DEMAND14
                                                                                                                                                                                  12

                                                                               MOST ACTIVE RETAILERS                                                                             16

                                                                               SUPERMARKETS20

                                                                               STOCK & DEVELOPMENT                                                                               26
This report is an overview of the short- and long-term performance of
the out-of-town retail market in Belgium with a focus on retail parks.         RENTAL VALUES                                                                                     36

Market characteristics such as supply & demand, development, rents,            INVESTMENT50
and vacancy are analysed. Additionally, smartphone data are used to            OCCUPANCY58
assess the effects of the COVID-19 pandemic on footfall in different           RETAIL SURVEY                                                                                     68
retail formats.
                                                                               FOOTFALL74

                                                                               CONCLUSION80

                                                                                 DISCLAIMER & WORD OF CAUTION
                                                                                 This report was written in the summer             Information contained herein, including
                                                                                 of 2020, based on data available                  projections, has been obtained from sources
                                                                                 immediately after the first lockdown.             believed to be reliable. While we do not doubt
                                                                                                                                   its accuracy, we have not verified it and make
                                                                                 While our general views have not changed, our
                                                                                                                                   no guarantee, warranty or representation
                                                                                 data and conclusions did not anticipate a
                                                                                                                                   about it. It is the responsibility of the reader to
                                                                                 second lockdown. Please note that lockdowns
                                                                                                                                   confirm independently its accuracy and
                                                                                 are extremely difficult for all physical
                                                                                                                                   completeness.
                                                                                 retailers, regardless of type, location or
                                                                                 segment.

                                                                                 In this report, CBRE tries to describe and
                                                                                 analyse the retail market and retail park
                                                                                 segment as a whole. We do not make any
                                                                                 claims about individual retailers or landlords,
                                                                                 who could suffer from lockdowns, periods of
                                                                                 closure or limited consumption.

OCTOBER 2020                                              © CBRE Belgium | 2   3 | © CBRE Belgium         						                                                          OCTOBER 2020
M A R K E T ANALYSIS RETAIL PARKS IN BELGIUM                         M A R K E T ANALYSIS MITISKA REIM

                                                                              INTRODUCTION FOR CBRE REPORT

                                                                              Mitiska REIM is headquartered in Belgium and is Europe’s leading specialist investor in retail
                                                                              parks and convenience centres, offering convenient shopping, ample free parking and affordable
                                                                              infrastructure. Properties typically offer a mix of necessity-driven retail brands, anchored by a
                                                                              major food store which drives daily footfall.

                                                                              With over 40 years’ experience, Mitiska REIM are experts in both retail operations and convenience
                                                                              real estate, and have built strong relationships with leading national and international retail
                                                                              brands.

                                                                              Mitiska REIM’s investment model is partnership-driven, positioning itself as an active, value-
                                                                              adding investor, in collaboration with experienced local co-investment partners in respective
                                                                              geographies. Its approach is to unlock opportunities and drive superior value creation through the
                                                                              execution of development projects and value-add acquisitions with subsequent active asset
                                                                              management.

                                                                              In just 8 years, Mitiska REIM has raised 2 closed-ended funds (FRI and FRI 2) and built a portfolio
                                                                              of more than 70 properties representing over 700,000m² GLA across 11 countries (Belgium, The
                                                                              Netherlands, France, Germany, Spain, Portugal, Romania, Poland, Czech Republic, Slovakia and
                                                                              Serbia).

                                                                              www.mitiska-reim.com

                                                                              For further information, please contact:

                                                                              Axel Despriet                      Sylvie Geuten-Carpentier            Bart Rabaey
                                                                              Co-founding partner & Co-CEO       Co-CEO                              Head of Corporate Finance and
                                                                              ad@mitiska-reim.com                sg@mitiska-reim.com                 M&A
                                                                              +32 (0)475 33 00 63                +32 (0)495 50 22 68                 br@mitiska-reim.com
                                                                                                                                                     +32 (0)477 65 66 39

OCTOBER 2020                                    © CBRE Belgium | 4   5 | © CBRE Belgium       						                                                        OCTOBER 2020
M A R K E T ANALYSIS RETAIL PARKS IN BELGIUM                         M A R K E T ANALYSIS MITISKA REIM

                                                                            Executive
                                                                            Summary

OCTOBER 2020                                    © CBRE Belgium | 6   7 | © CBRE Belgium   						          OCTOBER 2020
M A R K E T ANALYSIS RETAIL PARKS IN BELGIUM                                                          M A R K E T ANALYSIS MITISKA REIM

Executive Summary
                                                                                                      footfall. Out-of-town retail locations have on   E-COMMERCE
                                                                                                      average been more resilient to the downturn
                                                                                                                                                       Out-of-town retail is nearby most Belgian

Retail parks in Belgium
                                                                                                      compared to high streets and shopping
                                                                                                                                                       consumers and easily reachable by car. As
                                                                                                      centres. They have since experienced a more
                                                                                                                                                       such, shopping here is quick and convenient.
                                                                                                      substantial recovery, even noting higher
                                                                                                                                                       Of all retail formats, out-of-town retail
                                                                                                      footfall figures at many locations post-
                                                                                                                                                       provides the best answer to e-commerce and is
                                                                                                      lockdown.
                                                                                                                                                       well-positioned for click and collect or returns,
Out-of-town retail is the largest and            VOIDS
                                                                                                                                                       both of which can be reinforced by cross-
fastest growing shopping format in
                                                 Vacancy rates in retail parks are low at 4.7%        RETAILER ATTRACTIVENESS                          selling.
Belgium. More than 8 million m2 of gross
                                                 for large-format developments. Those
leasable area (GLA) is dedicated to                                                                   Out-of-town retail offers the most attractive
                                                 portfolios that are under professional
convenience shopping in peripheral                                                                    value proposition for retailers, according to    CONCLUSION
                                                 management have reported availabilities as
locations, including a vast amount of                                                                 reported costs. Rental, fit-out and personnel
                                                 low as 2%. In general, voids in peripheral                                                            Retail parks have been consistent performers
supermarkets.                                                                                         costs are the most reasonable relative to
                                                 retail are short-lived. Only smaller standalone                                                       over the long-term both in terms of offering
                                                                                                      occupied space and sales versus shopping
                                                 warehouses on less desirable locations are                                                            value to retailers and great return potential to
                                                                                                      centres and high streets.
DEMAND                                           prone to structural voids. In comparison,                                                             investors. They have been resilient to market
                                                 vacancies are currently averaging 5.6% in                                                             changes from e-commerce and short-term
Retailer demand for out-of-town locations has
                                                 shopping centres and 16% in city centres.            CAPITAL VALUES                                   volatility from the COVID-19 pandemic,
been strong. Take-up in retail parks and
                                                                                                      Retail parks have proven to be a solid           illustrating a stability that is unique to retail
out-of-town clusters has been increasing and
                                                                                                      performer, offering the highest yields to        parks.
totaled more than 220,000 m2 in 2019 in what     RENTAL VALUES
was the most active year in recent memory.                                                            investors compared to other retail asset
                                                 Despite a general weakening of rents in the
Supermarkets, home & household and value-                                                             classes. Combined with lower rents, this
                                                 Belgian high streets and shopping centres,
oriented retailers in various segments are                                                            translates to more affordable capital values
                                                 out-of-town retail has been better able to
helping to drive demand as they look for                                                              with defensive land, often adjacent to urban
                                                 maintain rental levels. Prime rental levels are
further expansion.                                                                                    areas.
                                                 estimated at 175 €/m2/year in retail parks, with
                                                 typical developments achieving rental levels of
DEVELOPMENT                                      100 to 150 €/m2/year.

Given broadly supportive dynamics, retail park   In addition to greater stability, out-of-town is
development has been ongoing, averaging          considerably more affordable than shopping
80,000 m2 of new space annually. This new        centres (1,200 €/m2/year prime rent) and high
space has seen solid commercialisation of 60     streets (1,800 €/m2/year prime rent). This is
to 100% pre-leasing upon construction.           one of the most important elemetns that             Retail parks have the most affordable rents
                                                 makes out-of-town an attractive proposition
                                                                                                     while offering the highest yields
Increasing urban planning restrictions have
not notably diminished the pipeline in the       for retailers.

intermediate term. It has, though, halted
some projects and increased the cost of          FOOTFALL
compliance, ensuring the projects that are
                                                 The COVID-19 pandemic and subsequent
completed are of an overall higher quality and
                                                 lockdown has significantly decreased retail
entry barriers persist.

OCTOBER 2020                                                                    © CBRE Belgium | 8    9 | © CBRE Belgium          						                                                    OCTOBER 2020
M A R K E T ANALYSIS RETAIL PARKS IN BELGIUM                          M A R K E T ANALYSIS MITISKA REIM

                                                                             Market
                                                                             Statistics

OCTOBER 2020                                    © CBRE Belgium | 10   11 | © CBRE Belgium   						         OCTOBER 2020
M A R K E T ANALYSIS RETAIL PARKS IN BELGIUM M A R K E T ANALYSIS MITISKA REIM
Retail sales Retail trade turnover gross index (evolution compared to the same month last year)
Retail in Belgium 60%
60%40%
40%20%
The virulent spread of the COVID-19 virus, footwear” and “Retail sale of information and
forcing a nationwide shutdown of most communication equipment, other household 20%0%
economic activity from mid-March until equipment, cultural and recreation goods” 0%
-20%
the beginning of May has caused an reported the weakest performance, with sales
unprecedented disruption to the retail, declining respectively by 84% and 47% in -20%
-40%
hospitality and event sector. April. -40%
-60%
In contrast, demand for daily necessities and -60%
-80%
ECONOMY & CONSUMER CONFI- food items picked up as people spent more
DENCE
time at home. Retail sale of food, beverages
-80%
-100%
As a consequence of the COVID-19 pandemic and tobacco registered an increase of 13% in -100% 01/2020 02/2020 03/2020 04/2020 05/2020 06/2020 07/2020
and subsequent lockdown, the economic April compared to the same period in 2019. Retail sale in non-specialised
01/2020 02/2020 stores with food, beverages04/2020
03/2020 or tobacco predominating
05/2020 06/2020
Source: Statbel
fallout is severe, with GDP forecast to contract However, as of June 2020, most segments
Retail sale in non-specialised stores with food, beverages or tobacco predominating
by 7.8% in 2020 before rebounding by 5.6% in including in-store-based retail have shown a Retail sale of textiles, clothing, footwear and leather goods in specialised stores
2021, according to Oxford Economics. strong rebound.
Retail sale of textiles, clothing, footwear and leather goods in specialised stores
Retail sale of information and communication equipment, other household equipment (except textiles), cultural and
In addition, the rebound of consumer
SOCIAL DISTANCING BOOSTS recreation goods, etc. in specialised stores
confidence as non-essential retail reopened RetailRetail
sale ofsaleinformation andvideo
of audio and communication
equipment,equipment, other household
hardware, paints and glass, equipment (except textiles),
electrical household appliances, etc. in
THE DIGITAL ECONOMY
has been counterbalanced by concerns over cultural and recreation
specialised stores goods, etc. in specialised stores
the economy and job uncertainty, which are As the pandemic caused a shutdown of RetailRetail
sale ofsaleaudio and video
via mail equipment,
order houses or viahardware,
Internet paints and glass, electrical household appliances, etc.
likely to lead consumers to continue to spend non-essential businesses, retailers that in specialised stores
cautiously. invested in maintaining customer connection Retail sale via mail order houses or via Internet
through content engagement and sales
RETAIL SALES RECOVERING generation through e-commerce proved to be
the most resilient.
The COVID-19 lockdown has not affected all
retailers equally. Some retailers for non- This was also confirmed by the Statbel
essential goods have seen sales decline while statistics that showed an increase of almost
As of June 2020, most segements including
others have been boosted by the need for 50% for “retail sale via mail order houses or
homeworking equipment, entertainment and via Internet “compared to the same period last
in-store based retail have shown a strong
daily goods. year in the months of April, May and June.
Although the increase in online purchases
According to Statbel, overall retail sales in
stabilized after many shops reopened,
March and April combined fell by 11%
compared to the same period last year. Split up
consumer confidence is still lagging, rebound in sales
according to the consumer survey of the
by sector, “Retail sale of textiles, clothing and
National Bank of Belgium.
OCTOBER 2020 © CBRE Belgium | 12 13 | © CBRE Belgium OCTOBER 2020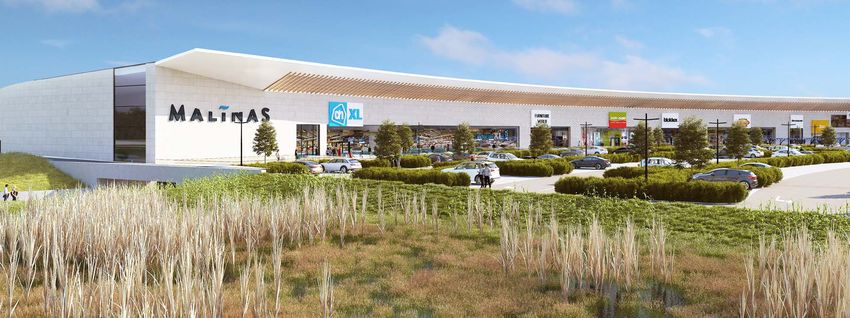
M A R K E T ANALYSIS RETAIL PARKS IN BELGIUM M A R K E T ANALYSIS MITISKA REIM
Demand INCREASING DEMAND FOR OUT- commercialisation. Secondly, supermarket
OF-TOWN RETAIL chains have continued to expand their retail
network in Belgium, with newcomers Jumbo
Retail in Belgium Retailer demand for out-of-town locations has
picked up in recent years, resulting in
and Albert Heijn especially making inroads.
Thirdly, home & household retailers, mostly
increased take-up to annual volumes of more
active in out-of-town locations, have
than 200,000 m2.
continued to expand.
Notwithstanding negative press and from mid-March, Q2 numbers were severely
Strong demand for out-of-town locations is
increasing e-commerce sales, retail downgraded. Overall, the out-of-town market presents a
noted for a number of reasons. First, a lot of
demand has been strong since 2016. 2019 strong value proposition for many retailers
An active market through such a turbulent new retail parks have been developed in recent
was even a record year for take-up. based on affordable rents, accessible locations
economic situation is remarkable. There are, years, and have experienced good
and convenience for consumers.
however, some good explanations for this.
LEASE TRANSACTIONS IN 2020
Overall, letting activity for supermarkets was
Retail take-up amounted to 177,800 m2
through the first half of 2020, representing
very high, with various food retailers having
occupied large surfaces all over Belgium.
Demand for out-of-town retail reached a
one of the highest numbers of the last decade.
The breakdown among the three main retail
Other sectors proving strong despite the
COVID-19 pandemic are various home &
record level in 2019, driven by discounters,
formats is consistent with activity in recent
years. High street accounted for 66,300 m2 of
household retailers.
supermarkets and home & household
take-up, shopping centres 25,600 m2 and On the other side, as a result of COVID-19,
out-of-town 85,900 m . 2 letting activity for fashion retailers decreased
significantly, especially in Q2, registering only
2020 got off to a great start with larger deals Out-of- town retail retail take-up per sector (2006-2020) Source: CBRE
half of the deals with a take-up of 4,000 m2, 250,000 m²
and a high take-up of almost 120,000 m2.
compared to 15,000 m² in the same period last
However, as a result of the lockdown starting 250,000 m²
year.
200,000 m²
200,000 m²
Retail take-up (2006 - H1 2020) Source: CBRE 150,000 m²
150,000 m²
450,000 m²
Out-of-town High street Shopping centre Other
400,000 m² 100,000 m²
100,000 m²
350,000 m²
300,000 m²
50,000
50,000m²
m²
250,000 m²
200,000 m²
m²
m²
150,000 m² 2006 2007
2006 2007 2008
2008 2009
20092010201020112011
20122012
2013 2013
2014 2014
2015 2016
2015 2017
2016 2018
20172019
201820202019 2020
100,000 m²
Supermarket Food & Beverages Fashion
Supermarket Food & Beverages Fashion
50,000 m² Shoes & Leather Health & Beauty Gifts & Accessories
Shoes& &Household
Home Leather Health & Beauty
Services Sports & Gifts
Leisure& Accessories
0 m² Home & Household
Specialised Services
Electronics Others Sports & Leisure
2006 2007 2008 2009 2010 2011 2012 2013 2014 2015 2016 2017 2018 2019 2020 Specialised Electronics Others
OCTOBER 2020 © CBRE Belgium | 14 15 | © CBRE Belgium OCTOBER 2020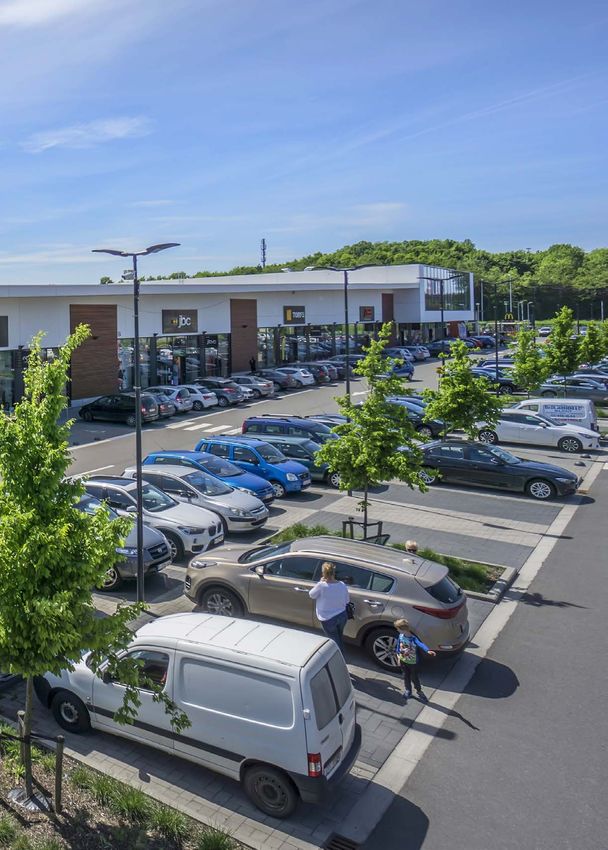
M A R K E T ANALYSIS RETAIL PARKS IN BELGIUM                                                            M A R K E T ANALYSIS MITISKA REIM

      Most active retailers                                                                                   Most active retailers in 2019 and 2020
                                                                                                              based on units
                                                                                                                                                                    Most active retailers in 2019 and 2020
                                                                                                                                                                    based on surface
                                                                                                                                                                                                              Source: CBRE
      Retail in Belgium                                                                                       Retailer         Units   Total Size    Average Size   Retailer        Units   Total Size   Average Size

                                                                                                              Kruidvat         15      6,724 m²          448 m²     Albert Heijn    12       21,678 m²    1,807 m²
      MOST ACTIVE RETAILERS IN                            OUT- OF-TOWN RETAILERS IN
      2019-2020                                           THE LAST YEARS                                      Action           15      17,238 m²         1,149 m²   Action          15       17,238 m²    1,149 m²

      Apart from supermarkets, looking at the             Analysing the out-of-town retailers over the        Medi-Market      12      5,312 m²          443 m²     Jumbo           7        16,005 m²    2,286 m²
      demand of the past years, home & household          past five years (excluding supermarkets) shows
                                                                                                              Albert Heijn     12      21,678 m²         1,807 m²   Brico Plan-It   1        15,905 m²    15,905 m²
      retailers have been doing great. Discount           once again the dominant position of the home
      retailer Action has been on a continuous            and household retailers (Action, Brico Plan-It,     Jysk             11      13,884 m²         1,262 m²   Jysk            11       13,884 m²    1,262 m²
      high-speed expansion, opening stores all over       Brico, Jysk, Maisons du Monde), who have
                                                                                                              Courir           11      3,011 m²          274 m²     Delhaize        9        12,714 m²    1,413 m²
      Belgium. DIY retailer Brico Plan-it has opened      been expanding their retail network.
      a megastore of 15,000 m2, and the Danish low                                                            Burger King      11      5,830 m²          530 m²     Lidl            5        10,736 m²    2,147 m²
                                                          Sports-centered retailers have also been active.
      budget furniture retailer Jysk has been very
                                                          Gym retailer Basic Fit has set up its health        Poké Bowl        10      1,439 m²          144 m²     Intersport      3        8,304 m²     2,768 m²
      active as well, opening 11 stores occupying a
                                                          centres widely all over the country, and retailer
      total surface of almost 14,000 m2.
                                                          Decathlon has opened stores in strategic            Chitir Chicken   10      1,375 m²          138 m²     Hubo            4        7,942 m²     1,986 m²
      Beauty and health retailer Kruidvat has             locations.
                                                                                                              Eyes & More      10      1,139 m²          114 m²     Mega Outlet     5        7,608 m²     1,522 m²
      opened 15 stores in 2019 and 2020, finding
                                                          The most expansive fashion retailer has been
      itself the frontrunner in the list of most active                                                       Rituals          9       2,113 m²          235 m²     Private         14       7,461 m²     533 m²
                                                          ZEB. This fashion retailer has focused on
      retailers (based on units).
                                                          opening large, multi-brand stores in out-of-        Snipes           9       2,606 m²          290 m²     Kruidvat        15       6,724 m²     448 m²
      Some fastfood chains, such as Burger King,          town locations, good for a total volume of
      Hawaiian Poké Bowl and Chitir Chicken have          almost 14,000 m2.                                   Holland & Barrett 9      1,632 m²          181 m²     Costes          4        6,353 m²     1,588 m²

      been expanding widely all over the country, all
                                                                                                              Delhaize         9       12,714 m²         1,413 m²   Decathlon       4        6,224 m²     1,556 m²
      having opened more than 10 units in the past
      two years.                                                                                              O'Tacos          8       1,122 m²          140 m²     Burger King     11       5,830 m²     530 m²

                                                                                                              Top 5 most active retailers in 2019 and 2020 and number of new locations secured

The majority of the most active retailers in                                                                                   15                                    15                                        12

 terms of expansion are focused on out-of-                                                                                                          12                                      11
                           town locations

      OCTOBER 2020                                                                     © CBRE Belgium | 16    17 | © CBRE Belgium        						                                                          OCTOBER 2020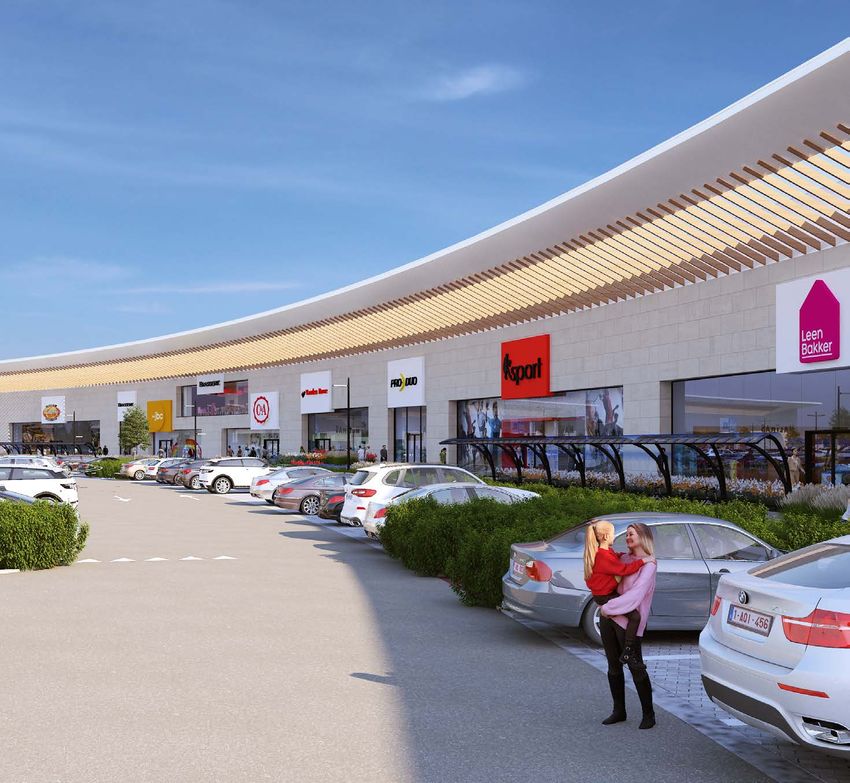
M A R K E T ANALYSIS RETAIL PARKS IN BELGIUM                          M A R K E T ANALYSIS MITISKA REIM

                                                                             Supermarkets

OCTOBER 2020                                    © CBRE Belgium | 18   19 | © CBRE Belgium   						         OCTOBER 2020
M A R K E T ANALYSIS RETAIL PARKS IN BELGIUM M A R K E T ANALYSIS MITISKA REIM
Supermarkets 2005 sales by grocery format Belgium
1%
2019 sales by grocery format Belgium
1%
Retail in Belgium 10% 10%
6%
1% 10%
Long-terms trends support supermarkets Discount retailers are the only other grocery 39%
44%
as a stable grocery format over 10% format to experience a growing proportion of
14%
traditional food retailers and
1 sales over the last 15 years, increasing from 12
12%
hypermarkets. 6% to 14% of the total. They achieve these sales
over a floor area of 615,000 m2 and counting.
OVERVIEW 44%supermarkets
As a result of these dynamics,
Total store-based grocery sales14%
in Belgium and discounters are the most productive 25%
28%
totalled €34.1 billion in 2019 over a sales floor grocery formats in terms of sales per square
area of 5.65 million m . 2 meter. They achieve sales of 7,950 and 7,630 €/
Supermarkets Traditional/independent grocers Discounters
m2, respectively, compared to an overall
The supermarket is by far the most popular Hypermarkets Convenience Stores Forecourt Retailers
average of approximately 6,000 €/m2.
grocery format, accounting for €14.89 billion
in sales in 2019, or 44% of the total.
CHANGING LANDSCAPE Source: Euromonitor / CBRE
Euromonitor distinguishes this format with 25%
hypermarkets, which only accounts for €2.02 Supermarket retailers are adapting to the
billion in sales. Supermarket sales have been changing landscape, increasingly focused on
claiming a greater portion of total store-based convenience. Omnichannel strategies are Evolution of supermarket stock and forecast in terms of sqm in Belgium
food sales in Belgium over time, claiming 39% gaining ground as supermarket retailers
of total food sales in 2005 and 44% in 2019. improve online presence and consumer 1.95 million m²
engagement. Pick-up points, mobile apps, and Supermarket stock Supermarket forecast
A growing proportion of sales has led to a
product and experience offer, and diverse store
growing stock of supermarkets. Euromonitor 1.90 million m²
formats are driving innovation.
has identified three consecutive years of sales
area growth to 1.872 million m2 in 2019. By Retailers focusing on niche markets such as
1.85 million m²
comparison, hypermarkets count 300,000 m2 bio-/sustainable/organic and coops are
and convenience stores 475,000 m2. Forecast achieving rapid growth in value. They
volume growth is moderate at 0.21% annually capitalise on expanding trend of local, healthy 1.80 million m²
through 2024. food, often with minimal waste.
1.75 million m²
Supermarkets and discounters continue to
1.70 million m²
perform well and gain market share, while
hypermarkets struggle 1.65 million m²
2007 2009 2011 2013 2015 2017 2019 2021 2023
Source: Euromonitor / CBRE
1
Traditional grocery retailers include typically non-chained/independent small grocers and food/drink/tobacco specialists
OCTOBER 2020 © CBRE Belgium | 20 21 | © CBRE Belgium OCTOBER 2020M A R K E T ANALYSIS RETAIL PARKS IN BELGIUM M A R K E T ANALYSIS MITISKA REIM
MOST ACTIVE SUPERMARKET SUPERMARKET RETAIL ON THE During the months of the lockdown (March,
RETAILERS Supermarket retailers with the largest RISE April and May), retail sales in supermarkets
expansion based on surface (2015-H1 2020)
increased comparable to sales during the
Overall, in 2019 and 2020, supermarkets In the last couple of years, the grocery sector
Christmas period. Greater demand for food
proved to be the most active of all retailers Retailer Total size Units Average Size has gone through some significant structural
and hygenic goods has driven operators to
in terms of surface. challenges as a response to the changes in
Albert Heijn 46,929 m² 26 1,805 m² consumer behaviour leading to more
carry out additional measures to ensure more
A very active market over the past two years efficient stock replenishment as well as
Lidl 35,185 m² 15 2,200 m² convenience. The sector has tried to keep up
can be explained firstly by the fact that recruiting thousands of temporary workers.
with the evolving market situation by
supermarkets occupy larger units and are Carrefour 27,139 m² 21 1,308 m² introducing click and collect, home deliveries Through this strong performance over the
therefore taking a large share of the total
and fast cashiers. short- and long-term, supermarkets remain an
take-up. Delhaize 21,762 m² 18 1,209 m²
attractive investment option for retail market
This has certainly helped supermarkets to
In addition, some foreign food retailers Jumbo 16,005 m² 7 2,286 m² exposure, especially for those looking for
remain relatively immune to volatility and
that have recently entered the Belgian long-term secure income.
Aldi 12,334 m² 8 1,708 m² experience robust growth, even in times of
market, such as Jumbo, want to expand
crisis. In addition, this resilience is also clearly
quickly. Lastly, other large foreign Colruyt 9,317 m² 6 1,553 m² perceptible in investor appetite, reflected in
supermarket chains such as Lidl and Albert
stable yields.
Heijn are trying to increase their Belgian Source: CBRE
market presence.
Supermarket retailers with the largest expansion based on surface (2015-H1 2020) Gross value of retail sale of food, beverages and tobacco in Belgium indexed to 2015
130
60,000 m²
2010 2015 2020
120
50,000 m²
40,000 m² 110
30,000 m² 100
20,000 m² 90
10,000 m² 80
0 m² 70
2015 2016 2017 2018 2019 2020 J F M A M J J A S O N D
Source: CBRE Source: Statbel
Albert Heijn Lidl Carrefour Market Delhaize Jumbo Aldi Colruyt
OCTOBER 2020 © CBRE Belgium | 22 23 | © CBRE Belgium OCTOBER 2020M A R K E T ANALYSIS RETAIL PARKS IN BELGIUM M A R K E T ANALYSIS MITISKA REIM
Stock &
Development
Malinas Retail Park Project - Mechelen
OCTOBER 2020 © CBRE Belgium | 24 25 | © CBRE Belgium OCTOBER 2020M A R K E T ANALYSIS RETAIL PARKS IN BELGIUM M A R K E T ANALYSIS MITISKA REIM
Stock & development
The pipeline includes a diverse range of completed in Bertix and Wavre, respectively.
projects. Some of the largest are Typerpark in
Most new projects commercialise very well,
Menen (37,800 m2), Place Richelle in Waterloo
Retail parks (28,000 m2) and Malinas Retail Park in
with 60 to 100% of space pre-let by
construction. Since 2018, roughly 100,000 m2
Mechelen (27,000 m2).
of take-up is attributed to pre-lets, which is
Most new projects are planned for Walloon 20% of total out-of-town take-up over this
STOCK including T-Forum in Tongeren (2012) and markets, though several are found in Flanders. period.
Be-Mine in Beringen (2015). After 2015, new These include Ninouter in Ninove (10,000 m ) 2
Out-of-town retail stock counts some 8 million Large, international developers are active in
development has decelerated somewhat to and Dijkstraat 7 in Lokeren (7,800 m2).
m2 in Belgium and is constantly evolving, with Belgium. Leading developers with recent or
about 60,000 m2 worth of annual completions. Elsewhere, La Couvinoise (13,500 m2) will be
the newest retail parks featuring impressive ongoing ambitious projects include Mitiska
built in Couvin, and Frunshopping (13,500 m2)
features and designs well beyond that of DEVELOPMENT REIM, Redevco, De Vlier, Equilis and
and Parc de l’Europe (9,000 m2) are newly
earlier warehouse-style development. DataBuild.
The success of the out-of town-format is
Over the past years, out-of-town development reflected in the development pipeline, with
has been remarkably stable at around 80,000
m2 of new projects completed annually. 2012
currently over 315,000 m2 of new retail park
space expected to open through 2022 (2020-
Most new projects commercialise very
and 2015 were standout years where
substantial new supply came to the market,
2022). In annual terms, this is above the
long-term average. well, with 60 to 100% of space pre-let by
construction
Out-of-town retail development pipeline (left axis) and project count (right axis) Source: CBRE / Expertise
200,000 m² 14
180,000 m²
Built Planned (not all permitted) Project count 12
160,000 m²
140,000 m² 10
120,000 m²
8
100,000 m²
6
80,000 m²
60,000 m² 4
40,000 m²
2
20,000 m²
0 m² 0
2005 2006 2007 2008 2009 2010 2011 2012 2013 2014 2015 2016 2017 2018 2019 2020 2021 2022
OCTOBER 2020 © CBRE Belgium | 26 27 | © CBRE Belgium OCTOBER 2020M A R K E T ANALYSIS RETAIL PARKS IN BELGIUM M A R K E T ANALYSIS MITISKA REIM
Map of population density and retail parks (>7,000 m2) Source: Statbel / CBRE / Expertise
Population Density
people / HM2
5 30 130 465
Retail Park
Current stock or known
project by 2022
OCTOBER 2020 © CBRE Belgium | 28 29 | © CBRE Belgium OCTOBER 2020M A R K E T ANALYSIS RETAIL PARKS IN BELGIUM M A R K E T ANALYSIS MITISKA REIM
PLANNING
Malinas Retail Park Project - Mechelen
There is almost perpetual talk of more
prohibitive urban planning in terms of
out-of-town development, though the overall
pipeline of projects has not notably
diminished.
Greater restrictions have impacted the out-of-
town market, though, and will continue to do
so. This has ensured that only the best-
capitalized players can afford to proceed with
time-consuming processes, plan
amendments, traffic studies, and
environmental impact assessments.
The projects that do end up breaking ground
have gone through greater scrutiny and a more
refined process. This translates to an overall
better and more effective product which more
closely aligns with cities’ urban plans.
Administrative efforts have already halted
proposed projects and will limit new supply in
the future. In the meantime, the tougher
stance has helped to professionalise the
market and support values.
OCTOBER 2020 © CBRE Belgium | 30 31 | © CBRE Belgium OCTOBER 2020M A R K E T ANALYSIS RETAIL PARKS IN BELGIUM M A R K E T ANALYSIS MITISKA REIM
Map of out-of-town retail stock and projects (2020 - 2022) in Belgium (>7,000 m2) Source: Expertise News / CBRE
50,000 m2
7,000 m2
Stock Project
OCTOBER 2020 © CBRE Belgium | 32 33 | © CBRE Belgium OCTOBER 2020M A R K E T ANALYSIS RETAIL PARKS IN BELGIUM M A R K E T ANALYSIS MITISKA REIM
Rental Values
OCTOBER 2020 © CBRE Belgium | 34 35 | © CBRE Belgium OCTOBER 2020M A R K E T ANALYSIS RETAIL PARKS IN BELGIUM M A R K E T ANALYSIS MITISKA REIM
Rental values Belgium prime out-of-town retail rent evolution
250 €/m²/yr
Source: CBRE
Retail parks
200 €/m²/yr
Out-of-town retail rents have been the AFFORDABLE RENTS
most affordable, best-supported and least 150 €/m²/yr
Prime out-of-town rent is estimated at 175 €/
volatile rents of any retail format in
m /yr in Belgium as of H1 2020. This is based
2
Belgium.
on a typical unit of 1,000 m2. Prime rent is
believed to be achievable for new properties in 100 €/m²/yr
STABILITY the best locations in and around Brussels.
Out-of-town retail rents have shown Out-of-town retail remains very affordable 50 €/m²/yr
remarkable stability when compared to compared to high streets (1,800 €/m2/yr prime
shopping centre and high street dynamics. rent) and shopping centres (1,200 €/m2/yr).
There are numerous dynamics supporting this
0 €/m²/yr
evolution including: Since 2005, prime rent steadily increased from
Q2 Q2 Q2 Q2 Q2 Q2 Q2 Q2 Q2 Q2 Q2 Q2 Q2 Q2 Q2 Q2
150 €/m2/yr to a high of 200 €/m2/yr in 2018.
• convenience and easy accessibility of 2005 2006 2007 2008 2009 2010 2011 2012 2013 2014 2015 2016 2017 2018 2019 2020
Structural changes in the retail market and
retail parks by various mobility options, overextension in the real estate market have
• increasingly restrictive planning and seen rents pull back somewhat over the last 24
permit requirements limiting stock and to 36 months.
Belgium prime retail rent by format indexed to 2006 (2006 = 100) Source: CBRE
new development, Moving forward, there is much less downside
risk for established retail parks compared with 150
• retailer rent affordability,
high streets and shopping centres. Vacancy is Shopping centre High street Out-of-town
• higher vacancies in other formats - low and demand has been strong. If, for 140
particularly high streets, example, more restrictive shopping and social
distancing measures are required as a result of
• modernisation of retail parks themselves 130
the pandemic, the experience during the first
over time,
half of the year means it is likely landlords,
• ability to attract quality occupiers with retailers and consumers will be better 120
expansion plans. prepared than before.
110
Out-of-town rents have proven the most 100
stable and affordable over the long-term 90
compared with all other retail formats 2006 2007 2008 2009 2010 2011 2012 2013 2014 2015 2016 2017 2018 2019 H1
2020
OCTOBER 2020 © CBRE Belgium | 36 37 | © CBRE Belgium OCTOBER 2020M A R K E T ANALYSIS RETAIL PARKS IN BELGIUM M A R K E T ANALYSIS MITISKA REIM
Recent out-of-town letting deals and rents Source: CBRE
YEAR QUARTER NAME ADDRESS SURFACE ERV (EUR/M2/YR) DEAL OCCUPANT SECTOR
2020 2 Koningin Astridlaan 118 2550 Kontich, Koningin Astridlaan 118 750 m2 110 eur/m2/yr Letting Tom & Co Specialised
2020 2 Koningin Astridlaan 118 2550 Kontich, Koningin Astridlaan 118 1,200 m2 120 eur/m2/yr Letting Giks Mode Fashion
2020 2 Genkersteenweg 215 3500 Hasselt, Genkersteenweg 215 1,700 m2 100 eur/m2/yr Letting Impermo Home & Household
2020 2 Esenweg 8600 Diksmuide, Esenweg 1,049 m2 90 eur/m2/yr Letting Action Home & Household
2020 2 Esenweg 8600 Diksmuide, Esenweg 702 m2 105 eur/m2/yr Letting Bel&Bo Fashion
2020 2 Esenweg 8600 Diksmuide, Esenweg 2,216 m2 110 eur/m2/yr Letting Lidl Supermarket
2020 2 Dijkstraat 7 9160 Lokeren, Dijkstraat 7 1,027 m2 95 eur/m2/yr Letting Action Home & Household
2020 2 Dijkstraat 7 9160 Lokeren, Dijkstraat 7 1,992 m2 85 eur/m2/yr Letting Hubo Home & Household
2020 2 Dijkstraat 7 9160 Lokeren, Dijkstraat 7 1,254 m2 95 eur/m2/yr Letting Jysk Home & Household
2020 2 Oude Vest 180 9200 Dendermonde, Oude Vest 180 1,900 m 2
120 eur/m /yr
2
Letting Albert Heijn Supermarket
2020 2 Genkersteenweg 301 - 303 3500 Hasselt, Genkersteenweg 301-303 530 m2 110 eur/m2/yr Letting Stella Bikes Specialised
2020 1 Bredabaan 891-893 2170 Merksem, Bredabaan 891-893 636 m2 160 eur/m2/yr Letting Kruidvat Health & Beauty
2020 1 Shopping Park Olen 2250 Olen, Lammerdries 4 479 m2 90 eur/m2/yr Letting Stella Bikes Specialised
2020 1 Staatsbaan 69 9990 Maldegem, Staatsbaan 69 2,000 m 2
105 eur/m /yr
2
Letting Albert Heijn Supermarket
2020 1 R.Plaza roeselare 8800 Roeselare, Rijksweg (R.Plaza) 2,000 m2 115 eur/m2/yr Letting Albert Heijn Supermarket
2020 1 Shopping Pajot 1600 St-Pieters-Leeuw, Bergensesteenweg 65-67 387 m2 135 eur/m2/yr Letting Kruidvat Health & Beauty
2020 1 Shopping Pajot 1600 St-Pieters-Leeuw, Bergensesteenweg 65-67 387 m2 135 eur/m2/yr Letting Ici Paris XL Health & Beauty
2020 1 Shopping Pajot 1600 St-Pieters-Leeuw, Bergensesteenweg 65-67 2,350 m2 120 eur/m2/yr Letting Albert Heijn Supermarket
2020 1 Diksmuidsesteenweg 388 8800 Roeselare, Diksmuidsesteenweg 388 1,986 m2 115 eur/m2/yr Letting Jumbo Supermarket
2020 1 Merksplassesteenweg 106 2310 Rijkevorsel, Merksplassesteenweg 106 588 m2 110 eur/m2/yr Letting Takko Fashion Fashion
2020 1 Merksplassesteenweg 106 2310 Rijkevorsel, Merksplassesteenweg 106 322 m2 110 eur/m2/yr Letting Cats & Dogs Specialised
2019 4 Avenue des Communautés 5 1140 Evere, Avenue des Communautés 5 1,296 m2 125 eur/m2/yr Letting Extra Home & Household
2019 4 Avenue des Communautés 5 1140 Evere, Avenue des Communautés 5 596 m2 130 eur/m2/yr Letting Kamera Express Specialised
2019 4 Avenue des Communautés 5 1140 Evere, Avenue des Communautés 5 1,552 m2 130 eur/m2/yr Letting Brantano Shoes & Leather
2019 4 Avenue des Communautés 5 1140 Evere, Avenue des Communautés 5 1,830 m2 125 eur/m2/yr Letting Electro Depot Home & Household
2019 4 Veurnestraat 215 8660 De Panne, Veurnestraat 215 700 m2 68 eur/m2/yr Letting Private Others
2019 3 Rue Chaussée 17 4342 Hognoul, Rue Chaussée 17 1,048 m2 98 eur/m2/yr Letting Jour de Fête Specialised
2019 3 Ikea Retailpark Arlon 6700 Arlon, Rue de Grass 100 1,812 m2 125 eur/m2/yr Letting X2O Sanitair Home & Household
2019 3 Rue Chaussée 17 4342 Hognoul, Rue Chaussée 17 927 m 2
102 eur/m /yr
2
Letting JYSK Home & Household
2019 3 Rolarius 8800 Roeselare, Brugsesteenweg 387 1,900 m2 100 eur/m2/yr Letting X2O Sanitair Home & Household
2019 2 Turnhoutsebaan 362 2970 Schilde, Turnhoutsebaan 362 220 m2 150 eur/m2/yr Letting Holland & Barrett Health & Beauty
2019 1 Shopping Pajot 1600 Sint-Pieters-Leeuw, Bergensesteenweg 65-67 755 m2 130 eur/m2/yr Letting Brantano Shoes & Leather
2019 1 Shopping Park Olen 2250 Olen, Lammerdries 4 312 m2 135 eur/m2/yr Letting Snoeys Shoes & Leather
OCTOBER 2020 © CBRE Belgium | 38 39 | © CBRE Belgium OCTOBER 2020M A R K E T ANALYSIS RETAIL PARKS IN BELGIUM M A R K E T ANALYSIS MITISKA REIM
Still, examining rental changes since 2006, the
out-of-town format has performed more
consistently than either high street or
shopping centres. Prices did not increase as
quickly as the other formats in the post-
financial crisis growth years, but they have not
corrected nearly as sharply, either. They still
remain some 18% higher than 2006 compared
to 17% for high streets and 4% for shopping
centres.
Belgium prime rent by retail format Source: CBRE
2,500 €/m²/yr
Shopping centre High street Out-of-town
2,000 €/m²/yr
1,800 €/m2/yr
1,500 €/m²/yr
1,200 €/m2/yr
1,000 €/m²/yr
500 €/m²/yr
175 €/m2/yr
0 €/m²/yr
2006 2007 2008 2009 2010 2011 2012 2013 2014 2015 2016 2017 2018 2019 H1
2020
OCTOBER 2020 © CBRE Belgium | 40 41 | © CBRE Belgium OCTOBER 2020M A R K E T ANALYSIS RETAIL PARKS IN BELGIUM M A R K E T ANALYSIS MITISKA REIM
RENT DYNAMICS trend in terms of rent and age, size, or supermarkets and 15 did not. Another two CONCLUSION
presence of a supermarket. locations noted no supermarket in 2014 but
We have also surveyed 40 locations of the Out-of-town retail prime rents are estimated at
added a supermarket to the portfolio for 2019.
Retail Estates portfolio to analyse achieved The change in rents since 2014 was also noted. 175 €/m2/yr for 2020. Growth over the last 15
rents. These properties cover 10 of the 11 The average achieved rental price at this time The average rental change for the 30 years has been much less volatile and remain
provinces, with Brussels Province the was 97 €/m2/yr, indicating a growth of 8 €/m2/ properties was 6.6% from 2014 through 2019. much more affordable compared with high
exception. yr (8.2%) through 2019. The portfolio make-up For those without a supermarket, the change streets or shopping centres.
did change over that time, though. was just 2.9%. For those properties with a
The average achieved rental price is 105 €/m2/ Achieved rental rates are closer to 100 to 150 €/
supermarket, rental growth was 5.9%. And
yr as of year end 2019. Vlaams Brabant claims m2/yr. Examining a professionally managed
SUPERMARKETS finally, for those that added a supermarket
the highest rents at 130 €/m2/yr, followed by out-of-town portfolio, rental growth has been
over the 2014 to 2019 period, rental growth
Antwerp at 116 €/m2/yr. The properties in East As noted, the presence of a supermarket does 8.2% over the last five years.
was 5.1%.
and West Flanders earn the least at 94 €/m2/yr not explain the difference in rents as of today
We see some evidence that the presence of
and 92 €/m2/yr, respectively. in the sample. However, a trend emerges when Given the sample, the presence of
supermarkets within retail parks/clusters
observing the change in rents over the last five supermarkets could support stronger rental
In terms of Walloon Provinces, Liège and supports higher rental growth. Properties with
years. growth for retail parks. Though, it is noted
Luxembourg record the highest achieved supermarkets experienced five-year rental
that while the locations were similar for the
prices of 114 €/m /yr and 108 €/m /yr,
2 2
We analysed rental changes from 2014 to 2019 growth 75% higher than those without one.
2014 to 2019 comparison, the portfolios did
respectively. for retail parks/clusters that did and did not And those that added a supermarket over that
change over that time.
have supermarkets. 13 locations had time also noted superior growth.
From this sample, there is no discernible
Weighted average rents by province of surveyed retail parks/clusters Rent growth from 2014 to 2019 from a sample of 30 retail parks/clusters across Belgium
140 €/m²/yr 7.0%
120 €/m²/yr 6.0%
100 €/m²/yr
5.0%
80 €/m²/yr
4.0%
60 €/m²/yr
3.0%
40 €/m²/yr
2.0%
20 €/m²/yr
1.0%
0 €/m²/yr
0%
Total No supermarket With supermarket New supermarket for 2019
Source: Retail Estates / CBRE Source: Retail Estates / CBRE
OCTOBER 2020 © CBRE Belgium | 42 43 | © CBRE Belgium OCTOBER 2020M A R K E T ANALYSIS RETAIL PARKS IN BELGIUM M A R K E T ANALYSIS MITISKA REIM
Rents for out-of-town retail parks / clusters from the sample (sqm represented by circle size; rents represented by the color) Source: Retail Estates / CBRE
36,000 m2
4,000 m2
68 eur/m2 168 eur/m2
OCTOBER 2020 © CBRE Belgium | 44 45 | © CBRE Belgium OCTOBER 2020M A R K E T ANALYSIS RETAIL PARKS IN BELGIUM M A R K E T ANALYSIS MITISKA REIM
5-yr change in rents for out-of-town retail parks / clusters from a professional portfolio (sqm represented by circle size; rental change represented by the color) Source: Retail Estates / CBRE
36,000 m2
4,000 m2
-13% +30%
OCTOBER 2020 © CBRE Belgium | 46 47 | © CBRE Belgium OCTOBER 2020M A R K E T ANALYSIS RETAIL PARKS IN BELGIUM M A R K E T ANALYSIS MITISKA REIM
Investment
OCTOBER 2020 © CBRE Belgium | 48 49 | © CBRE Belgium OCTOBER 2020M A R K E T ANALYSIS RETAIL PARKS IN BELGIUM M A R K E T ANALYSIS MITISKA REIM
Investment
Over this period, out-of-town has been the institutional investors opt for a wait-and-see
most stable segment. Average annual approach. Interest, though, is still noted for
investment volume over the last five years is quality out-of-town assets, and more deals are
Retail parks more than €310 million. 2019 was a stand-out expected once the dust begins to settle.
year with more than €430 million worth of
Nevertheless, some sectors have proven to be
deals recorded.
more resilient to the COVID-19 situation, with
Retail investment has been strong since INVESTMENT The COVID-19 pandemic has offered a new an increasing number of investors looking to
2015, though lower volume is expected challenge. The lockdown has weighed on acquire food-related units. Aggressive bids
The retail investment market has been
this year as a result of the fallout from retailers, introducing new uncertainty to the have pushed yields for supermarkets lower,
particularly active since 2015. Large shopping
COVID-19. Nevertheless, prime yields for market. Deals have often been delayed as such as a private investor acquiring an Albert
centre deals drove volumes around the €2
out-of-town have been minimally affected
billion mark in 2015 and 2018. By the end of
through the first half of the year, and
2019, complicated occupier dynamics driven
investor interest only temporarily
by the disruption from e-commerce began to
disrupted. Longer term, yields are stable
and the highest of the retail formats,
lead to generally lower appetite for retail Retail investment has been stable and
investment, particularly high street and
contributing to low capital values.
shopping centres. Through H1 2020, retail strong since 2015, with 2019 a record year
investment totalled €251 million.
for out-of-town volumes
Retail investment in Belgium through July 2020 Source: CBRE Retail investment yields and 10-yr bond rates in Belgium Source: CBRE
2,500 million € 9.0%
Out-of-town High street Shopping centre High street Shopping centre Out-of-town BE 10-yr bonds
8.0%
2,000 million € 7.0%
6.0% 5.50%
1,500 million € 5.0%
5.00%
4.0% 4.25%
3.0%
1,000 million €
2.0%
1.0%
500 million € -0.16%
0.0%
-1.0%
0 million € 2005 2006 2007 2008 2009 2010 2011 2012 2013 2014 2015 2016 2017 2018 2019 H1
2010 2011 2012 2013 2014 2015 2016 2017 2018 2019 2020 2020
OCTOBER 2020 © CBRE Belgium | 50 51 | © CBRE Belgium OCTOBER 2020M A R K E T ANALYSIS RETAIL PARKS IN BELGIUM M A R K E T ANALYSIS MITISKA REIM
Heijn and Leen Bakker in Zottegem for 5.1%. This dynamic has been most dramatic for high CAPITAL VALUES Moreover, these capital values are
streets and shopping centres, with yields comparatively stable and contain a defensive
A push for real estate diversification and safer Given the low rents and high yields (relative to
increasing some 125bps and 100bps off of land value near urban areas.
retail opportunities has led to a hybrid market other retail formats), capital values are low.
their lows. That brings high street prime yields
situation that favors out-of-town assets. In The best retail parks in Belgium may achieve
to an estimated 4.25% and shopping centres
2020, Forum Estates acquired five Carrefour values of 3,200 €/m2 based on current prime
to 5.00%, based on the current environment
stores from Equilis for €15 million (6.5%), estimates.
and investor sentiment.
Imroder acquired Natiënlaan 77 for €14
million, and a private buyer acquired a 5-unit Prime yields for the best located out-of-town
Oostende park for €10.5 million (5.5%). retail parks offer a sharp contrast. They
YIELDS
remain the most stable asset class with the
highest return potential for those seeking
Prime out-of-town investment yields have
For years investors found solid returns and
rental growth via retail investment. However,
retail exposure, particularly during COVID-19.
As a result, prime yields have compressed to
been more stable and higher than other
the current climate has led to greater
uncertainty for physical retail that has seen
5.50%. Cash-rich private buyers can bid
standalone or grocery units lower. Typical
retail formats, offering investors great
upward pressure on investment yields. observed yields for retail parks range from
5.50% to 6.50%.
return potential
Malinas Retail Park Project - Mechelen
OCTOBER 2020 © CBRE Belgium | 52 53 | © CBRE Belgium OCTOBER 2020M A R K E T ANALYSIS RETAIL PARKS IN BELGIUM M A R K E T ANALYSIS MITISKA REIM Major recent out-of-town investment deals in Belgium Natiënlaan 77, Knokke Torhoutsesteenweg 666, Oostende Oudenaardsesteenweg 76-78, Zwijnaarde 3 Ikea retail parks (Arlon, Hasselt, Mons) Date 07/2020 Date 05/2020 Date 02/2019 Date 12/2018 Price 14 million eur N/A yield Price 10.5 million eur 5.5% yield Price 17 million eur 5.6% yield Price 63.1 million eur 5.75%-6.25% yield Size 6,000 m2 Yield 6,000 m2 Size 7,400 m2 Size 11,100 m2 Buyer Imroder Buyer Private Buyer Imroder Buyer Retail Estates Seller Redevco Seller Bermaso Seller Redevco Seller Ikea Les Dauphins, Mouscron Retail Park Mains & Sabots, Estaimpuis Parklaan 80-89, Turnhout Maalse Steenweg 356, Brugge Date 05/2019 Date 04/2019 Date 10/2018 Date 10/2018 Price 39 million eur 6.15% yield Price 27.9 million eur 6.25% yield Price 33.1 million eur 6.4% yield Price 40 million eur 5.95% yield Size 23,000 m2 Size 19,600 m2 Size 20,500 m2 Size 21,700 m2 Buyer Deka Immobilien Buyer Forum Estates Buyer Wereldhave Buyer Wereldhave Seller Fidelity Investment Seller ABLI + Willy Naessens Seller Redevco Seller Redevco OCTOBER 2020 © CBRE Belgium | 54 55 | © CBRE Belgium OCTOBER 2020
M A R K E T ANALYSIS RETAIL PARKS IN BELGIUM                          M A R K E T ANALYSIS MITISKA REIM

                                                                             Occupancy

OCTOBER 2020                                    © CBRE Belgium | 56   57 | © CBRE Belgium   						         OCTOBER 2020
M A R K E T ANALYSIS RETAIL PARKS IN BELGIUM M A R K E T ANALYSIS MITISKA REIM
Occupancy
secondary and especially tertiary locations will m2 (16%), and leisure with 66,500 m2 (9%).
continue to face challenges.
Half of retail parks greater than 10,000 m2 are
Retail parks The primary retail formats can differ
markedly, too. At the beginning of 2020,
fully occupied in 2020. Fewer still count
substantial vacancy of greater than 2,000 m2.
vacancy in retail parks was 4.7% (for retail Several of these retail parks that count
parks >10,000 m ) while shopping centres
2
vacancies were completed within the last three
Vacancy in the wider retail market has Rising competition from e-commerce and experienced vacancies of 5.6% and high years and may not have had sufficient
been on the rise for the last 12 years, mobility issues continue to cause frictions in streets more than 16% (based on square commercialisation time to reach stabilised
driven largely by high streets. Out-of- the market. Inconsistencies in urban planning meters). occupancy. Given the high take-up activity
town, on the other hand, has proven policies around new/re- development further experienced in recent years, it is expected that
When examining a benchmark of listed REITs
largely resilient. complicate the matter. Financial pressures these vacancies will be short-lived.
active in out-of-town retail, reported vacancies
from the COVID-19 pandemic will also take
are 2.1% at Retail Estates and 2.7% at Otherwise, there are several significantly
OVERVIEW their toll, making it very likely the upward
Ascencio - well below market. This illustrates underperforming properties that are
trend in vacancy will continue for 2020 and
that active and professional managers are able disproportionately influencing the overall
At the beginning of 2020, retail vacancy in
2021.
to achieve superior occupancy rates compared vacancy rate.
Belgium was 11% (Locatus). This is up 2.0
That said, the pressures are not evenly felt to the general market.
percentage points from 2015 and 3.4
percentage points since 2010. both in terms of geography and retail format. RETAIL PARK VACANCY EVOLU-
AAA locations are still the most resilient, while RETAIL PARK VACANCY TODAY TION
To more closely examine occupancy dynamics The vacancy evolution since 2010 presents a
today and over time, we work with Locatus and mixed though overall positive picture. In total,
a sample of 46 retail park locations of greater retail park vacancy declined from 7.7% in 2010
Occupied space by store type in retail parks of >10,000 m2 Source: Locatus / CBRE than 10,000 m2 across Belgium totalling more to 1.8% in 2015 before increasing to 4.7% in
than 700,000 m2. In 2020, these retail parks 2020 (based on retail parks of >10,000 m2).
300,000 m²
reported vacant space of 33,600 m2, or a
This follows a different dynamic compared to
vacancy rate of 4.7%.
other retail formats that have experienced
250,000 m² consistent vacancy increases since 2010. The
These retail parks have occupiers that are
weighted to home goods retailers at 275,000 result is lower vacancy in retail parks today
m2 (39%). After that comes fashion with compared to 2010, while both high streets and
200,000 m²
203,000 m2 (29%), supermarkets with 112,000 shopping centres count higher vacancy.
150,000 m²
100,000 m²
Retail parks have maintained remarkably
50,000 m² low vacancy in the context of a consistently
0 m² expanding stock
Home goods Fashion Supermarkets Leisure Vacancy Daily Other
OCTOBER 2020 © CBRE Belgium | 58 59 | © CBRE Belgium OCTOBER 2020M A R K E T ANALYSIS RETAIL PARKS IN BELGIUM M A R K E T ANALYSIS MITISKA REIM
The vacancy evolution of retail parks moves A large portion of the vacancy can be explained
Retail park (>10,000 m2) vacancy by province in 2020 Source: Locatus / CBRE
more in line with professionally managed by the development dynamics of this format.
portfolios when controlling for retail park size. Shopping centres are notorioulsy difficult to 12%
That is, vacancy decreases when considering develop in Belgium, keeping their supply in
larger retail parks. For example, vacancy rates check. High streets are suffering, and reactive
10%
in 2020 for different size of developments are: landlords are converting vacant shops to other
uses, limiting that supply as well. Retail parks,
• 7.3% vacancy for those of >3,000 m2 8%
on the other hand, have seen sustained
• 5.7% vacancy for those of >7,000 m2 development leading to an expanding stock.
6%
• 4.7% vacancy for those of >10,000 m2 That means this additional space needs to be
absorbed just to maintain current vacancy
All three categories did note a large dip in 4%
levels. In this context, vacancy of some 4.7% is
availabilites in 2015 before increasing
very positive.
somewhat by 2020. 2%
CONCLUSION
LOCATION 0%
Retail parks count the lowest vacancy rate of
From a geographical perspective, vacancies
all retail formats at just 4.7% in 2020 (retail
can vary by province. Brussels, Flemish
parks >10,000 m2). Vacancy in professionally
Brabant, Antwerp and Liège count very limited
managed retail park portfolios can be as low
vacancies in retail parks, all under 2%. On the
as 2%.
flip side, East and West Flanders and Namur
count disproportionately higher vacancies, The vacancy evolution is also more favorable
with each province reporting availabilities of compared to high streets and shopping Vacancy rates by retail format Source: Locatus / CBRE
7% or more. centres, with retail parks counting relatively
fewer available square meters today than ten 18%
years earlier. Retail park (>10,000 sqm) High street Shopping center 16%
RETAIL PARK VACANCY VS 16%
STOCK
The occupancy performance is all the more
Calculating vacancy includes consideration of impressive when considering the larger retail 14%
vacant square meters and retail stock. Up to park pipeline requires greater absorption of
12%
this point we have focused on the vacant part space just to maintain current levels. Given the
of the equation and ignored the stock portion. high take-up activity in recent years, the 10%
Thus, understanding Belgium’s current available space in new developments that
out-of-town vacancy requires a look at the contributes to vacancy is expected to be 8%
stock evolution. short-lived. 5.6%
6%
4%
Vacancy in professionally managed retail 2%
4.7%
park portfolios can be as low as 2% 0%
2010 2015 2020
OCTOBER 2020 © CBRE Belgium | 60 61 | © CBRE Belgium OCTOBER 2020M A R K E T ANALYSIS RETAIL PARKS IN BELGIUM M A R K E T ANALYSIS MITISKA REIM
Retail park vacancy rate in 2020 (>10,000 m2) where retail park size is indicated by circle size and vacancy rate is indicated by color Source: Locatus / CBRE
28,000 m2
10,000 m2
0% 10% 30% 58%
OCTOBER 2020 © CBRE Belgium | 62 63 | © CBRE Belgium OCTOBER 2020M A R K E T ANALYSIS RETAIL PARKS IN BELGIUM M A R K E T ANALYSIS MITISKA REIM
Retail park change in occupancy from 2010 to 2020 (>10,000 m2) where retail park size is indicated by circle size and occupancy rate change is indicated by color Source: Locatus / CBRE
28,000 m2
10,000 m2
-36% 0% +53%
Lower Higher
occupancy occupancy
OCTOBER 2020 © CBRE Belgium | 64 65 | © CBRE Belgium OCTOBER 2020M A R K E T ANALYSIS RETAIL PARKS IN BELGIUM M A R K E T ANALYSIS MITISKA REIM
Retailer Survey
OCTOBER 2020 © CBRE Belgium | 66 67 | © CBRE Belgium OCTOBER 2020M A R K E T ANALYSIS RETAIL PARKS IN BELGIUM M A R K E T ANALYSIS MITISKA REIM
Retail Survey
OUT- OF-TOWN RETAILERS ARE In the survey, none of the out-of-town retailers
MORE EXPANSIVE indicated that they want to consolidate,
compared to 15% of the in-town retailers that
Out-of-town retail Despite a marginal improvement from last
year, only 60% of retailers wished to further
indicated a plan to close stores.
expand their retail network in Belgium in The amount of out-of-town retailers planning
2020. to expand is also significantly higher than the
58 national and international retail retailers. 86% of the respondents indicated in-town retailers indication to open more
Take-up is strong thanks to a series of
chains shared their views and that they have positive growth expectations. stores. 77% of the out-of-town retailers and
newcomers, out-of-town retailers and food
performance during the month of Home & household regained some of its 49% of the in-town retailers indicated they
and beverage retailers. Food & supermarkets
December 2019 for the yearly Belgian previous strength, with 62% of retailers want to expand.
and home & household sectors remain the
CBRE Retailer Survey. Though this survey expecting stronger sales in 2020. Despite a most expansive retail segments, with 71% and In addition, out-of-town stores are a great
was held prior to the outbreak of the slight improvement, the cyclical fashion & 65% of retailers indicating a desire to open complement for retailers that do not want to
COVID-19 pandemic, it still gives a good personal care segment remained somewhat new stores in 2020, respectively. focus only on one segment, but want to open
indication of the most resilient retailers pessimistic over sales prospects. Only 36% of
stores on different types of locations.
and their future vision. fashion retailers expect stronger sales. A few
months after the outbreak of the pandemic,
OUT- OF-TOWN RETAILERS HAVE we can notice that the most optimistic
MORE OPTIMISTIC OUTLOOKS segments such as supermarket retailers and
home & household retailers also appeared to
Pre-COVID-19, the most optimistic segments
be the most resilient.
are traditionally the supermarkets and food
% of retailers expecting sales growth in 2020 Type of retailers wanting to expand or consolidate
Source: CBRE All 100%
100%
100% 90%
90%
90% 80%
80%
80% 70%
70%
70% 60%
60%
60% 50%
50%
50% 40%
40%
40% 30%
30%
30% 20%
20%
20%
10% 10%
10%
0%0% 0%
2008 In-town Out-of-town
2008 2009
2009 2010
2010 2011
2011 2012 2013
2012 2013 20142014 201520152016 20162017 2017
2018 2018
2019 2019
2020 2020
Expand Consolidate Stable Source: CBRE
Fashion & Personal Care Supermarket & Food Home & household All retailers
OCTOBER 2020 © CBRE Belgium | 68 69 | © CBRE Belgium OCTOBER 2020You can also read